fullseye
Language: 日本語 · English
A Metrology Museum on Paper — The How-It-Is-Measured Wing (restoration, space-time, calibration, colour, forensics, 3-D shape)
One wing of A Metrology Museum on Paper — the entrance, where the other wings, the glossary and the thesis live.
98 exhibits hang in this wing. The numbers are accession numbers: they do not change when an exhibit moves or when an article is split.
The “Ops used” line under each exhibit links to that op’s note (type contract, pitfalls, figures, a runnable Studio program): Operator catalogue / Op notes index.
The Image Quality and Restoration Wing — Looking Better and Getting Closer to the Truth Are Different Things
Deblurring, upscaling, dehazing, focus stacking, reconstructing from projections, ranging by counting photons. Restoration is where ‘it looks better’ and ‘it is closer to the truth’ are most easily confused. The 20 exhibits here synthesise the kernel, the depth, the airlight, the PSD, the projections and the arrival time themselves, so the two can be scored separately.
Appearance metrics do not peak at the truth: a hazy input has higher contrast than the true scene; unsharp masking matches the true gradient energy while PSNR drops; adding noise raises PSNR. Conversely, a method can restore stripes finer than Nyquist while PSNR moves by only -0.01 dB.
The null baseline placed throughout is ‘do nothing’. Deblurring with the kernel angle off by 19.4 degrees, FBP from 12 projections, dehazing at visibility above 782 m, depth in textureless regions: each loses to that baseline. Stating the losing conditions in numbers is what this room is for.
No.2026.007 —— How Much Camera Shake Can Be Undone — Make the Kernel, Apply It, Invert It, Compare
Deblurring depends on estimating motion direction and length correctly. Known linear motion was applied, and restoration was scored against the original at 20 dB SNR. A wrong angle loses to no correction, while one kernel cannot undo rotational shake whose direction changes across the frame.
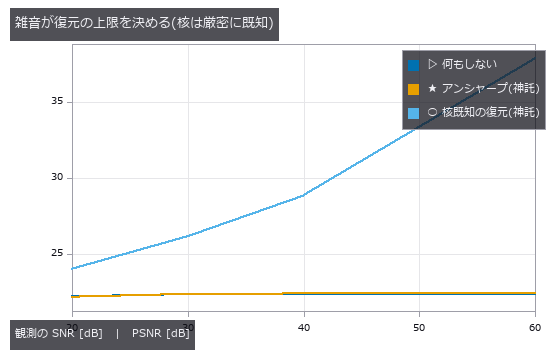
↑ How Much Camera Shake Can Be Undone — Make the Kernel, Apply It, Invert It, Compare ―― A known linear blur kernel applied and inverted, with the ceiling set by noise and by kernel estimation error. Without noise the image recovers from 22.38 to 56.41 dB; at 20 dB SNR the gain is 1.82 dB. A kernel angle off by 19.4 degrees is beaten by doing nothing, and undoing rotational blur with a single kernel makes the centre of rotation worse by -49.41 dB.
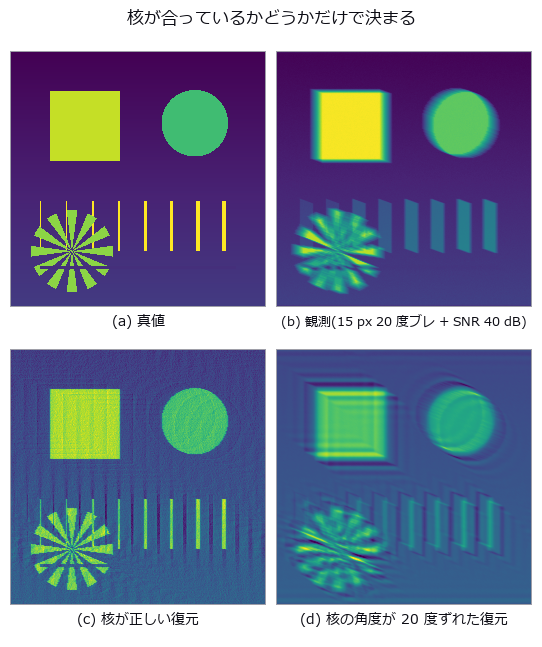
↑ The measurement ―― 4 枚目は「復元した」形をしているが、ゼロ点(観測そのもの)より悪い。絵の見た目では区別できない。 (figure labels are in Japanese; the numbers are the same)

↑ 交点が現場で効く数字。
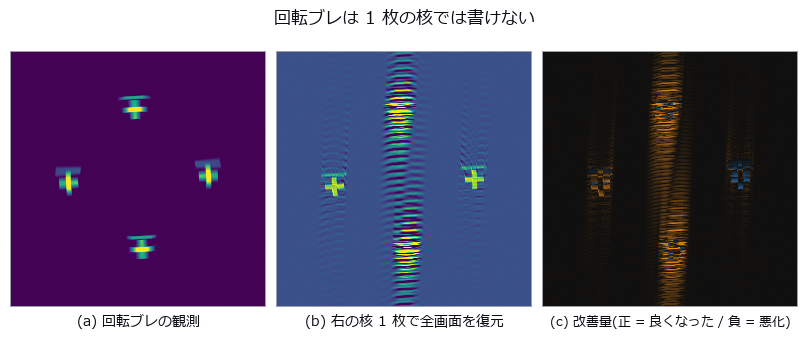
↑ 核を作った右側だけが正。
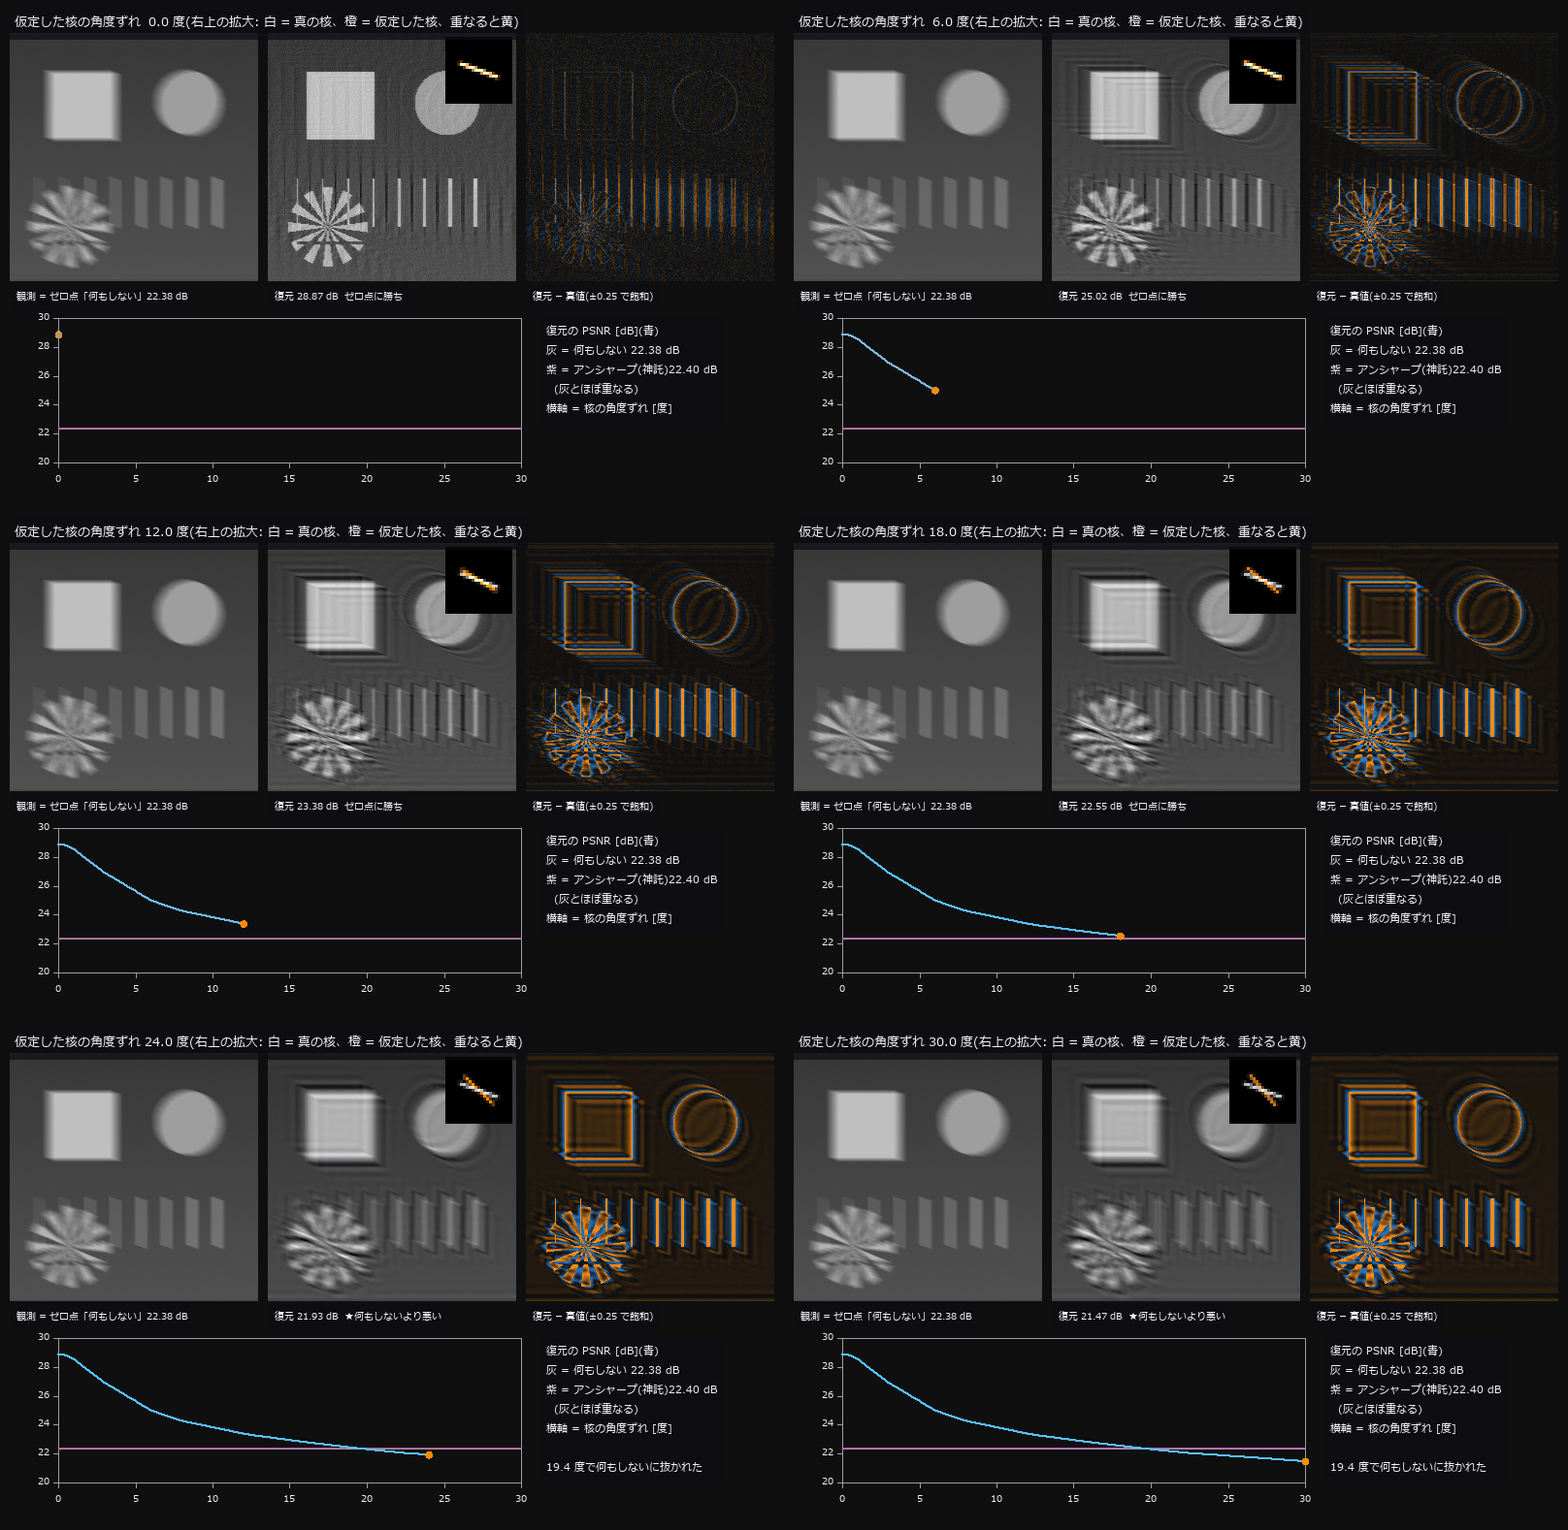
↑ The animation ―― 15 px・20 度の直線ブレに SNR 40 dB の雑音を載せた観測を、角度を 0〜30 度ずらした核で Wiener 復元し直していく(正則化量は毎回神託で最良化)。ずれ 0 度で 28.87 dB、20 度で 22.31 dB。0.5 度刻みで追うと 19.2 度でアンシャープマスク(22.40 dB)に、19.4 度で「何もしない」(22.38 dB)に抜かれる(本文の表の補間では 19.2 / 19.4 度)。抜かれた後の復元も「復元した」形をしている —— 右の誤差地図でだけ、縞状のリンギングが真値からのずれとして見える。
py -3.11 examples/poc_camera_shake_deblur.py
Source: examples/poc_camera_shake_deblur.py
This run produced 5 figures in total - see them all
Ops used (notes): axes_frame · axes_transform · plot_series · psnr · reflect · ssim · text_box · ticks · unsharp · vol_richardson_lucy
No.2026.062 —— Pseudo-colour changes what the reader decides — counting edges that are not there
A smooth field with provably zero steps was painted and the false edges counted in CIE L* and CIEDE2000 (perceptual colour-difference formula): jet raises 3, hsv 4, while viridis and gray raise none. Their positions follow in closed form from the sRGB transfer function and the CIE Y weights — jet’s lightness reversals are predicted at 0.3750 / 0.4490 / 0.6250 and measured at 0.3750 / 0.4492 / 0.6250 (max error 0.0002). A real step only out-shouts the false edges above 0.296 %FS with jet versus 0.050 %FS with viridis, matching a prediction made from the colormap LUT alone: jet demands a 5.9x taller step. The value-to-colour mapping matters more than the palette — over a 4.3-decade 1/r^2 field the effective number of distinguishable levels goes from 1.4 (linear) to 76.0 (rank) — and a single outlier costs log 41 % of them (27.4 to 16.3) while percentile and rank are untouched.

↑ Pseudo-colour changes what the reader decides — counting edges that are not there ―― A smooth field with provably zero steps was painted and the false edges counted in CIE L and CIEDE2000 (perceptual colour-difference formula): jet raises 3, hsv 4, while viridis and gray raise none. Their positions follow in closed form from the sRGB transfer function and the CIE Y weights — jet’s lightness reversals are predicted at 0.3750 / 0.4490 / 0.6250 and measured at 0.3750 / 0.4492 / 0.6250 (max error 0.0002). A real step only out-shouts the false edges above 0.296 %FS with jet versus 0.050 %FS with viridis, matching a prediction made from the colormap LUT alone: jet demands a 5.9x taller step. The value-to-colour mapping matters more than the palette — over a 4.3-decade 1/r^2 field the effective number of distinguishable levels goes from 1.4 (linear) to 76.0 (rank) — and a single outlier costs log 41 % of them (27.4 to 16.3) while percentile and rank are untouched.*
Terms: CIEDE2000 — A CIE colour-difference formula in CIELAB that corrects the lightness, chroma, and hue terms to better follow visual differences.

↑ The measurement ―― 平らなら偽の境目は立たない。jet と hsv の山がそのまま『見えてしまう帯』になる。 (figure labels are in Japanese; the numbers are the same)

↑ この回の図

↑ jet の輪が偽の境目。

↑ 左は範囲外と『ちょうど端』が同じ色。

↑ 番号の大小に意味は無いのに、連続マップは『近い番号 = 近い領域』と読ませる。
py -3.11 examples/poc_colormap_readability.py
Source: examples/poc_colormap_readability.py
This run produced 14 figures in total - see them all
Ops used (notes): delta_e_map · percentile · rgb_to_lab
No.2026.118 —— The Fly’s Compound Eye Is a Light-Field Sensor — Neural Superposition Pays Only Up to the Knee
A 9×9 plenoptic synthesis of the ommatidial array, measuring the SNR gain when the same point is pooled over N ommatidia. For small apertures √N holds almost exactly (N=5: 2.25 vs 2.24), but for large ones the gain saturates (N=49: 5.33 vs 7.00). The cause is not the noise but the error in the outer 4 pixels of the shifted views: the noise-only gain is 7.05 (√N holds), and excluding an 8-pixel border gives 7.19. The fly’s six-fold pooling of R1–R6 sits below the knee. Depth comes from the array (near +1.998, far +0.499 against true 2.00 / 0.50), and a minority occluder is seen through by median pooling (RMS on hidden pixels: single view 0.237 → mean 0.065 → median 0.025).
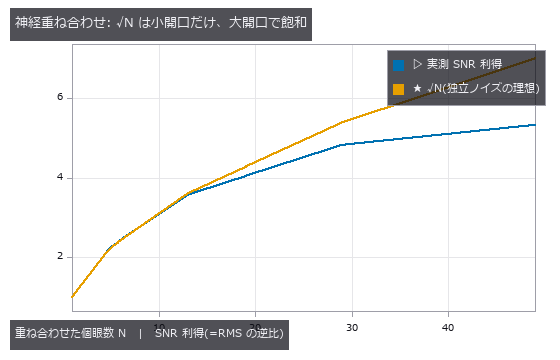
↑ The Fly’s Compound Eye Is a Light-Field Sensor — Neural Superposition Pays Only Up to the Knee ―― A 9×9 plenoptic synthesis of the ommatidial array, measuring the SNR gain when the same point is pooled over N ommatidia. For small apertures √N holds almost exactly (N=5: 2.25 vs 2.24), but for large ones the gain saturates (N=49: 5.33 vs 7.00). The cause is not the noise but the error in the outer 4 pixels of the shifted views: the noise-only gain is 7.05 (√N holds), and excluding an 8-pixel border gives 7.19. The fly’s six-fold pooling of R1–R6 sits below the knee. Depth comes from the array (near +1.998, far +0.499 against true 2.00 / 0.50), and a minority occluder is seen through by median pooling (RMS on hidden pixels: single view 0.237 → mean 0.065 → median 0.025).
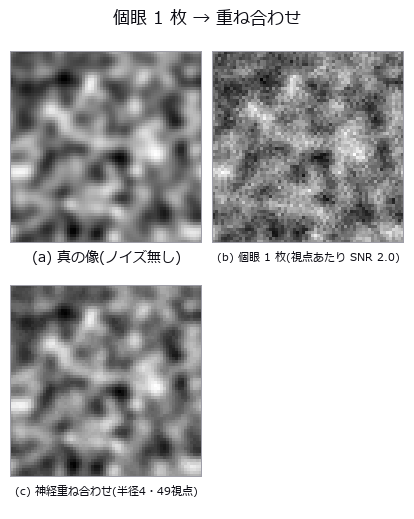
↑ The measurement (figure labels are in Japanese; the numbers are the same)
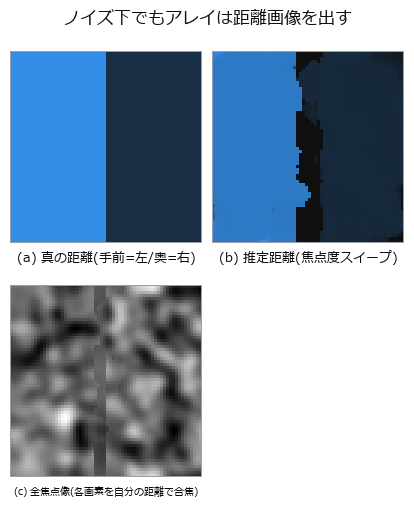
↑ この回の図
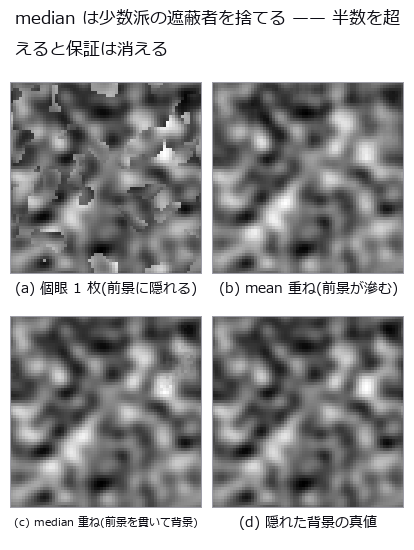
↑ この回の図
py -3.11 examples/poc_compound_eye.py
Source: examples/poc_compound_eye.py
This run produced 4 figures in total - see them all
Ops used (notes): lf_all_in_focus · lf_aperture_mask · lf_depth_from_focus · lf_plenoptic_design · lf_subaperture · lf_synthesize · lf_synthetic_aperture · median
No.2026.011 —— Removing Haze — Ground Truth From the Scattering Model, Transmission and Airlight Scored Apart
A hazy image built from depth, airlight and extinction so that the true transmission and the true scene are both known, then dehazed and scored. The overall +4.04 dB hides a -1.49 dB degradation of the near field covered by +4.03 dB mid and +11.28 dB far. Above 782 m visibility dehazing does harm, and adding noise raises PSNR (an accidental cancellation).
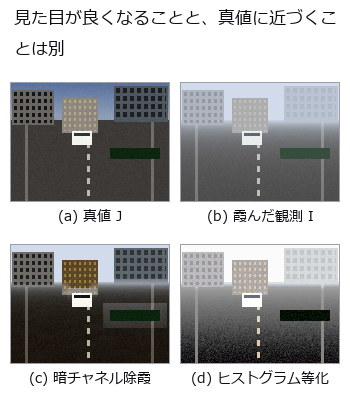
↑ Removing Haze — Ground Truth From the Scattering Model, Transmission and Airlight Scored Apart ―― A hazy image built from depth, airlight and extinction so that the true transmission and the true scene are both known, then dehazed and scored. The overall +4.04 dB hides a -1.49 dB degradation of the near field covered by +4.03 dB mid and +11.28 dB far. Above 782 m visibility dehazing does harm, and adding noise raises PSNR (an accidental cancellation).
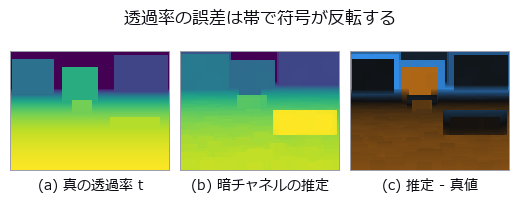
↑ The measurement ―― 空では過大評価(明るい側)、近景では過小評価(暗い側)。全体の平均バイアスでは打ち消し合って見えない。 (figure labels are in Japanese; the numbers are the same)
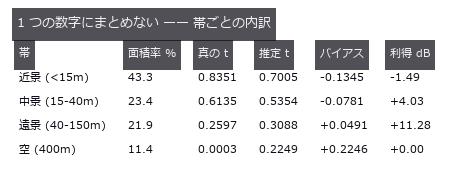
↑ 全体 +4.04 dB の正体。
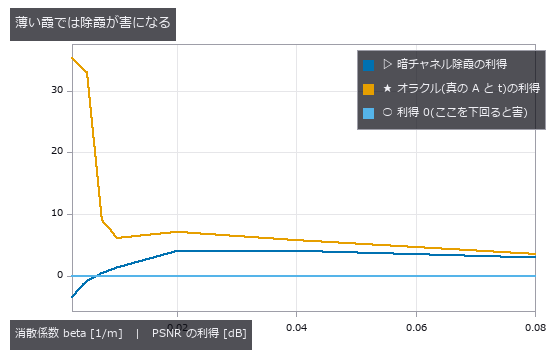
↑ 左端(薄い霞 = 視程が長い側)で利得が 0 を割る。
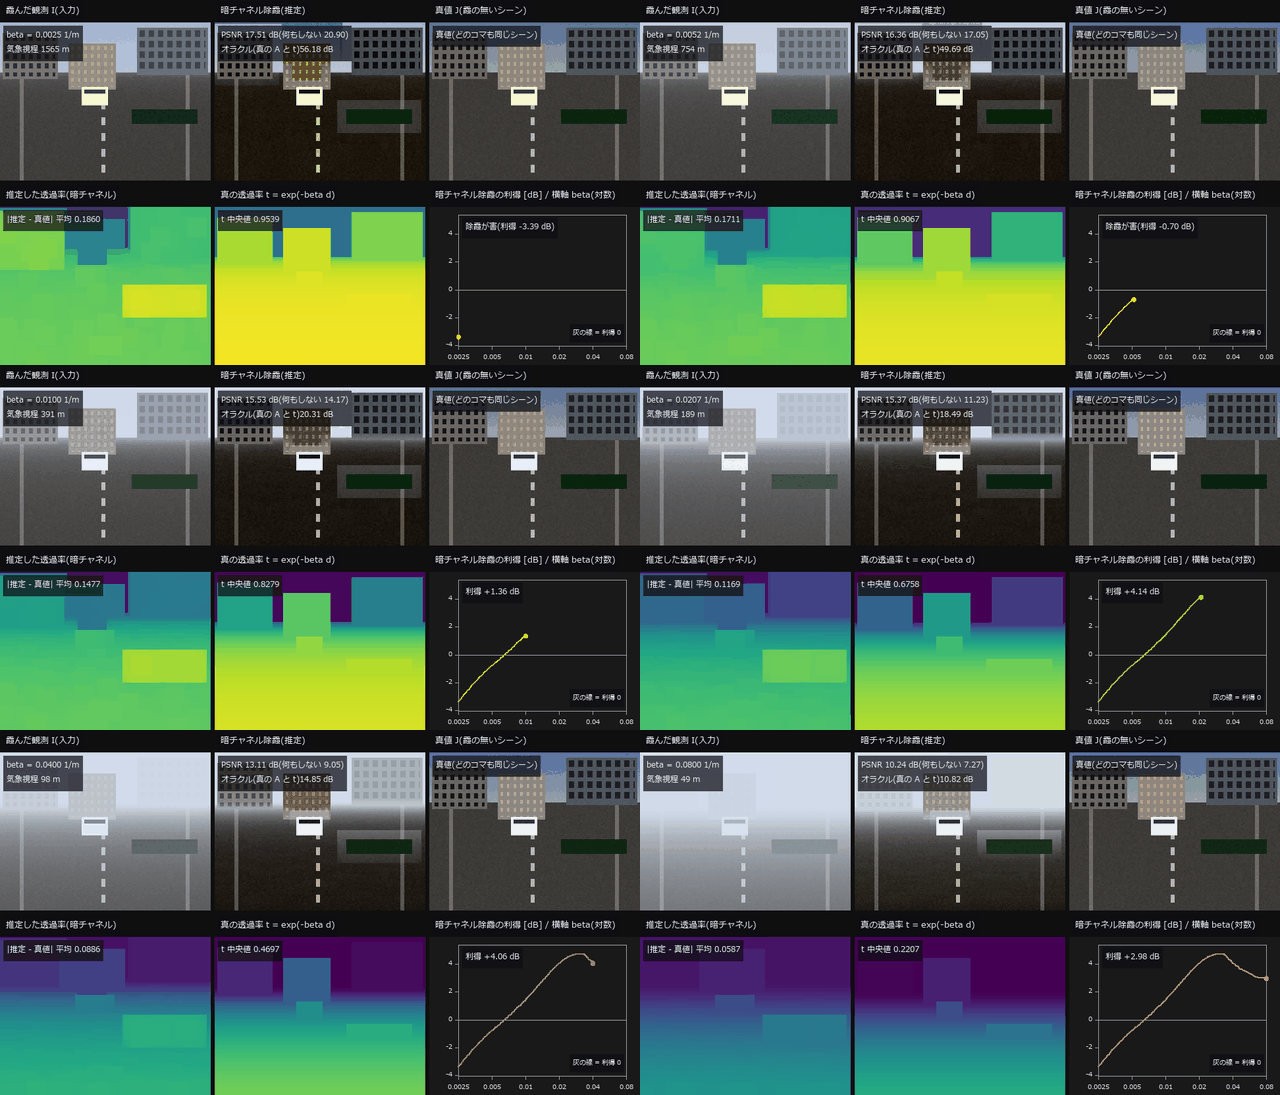
↑ The animation ―― 動画(110 コマ、120 × 160 px を 2 倍で表示): 消散係数 beta を 0.0025(視程 1565 m)から 0.08(視程 49 m)まで連続に振る。上段は霞んだ観測・暗チャネル除霞・真値、下段は推定した透過率・真の透過率と、暗チャネル除霞の PSNR 利得(対 何もしない)の曲線。利得は beta ≦ 0.0065(視程 606 m 以上)で負 = 薄い霞では除霞が害になる(5 節の 7 点の表では 0.0050 と 0.0075 の間)。濃霧の端では +2.98 dB。真の A と t を与えたオラクルの PSNR は中央上の板に併記。表示は 8 bit に丸めた観測をそのまま使っている。
py -3.11 examples/poc_dehazing.py
Source: examples/poc_dehazing.py
This run produced 5 figures in total - see them all
Ops used (notes): axes_frame · axes_transform · clahe · equalize · image_entropy · joint_bilateral · nice_ticks · plot_series · psnr · rank_image · scene_radiance · ssim · text_box · ticks
No.2026.119 —— The Fly’s Visual Front End as a Chain of Operators — Turning and Walking Through a Synthetic Sky, What Can and Cannot Be Read
| One eye assembled from a 721-ommatidium hexagonal lattice → acceptance function → lamina DC removal → Hassenstein-Reichardt correlators → HS opponent sum, turning under a 1/f banded sky. The direction and waveform of self-rotation are readable (correlation with the true yaw rate +0.785, +0.880 with a membrane low-pass, sign agreement 0.92), but skipping the lamina DC removal makes the correlator emit a DC × high-pass ripple and the correlation drops to +0.504. Walking forward without turning, the full-field readout turns into a −0.689 ‘rotation’; restricting to the upper field still leaks −0.221 because acceptance functions straddle the horizon (0.000 above el = 2Δρ). The opponent ratio discards speed, so a 1.4°/s flow from a dome 20 m away reads −0.612. The LGMD η peak comes α·l/ | v | before collision (−0.1570 s, predicted −0.1567 s) at θ = 23.97° (predicted 24.02°; 24.6° for the exact subtense of a sphere, a quartic root), the sphere τ rides d/ | v | with RMS 1e-5 s, and the disk formula misapplied to a sphere reads cos²(θ/2) = 0.75× at 60°. Twelve grating directions give DSI 0.798 with preferred direction 0°. |
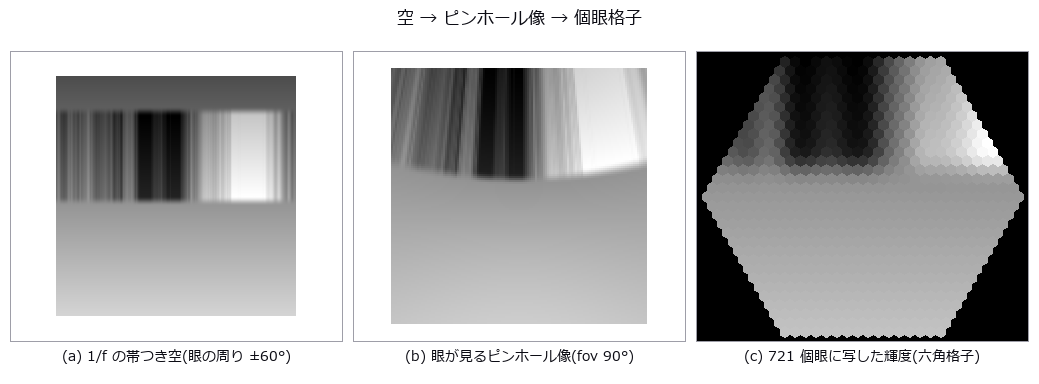
| *↑ The Fly’s Visual Front End as a Chain of Operators — Turning and Walking Through a Synthetic Sky, What Can and Cannot Be Read ―― One eye assembled from a 721-ommatidium hexagonal lattice → acceptance function → lamina DC removal → Hassenstein-Reichardt correlators → HS opponent sum, turning under a 1/f banded sky. The direction and waveform of self-rotation are readable (correlation with the true yaw rate +0.785, +0.880 with a membrane low-pass, sign agreement 0.92), but skipping the lamina DC removal makes the correlator emit a DC × high-pass ripple and the correlation drops to +0.504. Walking forward without turning, the full-field readout turns into a −0.689 ‘rotation’; restricting to the upper field still leaks −0.221 because acceptance functions straddle the horizon (0.000 above el = 2Δρ). The opponent ratio discards speed, so a 1.4°/s flow from a dome 20 m away reads −0.612. The LGMD η peak comes α·l/ | v | before collision (−0.1570 s, predicted −0.1567 s) at θ = 23.97° (predicted 24.02°; 24.6° for the exact subtense of a sphere, a quartic root), the sphere τ rides d/ | v | with RMS 1e-5 s, and the disk formula misapplied to a sphere reads cos²(θ/2) = 0.75× at 60°. Twelve grating directions give DSI 0.798 with preferred direction 0°.* |
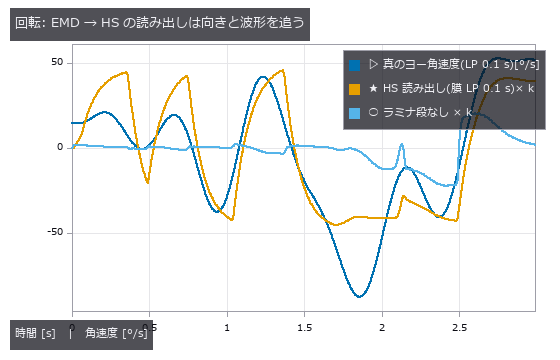
↑ The measurement ―― 相関 +0.785(膜 LP つき +0.880、ラミナ段なし +0.504)。対向比は符号の一致度なので、尺度 k は最小二乗で合わせてある。 (figure labels are in Japanese; the numbers are the same)

↑ 偏り: 全視野 -0.689 / 上半 el>0 -0.221 / el>2Δρ +0.000 / ドーム -0.612

↑ ピーク -0.157 s(予測 -0.157 s)、θ_peak 24.0°(予測 24.0°)。

↑ 球式は RMS 0.00001 s で真値に乗る。
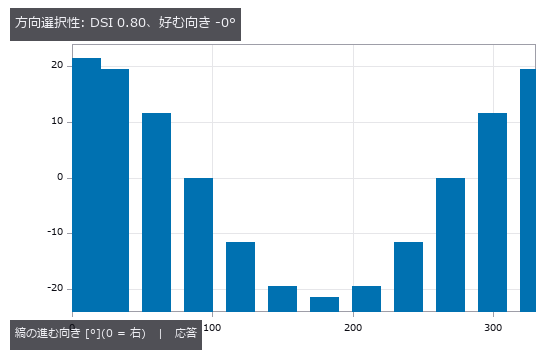
↑ 負の応答(逆向き)は fly_dsi が 0 に切る。
py -3.11 examples/poc_fly_vision.py
Source: examples/poc_fly_vision.py
This run produced 6 figures in total - see them all
Ops used (notes): fly_dsi · fly_emd_response · fly_hex_lattice · fly_hex_resample · fly_hs_readout · fly_lgmd_eta · fly_sky_1f · fly_tau_from_expansion
No.2026.019 —— Focus Stacking — The All-in-Focus Image and the Depth Map Are Different Things
An all-in-focus image and a depth map pulled from 17 frames blurred by the closed-form circle of confusion. The all-in-focus image reaches 33.69 dB (null = the middle frame, 28.52 dB), yet the depth from the same fusion loses to the null by 6x (0.16x) in textureless regions. A relative confidence scores 0.9575 there, higher than the 0.9381 of textured regions; rejecting by absolute value (1038x apart) brings the RMS from 0.918 to 0.817 mm.
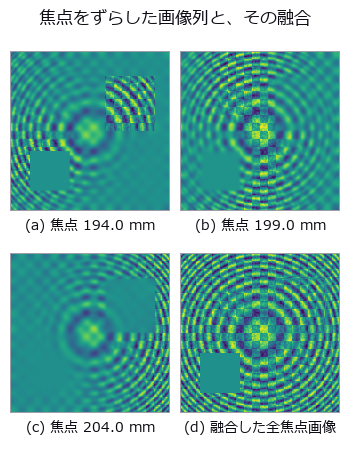
↑ Focus Stacking — The All-in-Focus Image and the Depth Map Are Different Things ―― An all-in-focus image and a depth map pulled from 17 frames blurred by the closed-form circle of confusion. The all-in-focus image reaches 33.69 dB (null = the middle frame, 28.52 dB), yet the depth from the same fusion loses to the null by 6x (0.16x) in textureless regions. A relative confidence scores 0.9575 there, higher than the 0.9381 of textured regions; rejecting by absolute value (1038x apart) brings the RMS from 0.918 to 0.817 mm.
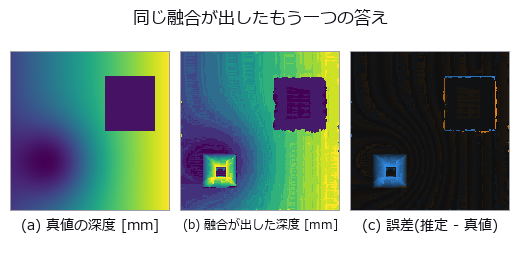
↑ The measurement ―― 合焦点法は全焦点画像と同時に距離画像も出す。ただし左下の無テクスチャの四角だけ、誤差が掃引全域にばらけた乱数になっている(段差帯のハローも見える)—— 絵ほど距離は当てにならない。 (figure labels are in Japanese; the numbers are the same)
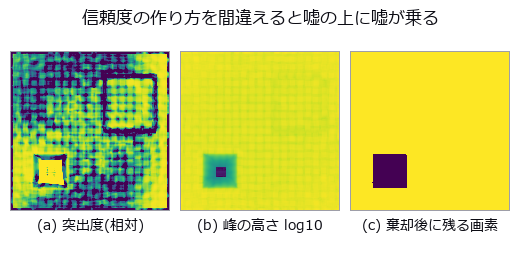
↑ 左下の無テクスチャの四角が、相対量(0.90-1.00 に切って表示)では最も明るい = 自信ありに見え、絶対量(対数)でだけ「何も見えていない」と出る。
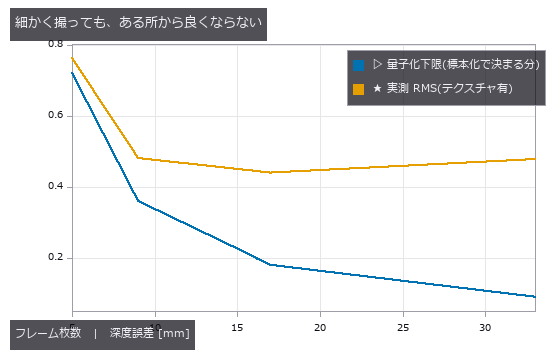
↑ 2 本が離れていく = 残りの誤差は標本化ではなく焦点評価が持っている。
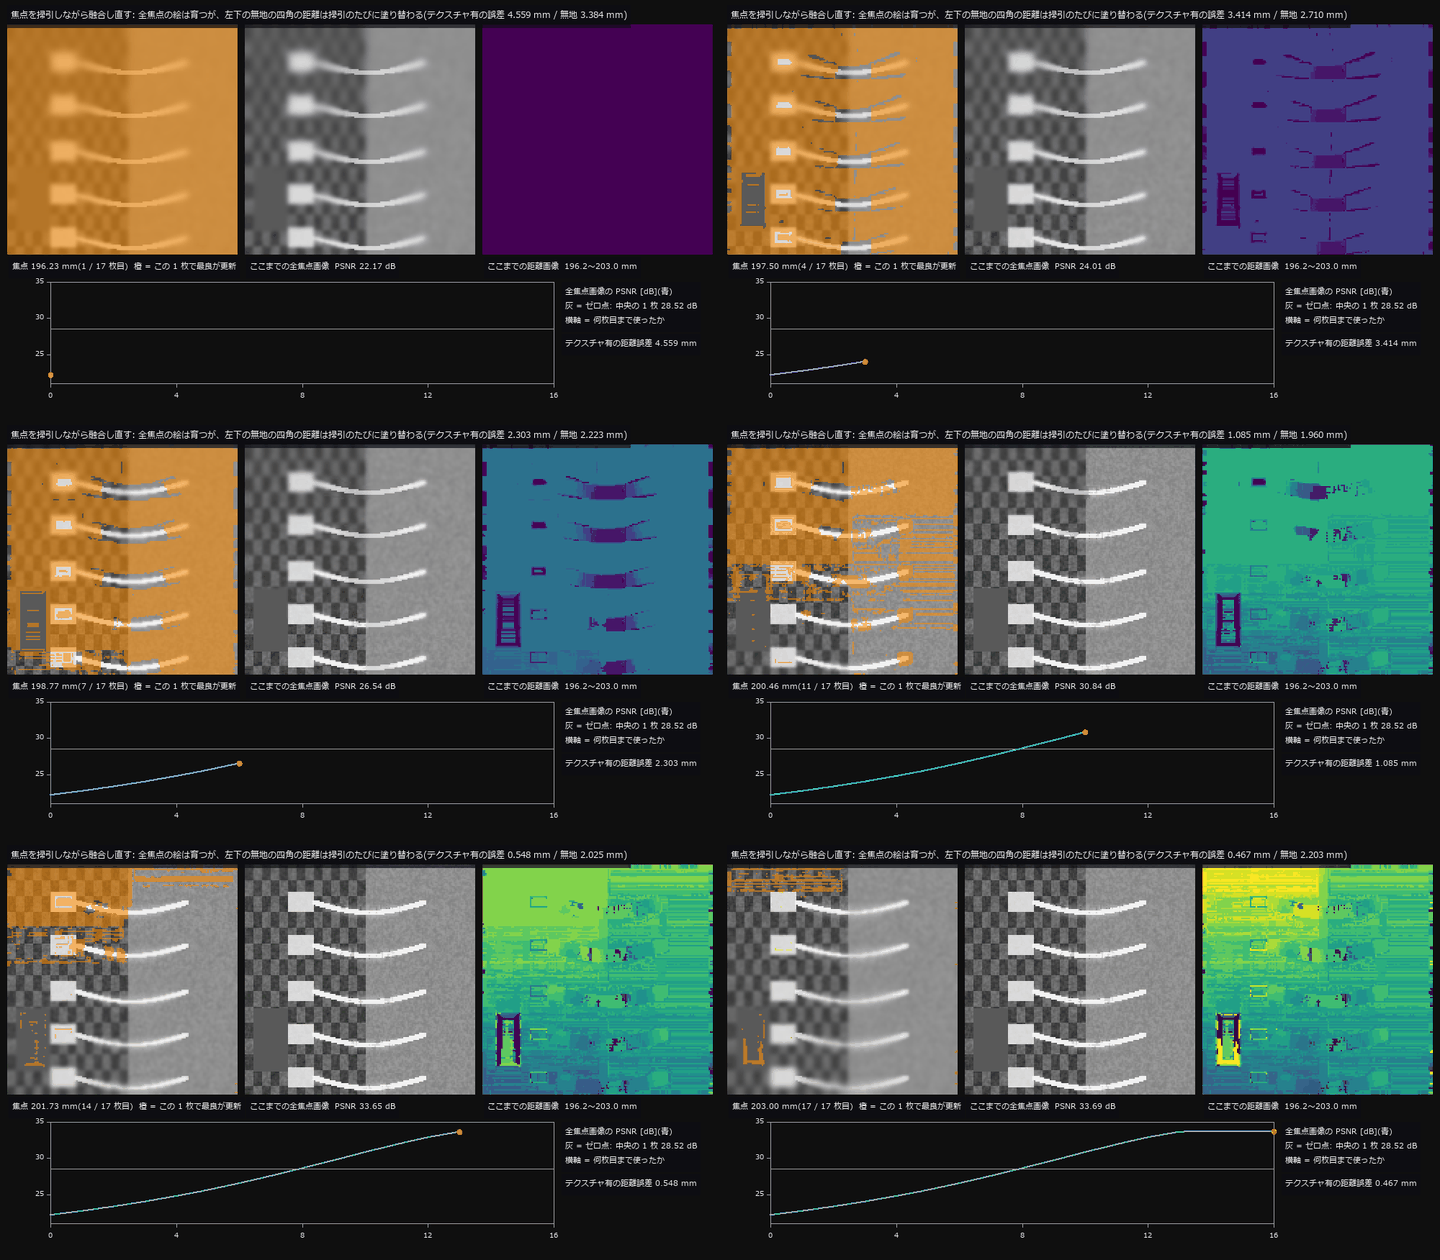
↑ The animation ―― 焦点を 196.23〜203.00 mm で 17 枚掃引し、1 枚進むたびに「ここまでで焦点評価が最大のフレーム」を画素ごとに選び直す。左 = いまの 1 枚(橙 = この 1 枚で最良が更新された画素)、中 = ここまでの全焦点画像、右 = ここまでの距離画像。全焦点画像の PSNR は 22.17 dB から 33.69 dB へ育ち、中央の 1 枚(28.52 dB)を上回る。一方、左下の無地の四角は最後まで掃引のたびに塗り替わり(最後の 1 枚でも無地の 12 % が入れ替わる。テクスチャ有は 4 %)、距離誤差は 2.203 mm(テクスチャ有 0.467 mm)で終わる。
py -3.11 examples/poc_focus_stacking.py
Source: examples/poc_focus_stacking.py
This run produced 5 figures in total - see them all
Ops used (notes): axes_frame · axes_transform · csi_height_map · defocus_blur · depth_from_focus · dilation_circle · fuse · gauss_filter · laplace · mean_image · optical_camera · plot_series · psnr · sobel_amp · text_box · ticks · xcv2_lap_var
No.2026.105 —— Deblurring a Real Photograph — Three Rulers, Three Different Winners
The truth here is a real photograph (scikit-image camera, CC0) and only the degradation is planted: a straight 11-pixel blur at 20 degrees plus noise of sigma 0.004. Doing nothing scores 24.04 dB, and a Wiener filter at the commonly used nsr of 0.005 scores 23.66 — it loses to the null. Stopping there would be misrepresenting the method: sweeping nsr gives 19.18 dB at 0.0005 and 25.40 dB at 0.02, so a fixed knob is not a comparison at all. The knob moves the result by 6.22 dB while deconvolving at all is worth 1.36 dB, a factor of 4.6 — the setting matters more than the method. Applying three rulers to the same seven results puts three different methods first: PSNR picks the correct-PSF Wiener at 25.40 dB, gradient energy picks motion_deblur at 0.2986, which is 1.54 times the truth’s own 0.1936 — an image sharper than the truth wins — and blur_effect picks unsharp. The methods those reference-free rulers choose cost 4.98 dB and 3.26 dB against the best. In fairness, blur_effect does rank the truth itself above every method: it measures blur correctly and still loses you three decibels when used to choose. Mistaking the blur length as 21 instead of 11 costs 5.48 dB against doing nothing while raising the gradient energy to 1.37 times the truth, so it looks like it worked. The cliffs: at sigma 0.016 the gain falls to 0.05 dB, and the gain over blur length peaks at 5 pixels, falling at both ends because a short blur has little to remove and a long one has destroyed the information.
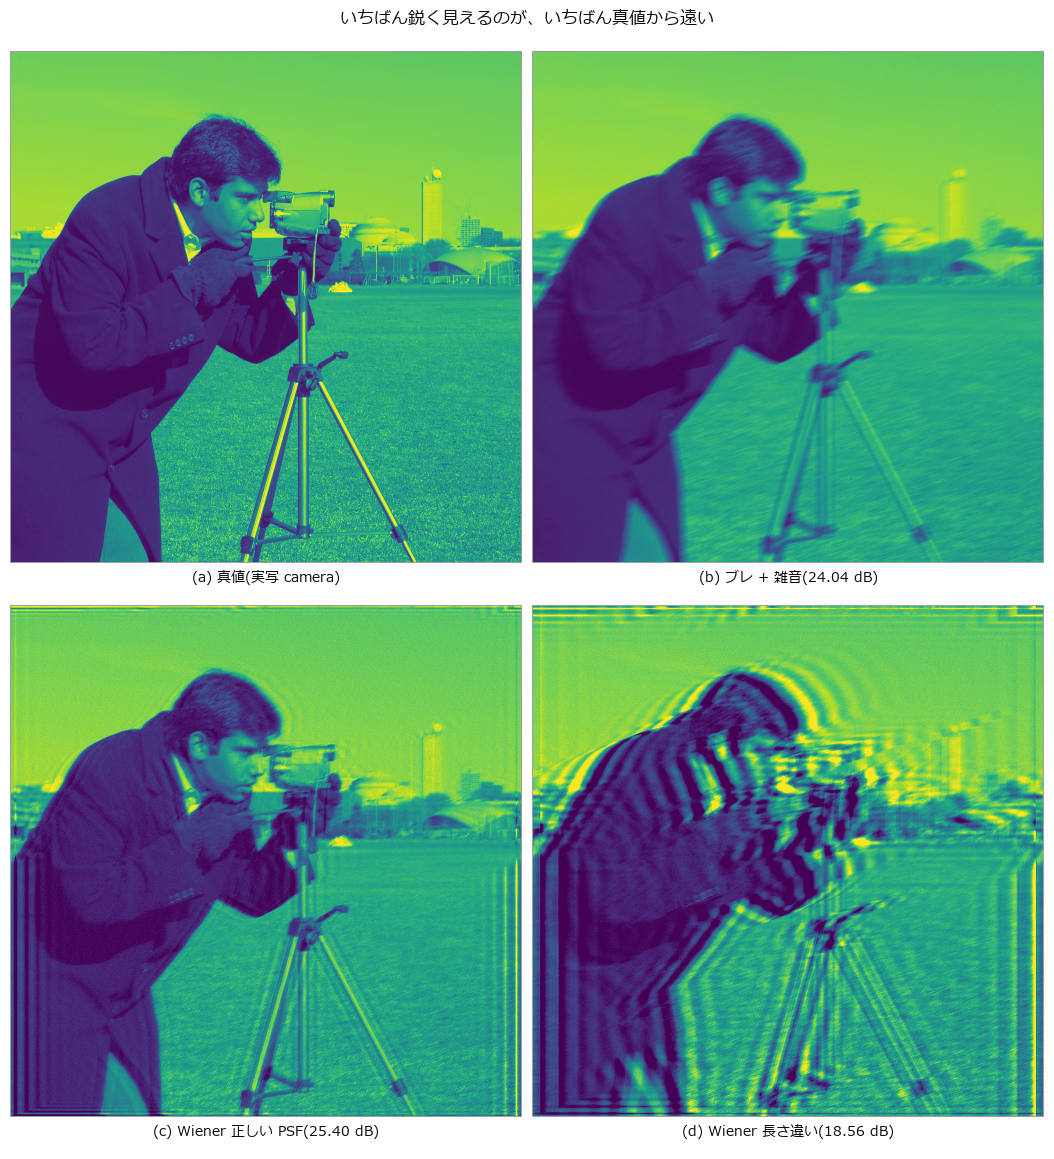
↑ Deblurring a Real Photograph — Three Rulers, Three Different Winners ―― The truth here is a real photograph (scikit-image camera, CC0) and only the degradation is planted: a straight 11-pixel blur at 20 degrees plus noise of sigma 0.004. Doing nothing scores 24.04 dB, and a Wiener filter at the commonly used nsr of 0.005 scores 23.66 — it loses to the null. Stopping there would be misrepresenting the method: sweeping nsr gives 19.18 dB at 0.0005 and 25.40 dB at 0.02, so a fixed knob is not a comparison at all. The knob moves the result by 6.22 dB while deconvolving at all is worth 1.36 dB, a factor of 4.6 — the setting matters more than the method. Applying three rulers to the same seven results puts three different methods first: PSNR picks the correct-PSF Wiener at 25.40 dB, gradient energy picks motion_deblur at 0.2986, which is 1.54 times the truth’s own 0.1936 — an image sharper than the truth wins — and blur_effect picks unsharp. The methods those reference-free rulers choose cost 4.98 dB and 3.26 dB against the best. In fairness, blur_effect does rank the truth itself above every method: it measures blur correctly and still loses you three decibels when used to choose. Mistaking the blur length as 21 instead of 11 costs 5.48 dB against doing nothing while raising the gradient energy to 1.37 times the truth, so it looks like it worked. The cliffs: at sigma 0.016 the gain falls to 0.05 dB, and the gain over blur length peaks at 5 pixels, falling at both ends because a short blur has little to remove and a long one has destroyed the information.
Terms: Wiener — A linear filter that uses signal and noise statistics to minimize mean squared estimation error.
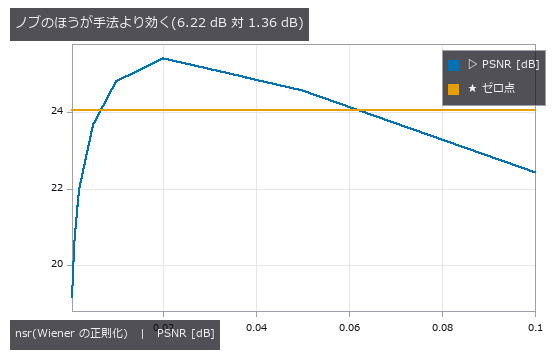
↑ The measurement ―― 固定した nsr で比べると、正しい PSF でもゼロ点に負ける。 (figure labels are in Japanese; the numbers are the same)
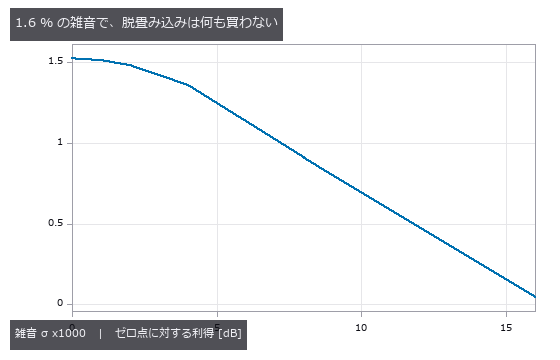
↑ σ=0 で +1.52 dB、σ=0.016 で +0.05 dB。
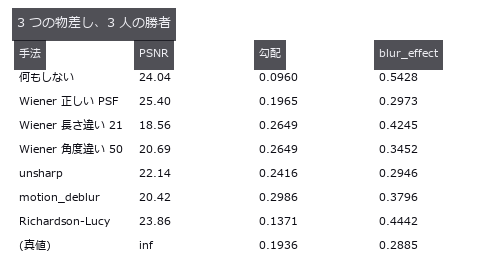
↑ 参照なし指標が選ぶ手法は PSNR で 3〜5 dB 劣る。
py -3.11 examples/poc_real_deblur_honesty.py
Source: examples/poc_real_deblur_honesty.py
This run produced 4 figures in total - see them all
Ops used (notes): iv_motion_deblur · iv_richardson_lucy · iv_unsharp_deblur · psnr · reflect · sk_blur_effect · unsharp
No.2026.039 —— Does Super-Resolution Add Information? Downsample With the Truth in Hand, Restore, Count
Observations made by downsampling the truth, with single-image upscaling, iterative back-projection and drizzle scored on a resolution table. No single-image upscaler beats the bicubic null by more than +0.036 dB. Drizzling 16 sub-pixel-shifted frames gains +13.96 dB in the undersampled condition, and the modulation of a period-6 pattern beyond Nyquist rises from 0.03 to 0.38.
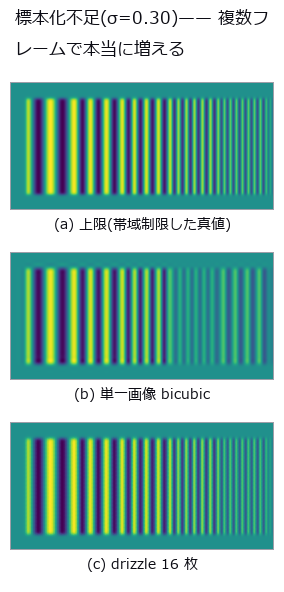
↑ Does Super-Resolution Add Information? Downsample With the Truth in Hand, Restore, Count ―― Observations made by downsampling the truth, with single-image upscaling, iterative back-projection and drizzle scored on a resolution table. No single-image upscaler beats the bicubic null by more than +0.036 dB. Drizzling 16 sub-pixel-shifted frames gains +13.96 dB in the undersampled condition, and the modulation of a period-6 pattern beyond Nyquist rises from 0.03 to 0.38.
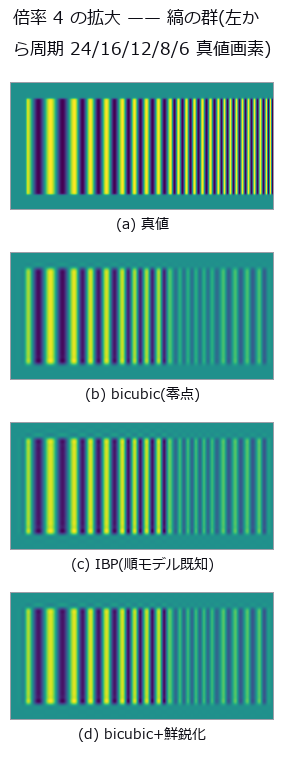
↑ The measurement ―― 鮮鋭化だけがナイキスト(周期 8)より細かい列にも縞を作る。それは分解能ではなく無い縞。 (figure labels are in Japanese; the numbers are the same)
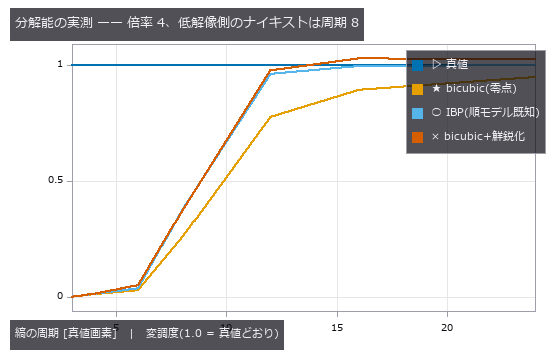
↑ IBP は周期 12 以上の落ちた変調を戻すが、8 より細かい列は1 本も戻らない(順モデルの零空間)。
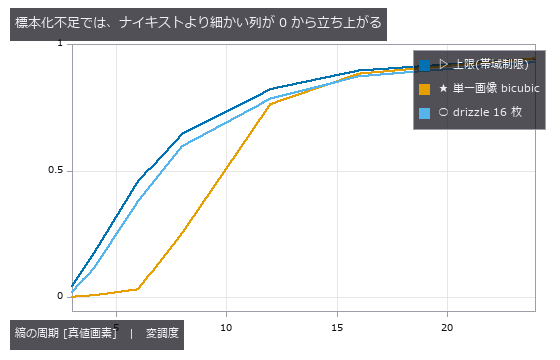
↑ 上限の線がレンズの許す限界。
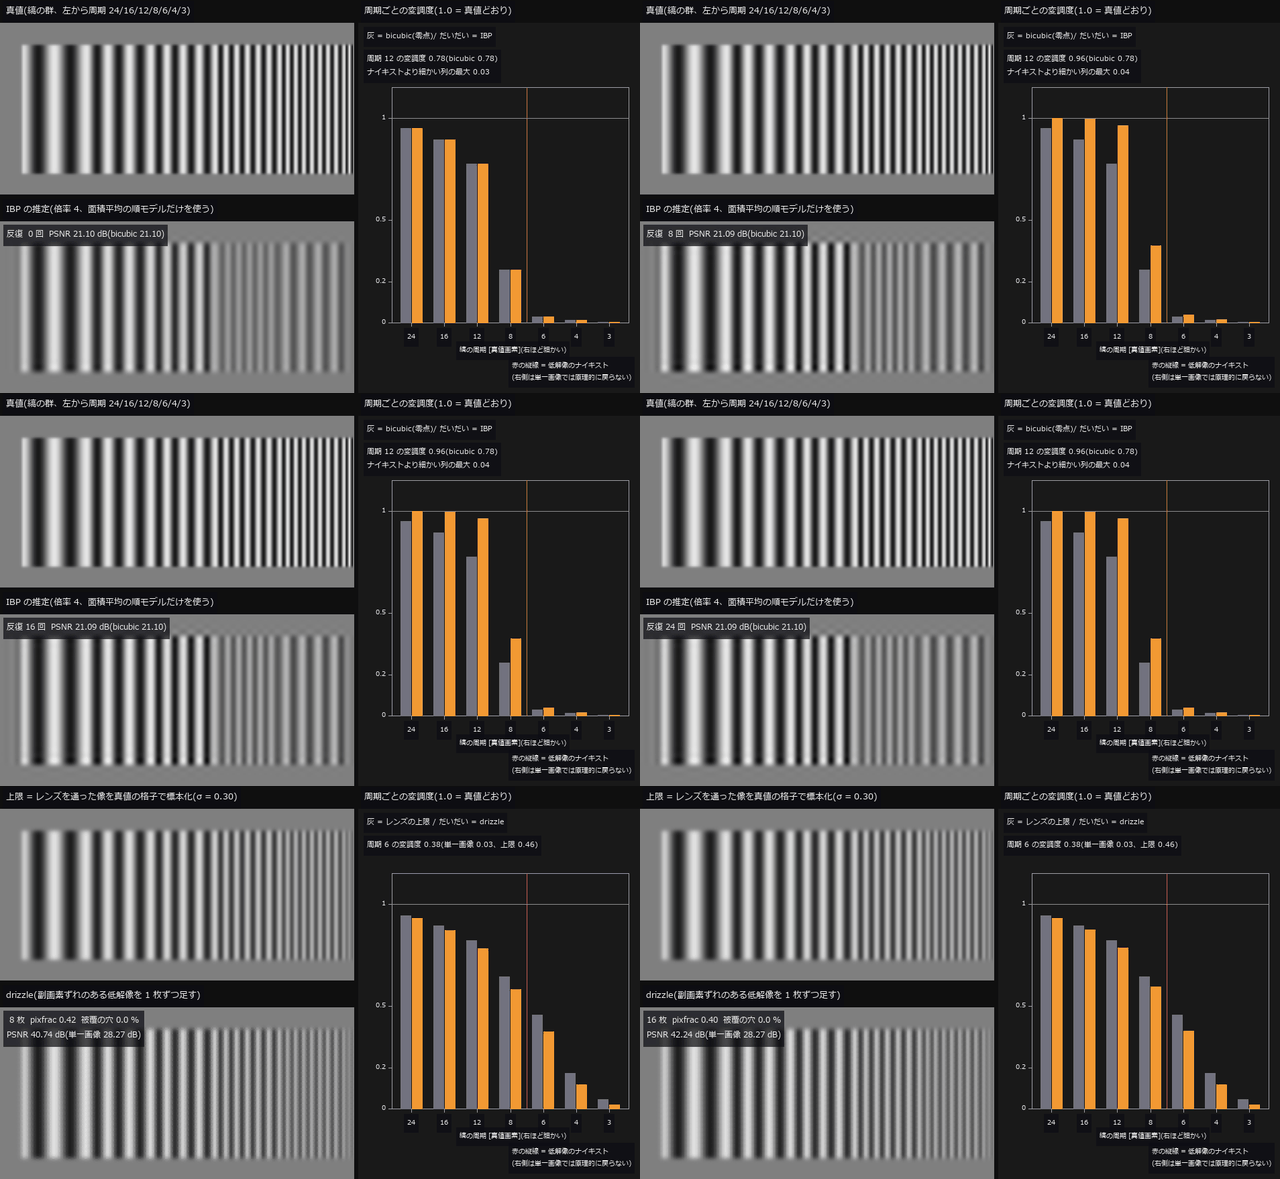
↑ The animation ―― 動画(61 コマ、縞の群を 2 倍で表示): 前半は単一画像の IBP を 0 → 24 回。周期 12 の変調度は 0.78 → 0.96 と戻るが、ナイキスト(周期 8)より細かい列の最大は 0.03 → 0.04 にとどまる —— 順モデルの零空間に落ちた縞は何回回しても立たない(PSNR も 21.10 → 21.09 dB で動かない)。後半は標本化不足(σ = 0.30)の 16 枚を 1 枚ずつ drizzle に足す(ずれは相互相関で推定、pixfrac は枚数に合わせて 1.0 → 0.4、被覆の穴は単一画像の bicubic で埋めて割合を表示)。周期 6 の変調度は単一画像の 0.03 から 16 枚で 0.38 まで立ち上がる(レンズの上限 0.46)。PSNR は 28.27 → 42.24 dB。
py -3.11 examples/poc_superresolution_limits.py
Source: examples/poc_superresolution_limits.py
This run produced 5 figures in total - see them all
Ops used (notes): axes_frame · axes_transform · data_to_pixel · drizzle_resample · piv_cross_correlate · plot_series · psnr · ssim · text_box · ticks · unsharp · vol_fft_lowpass · vol_resize · volume_downsample
No.2026.194 —— Measuring Image-Quality Metrics Against a Public Ground Truth — TID2013’s 3,000 Images × 971 Observers and the Authors’ Published Values as the Gate
The first image-side PoC under the new rule of bringing the truth in from outside. Truth = TID2013 (Ponomarenko et al., 25 references × 24 distortions × 5 levels = 3,000 images, MOS from 971 observers); reference = the 14 metric value files the authors ship with the data (psnr.txt, ssim.txt, …) and their published rank-correlation table. The new module iqatid (11 ops): the authors’ luminance convention (BT.601 limited-range integer Y′, not stated on the page and found by measurement; full-range Y is 1.321 dB off), Spearman with average ranks and Kendall τ_b (these two reproduce all 14 published rows), the published table, the index reader with validation (3,000 rows, the name set must match the files on disk, case-insensitive), evaluation, comparison with the authors’ values and per-distortion correlation. Figures: MOS vs PSNR / SSIM scatter, SROCC per distortion type (local block distortion 0.15 / 0.63, contrast 0.44 / 0.45 and saturation 0.22 / 0.22 are weak), histograms of the differences to the authors’ values, a table of published / reproduced / Fullseye values for 14 metrics, and one reference–distorted pair with its SSIM map. 21 gates: closed forms for the rank correlations (monotone 1, reversed −1, hand-computed ties ρ = 8.5/√95 and τ_b = 7/√90, 1e-12 against the second implementation in graphinv), Y′ endpoints 16 / 235, PSNR of a 1-LSB shift = 48.13 dB, SSIM identity 1, the 14-row published table. Real data, 3,000 pairs in 110 s: Fullseye’s RGB PSNR matches the authors’ PSNRc to four decimals (max 0.00005 dB), luminance PSNR matches to 0.00017 dB on the 2,774 pairs outside reference I12 (I12’s 115 pairs have 28 pixels whose luminance lands exactly on .5 and round the other way, 0.00058 dB; reported as a separate gate rather than silently dropped), SSIM on Y′ to 0.000051, rank correlations PSNR 0.6395 / 0.4699 (published 0.640 / 0.470) and SSIM 0.6370 / 0.4635 (0.637 / 0.464), and the 14 authors’ rows reproduced to 0.00048. The authors write exact matches of luminance PSNR as 100000.0 (111 rows, all saturation changes). Honestly: the four-decimal agreement comes from following the same original implementation’s conventions (the old ssim_index.m: 11×11 Gaussian σ 1.5, borders cropped, no downsampling), not from SSIM being good (it ranks 10th of 14). FSIM / FSIMc / VIF / GMSD are not implemented; only their published values are tabulated. Images and MOS are not committed (research-and-education-only terms, FULLSEYE_TID2013_DATA). CI runs the synthetic gates only.

↑ Measuring Image-Quality Metrics Against a Public Ground Truth — TID2013’s 3,000 Images × 971 Observers and the Authors’ Published Values as the Gate ―― The first image-side PoC under the new rule of bringing the truth in from outside. Truth = TID2013 (Ponomarenko et al., 25 references × 24 distortions × 5 levels = 3,000 images, MOS from 971 observers); reference = the 14 metric value files the authors ship with the data (psnr.txt, ssim.txt, …) and their published rank-correlation table. The new module iqatid (11 ops): the authors’ luminance convention (BT.601 limited-range integer Y′, not stated on the page and found by measurement; full-range Y is 1.321 dB off), Spearman with average ranks and Kendall τ_b (these two reproduce all 14 published rows), the published table, the index reader with validation (3,000 rows, the name set must match the files on disk, case-insensitive), evaluation, comparison with the authors’ values and per-distortion correlation. Figures: MOS vs PSNR / SSIM scatter, SROCC per distortion type (local block distortion 0.15 / 0.63, contrast 0.44 / 0.45 and saturation 0.22 / 0.22 are weak), histograms of the differences to the authors’ values, a table of published / reproduced / Fullseye values for 14 metrics, and one reference–distorted pair with its SSIM map. 21 gates: closed forms for the rank correlations (monotone 1, reversed −1, hand-computed ties ρ = 8.5/√95 and τ_b = 7/√90, 1e-12 against the second implementation in graphinv), Y′ endpoints 16 / 235, PSNR of a 1-LSB shift = 48.13 dB, SSIM identity 1, the 14-row published table. Real data, 3,000 pairs in 110 s: Fullseye’s RGB PSNR matches the authors’ PSNRc to four decimals (max 0.00005 dB), luminance PSNR matches to 0.00017 dB on the 2,774 pairs outside reference I12 (I12’s 115 pairs have 28 pixels whose luminance lands exactly on .5 and round the other way, 0.00058 dB; reported as a separate gate rather than silently dropped), SSIM on Y′ to 0.000051, rank correlations PSNR 0.6395 / 0.4699 (published 0.640 / 0.470) and SSIM 0.6370 / 0.4635 (0.637 / 0.464), and the 14 authors’ rows reproduced to 0.00048. The authors write exact matches of luminance PSNR as 100000.0 (111 rows, all saturation changes). Honestly: the four-decimal agreement comes from following the same original implementation’s conventions (the old ssim_index.m: 11×11 Gaussian σ 1.5, borders cropped, no downsampling), not from SSIM being good (it ranks 10th of 14). FSIM / FSIMc / VIF / GMSD are not implemented; only their published values are tabulated. Images and MOS are not committed (research-and-education-only terms, FULLSEYE_TID2013_DATA). CI runs the synthetic gates only.

↑ The measurement ―― 971 人の MOS と Fullseye の PSNR(作者の輝度規約 Y′、psnr.txt と 4 桁一致)。順位相関は公表値どおり低い —— PSNR は歪み種が混ざると主観に合わない。 彩度変化で Y′ が変わらない 106 組(PSNR = inf、MOS 3.4〜6.0)は図に載らない(順位相関には最大の順位で入れてある)。 (figure labels are in Japanese; the numbers are the same)

↑ 同じ 3,000 組と Fullseye の SSIM(Wang 2004 の既定、ssim.txt と 4 桁一致)。

↑ 歪み種ごとの順位相関(各 25 参照 × 5 段)。

↑ 作者値との行ごとの差。

↑ 公表表(ページ / readme TABLE III・IV)と、同梱の作者値 + mos.txt から平均順位・τ_b で再現した値、Fullseye 実装がある 3 本の自前値。
py -3.11 examples/poc_iqa_tid2013.py
Source: examples/poc_iqa_tid2013.py
This run produced 6 figures in total - see them all
Ops used (notes): luma_limited_u8 · psnr · rank_data · rank_kendall_b · rank_spearman · ssim · ssim_map · tid2013_by_distortion · tid2013_compare · tid2013_evaluate · tid2013_index · tid2013_metric_values · tid2013_published · tid2013_root
No.2026.197 —— Perceptual Indices FSIM (feature similarity index) / FSIMc (colour extension of FSIM) / GMSD (gradient-similarity deviation) / VIF Matched to Four Digits Against an External Truth — TID2013’s Three Author-Value Files and the Published Rank-Correlation Tables
| The second exhibit of the IQA series (the first covered PSNR / SSIM (structural similarity)). The first exhibit had listed FSIM / FSIMc / VIFP as ‘not implemented, published values only’; here they are implemented in numpy + scipy alone (new module iqafsim, 7 ops: fsim / fsimc / fsim_pair / gmsd / gmsd_map / vifp / phase_congruency_pc) and GMSD, absent from the distribution, is added. Primary sources are four papers: FSIM = Zhang, Zhang, Mou & Zhang, IEEE TIP 2011 (phase congruency after Kovesi 1999; his public code is MIT, so the noise-threshold heuristics come from there), GMSD = Xue, Zhang, Mou & Bovik, IEEE TIP 2014, VIF = Sheikh & Bovik, IEEE TIP 2006 in its pixel-domain form (the ‘VIFP’ row of the TID2013 paper; the steerable ‘VIF’ row is a different implementation and is not reproduced). The FSIM authors’ code is for research and education only, so nothing was ported: the index was written from the paper’s equations and only the constants were checked against §IV-A. The truth comes in three grades. (1) The author-value files FSIMc.txt / FSIM.txt / VIFP.txt (3,000 rows, four decimals), row by row: max | difference | 5.0e-5 / 5.0e-5 / 6.8e-5 — inside the rounding width. (2) The four-digit rank correlations of Tables 4/5 of the TID2013 paper: unrounded values give FSIM 0.8008 / 0.6295 (paper 0.8007 / 0.6300), FSIMc 0.8510 / 0.6665 (0.8510 / 0.6669), VIFP 0.6080 / 0.4560 (0.6084 / 0.4567); rounding our values to four decimals as the authors did reproduces all three on the full set and on the seven subsets (Noise / Actual / Simple / Exotic / New / Color / Full) with Δ 0.0000. (3) GMSD has no author file (the distribution is from 2013, GMSD from 2014); it is checked against a secondary source (Nafchi et al. 2016), | ρ | 0.8044 / 0.6339, to 0.0006 / 0.0005 — stated in the table as a grade lower. The input conventions were found by measurement (no page states them): FSIM.txt and VIFP.txt are computed on the same limited-range integer luma Y′ (16–235) as PSNR / SSIM, while FSIMc.txt is computed on the colour bitmaps via full-range YIQ. So FSIM.txt is not the FSIM component inside the FSIMc computation (measuring FSIM on the colour image’s Y misses FSIM.txt by up to 0.0318 — kept as a counter-example gate). Figures: four MOS scatter plots (SROCC and published value in the title), SROCC per distortion type for 24 types (under 18, colour saturation, the three luma-only indices collapse and only FSIMc survives), and a table with the grade of the truth as a column. 26 gates (10 synthetic, 6 on the default real subset, 10 more with –full): identities FSIM = FSIMc = 1, GMSD = 0, VIF = 1; monotonic in noise σ (rank correlation ∓1); FSIM / GMSD symmetric and VIF asymmetric (it divides by the reference’s information); phase-congruency gain invariance (1e-10 with ε = 1e-12; the 2.8e-5 residual at the default ε = 1e-4 scales exactly with ε); the even-kernel ‘same’ convention; round(1.5) = 2; correlation 0.66 with the existing monogenic phase congruency as a second implementation; GMS range and VIF > 1 under contrast enhancement (the authors’ maximum 1.1379 is also distortion 17); fail-closed; agreement of the four-digit and three-digit published tables; on real data the three row-wise gates, the counter-example, GMSD’s negative correlation and the per-type table. Default is the first 120 pairs (reference I01, 24 types × 5 levels) in 30 s; –full runs all 3,000 pairs in 11 minutes. Honestly: four-digit agreement comes from following the same conventions, not from the indices’ merit (FSIMc 0.851 ranks first, VIFP 0.608 thirteenth); GMSD is checked only against a secondary source; steerable VIF is not implemented; distortions 16–18 are weak for all four. Traps: scipy’s even-kernel ‘same’ is half a pixel off (a 2×2 average gives a different answer), round(1.5) goes away from zero, ε belongs in the unit-vector normalisation only (in the denominator it breaks gain invariance by 3e-5), GMSD’s sign (the published tables list | ρ | ; the first run failed by −1.6), and the paper’s four-digit tables are computed from the authors’ four-decimal text files (rounding ties 106–122 pairs of distortion 18 and moves the New / Color columns in the fourth digit). |

| *↑ Perceptual Indices FSIM (feature similarity index) / FSIMc (colour extension of FSIM) / GMSD (gradient-similarity deviation) / VIF Matched to Four Digits Against an External Truth — TID2013’s Three Author-Value Files and the Published Rank-Correlation Tables ―― The second exhibit of the IQA series (the first covered PSNR / SSIM (structural similarity)). The first exhibit had listed FSIM / FSIMc / VIFP as ‘not implemented, published values only’; here they are implemented in numpy + scipy alone (new module iqafsim, 7 ops: fsim / fsimc / fsim_pair / gmsd / gmsd_map / vifp / phase_congruency_pc) and GMSD, absent from the distribution, is added. Primary sources are four papers: FSIM = Zhang, Zhang, Mou & Zhang, IEEE TIP 2011 (phase congruency after Kovesi 1999; his public code is MIT, so the noise-threshold heuristics come from there), GMSD = Xue, Zhang, Mou & Bovik, IEEE TIP 2014, VIF = Sheikh & Bovik, IEEE TIP 2006 in its pixel-domain form (the ‘VIFP’ row of the TID2013 paper; the steerable ‘VIF’ row is a different implementation and is not reproduced). The FSIM authors’ code is for research and education only, so nothing was ported: the index was written from the paper’s equations and only the constants were checked against §IV-A. The truth comes in three grades. (1) The author-value files FSIMc.txt / FSIM.txt / VIFP.txt (3,000 rows, four decimals), row by row: max | difference | 5.0e-5 / 5.0e-5 / 6.8e-5 — inside the rounding width. (2) The four-digit rank correlations of Tables 4/5 of the TID2013 paper: unrounded values give FSIM 0.8008 / 0.6295 (paper 0.8007 / 0.6300), FSIMc 0.8510 / 0.6665 (0.8510 / 0.6669), VIFP 0.6080 / 0.4560 (0.6084 / 0.4567); rounding our values to four decimals as the authors did reproduces all three on the full set and on the seven subsets (Noise / Actual / Simple / Exotic / New / Color / Full) with Δ 0.0000. (3) GMSD has no author file (the distribution is from 2013, GMSD from 2014); it is checked against a secondary source (Nafchi et al. 2016), | ρ | 0.8044 / 0.6339, to 0.0006 / 0.0005 — stated in the table as a grade lower. The input conventions were found by measurement (no page states them): FSIM.txt and VIFP.txt are computed on the same limited-range integer luma Y′ (16–235) as PSNR / SSIM, while FSIMc.txt is computed on the colour bitmaps via full-range YIQ. So FSIM.txt is not the FSIM component inside the FSIMc computation (measuring FSIM on the colour image’s Y misses FSIM.txt by up to 0.0318 — kept as a counter-example gate). Figures: four MOS scatter plots (SROCC and published value in the title), SROCC per distortion type for 24 types (under 18, colour saturation, the three luma-only indices collapse and only FSIMc survives), and a table with the grade of the truth as a column. 26 gates (10 synthetic, 6 on the default real subset, 10 more with –full): identities FSIM = FSIMc = 1, GMSD = 0, VIF = 1; monotonic in noise σ (rank correlation ∓1); FSIM / GMSD symmetric and VIF asymmetric (it divides by the reference’s information); phase-congruency gain invariance (1e-10 with ε = 1e-12; the 2.8e-5 residual at the default ε = 1e-4 scales exactly with ε); the even-kernel ‘same’ convention; round(1.5) = 2; correlation 0.66 with the existing monogenic phase congruency as a second implementation; GMS range and VIF > 1 under contrast enhancement (the authors’ maximum 1.1379 is also distortion 17); fail-closed; agreement of the four-digit and three-digit published tables; on real data the three row-wise gates, the counter-example, GMSD’s negative correlation and the per-type table. Default is the first 120 pairs (reference I01, 24 types × 5 levels) in 30 s; –full runs all 3,000 pairs in 11 minutes. Honestly: four-digit agreement comes from following the same conventions, not from the indices’ merit (FSIMc 0.851 ranks first, VIFP 0.608 thirteenth); GMSD is checked only against a secondary source; steerable VIF is not implemented; distortions 16–18 are weak for all four. Traps: scipy’s even-kernel ‘same’ is half a pixel off (a 2×2 average gives a different answer), round(1.5) goes away from zero, ε belongs in the unit-vector normalisation only (in the denominator it breaks gain invariance by 3e-5), GMSD’s sign (the published tables list | ρ | ; the first run failed by −1.6), and the paper’s four-digit tables are computed from the authors’ four-decimal text files (rounding ties 106–122 pairs of distortion 18 and moves the New / Color columns in the fourth digit).* |
Terms: FSIM — An image-similarity index using phase congruency as the primary feature and gradient magnitude as a secondary feature.; FSIMc — The colour extension of FSIM, adding chromatic-difference terms to the feature-similarity score.; GMSD — An image-quality metric defined as the standard deviation of a gradient-magnitude similarity map between reference and test images.; SSIM — An image-quality index comparing local luminance, contrast, and structure between two images.; VIFP — A pixel-domain image-quality metric measuring the fraction of reference information preserved through a natural-image and visual-system model.

↑ The measurement ―― FSIMC と 971 人の MOS(3,000 組)。作者値 FSIMc.txt と 4 桁一致(色画像 → YIQ full range)。TID2013 全体で 1 位の指標。 (figure labels are in Japanese; the numbers are the same)

↑ VIFP と 971 人の MOS(3,000 組)。

↑ GMSD と 971 人の MOS(3,000 組)。

↑ 歪み種ごとの順位相関。

↑ 真値の等級を列にした: FSIM / FSIMc / VIFP は作者値ファイル(4 桁)と行ごとに比べられる。
py -3.11 examples/poc_iqa_fsim_gmsd_vif.py
Source: examples/poc_iqa_fsim_gmsd_vif.py
This run produced 6 figures in total - see them all
Ops used (notes): fsim · fsim_pair · fsimc · gmsd · gmsd_map · phase_congruency_pc · rank_kendall_b · rank_spearman · tf_phase_congruency · tid2013_by_distortion · tid2013_compare · tid2013_evaluate · tid2013_index · tid2013_metric_values · tid2013_published · tid2013_root · vifp
No.2026.135 —— Holding a Course with a Fly’s Optic Lobe Alone — From the Lamina to the Steering, Without Learning
A vehicle whose heading drifts under a disturbance, carrying nothing but a compound eye and closed-form circuitry, holds its course: the fly’s optomotor response built out of fullseye operators alone and measured next to a ground-truth gyro. Every stage is a closed form and nothing is trained: hexagonal sampling (fly_hex_resample), lamina adaptation and band-pass (fly_lamina_filter), the ON/OFF split (fly_onoff_split), direction selectivity in all six lattice directions (fly_t4t5_field), the local flow (fly_flow_from_directions), a linear fit against the matched filter (fly_matched_filter / fly_egomotion_from_flow), and a six-neuron, eight-synapse steering circuit run as conductances (graph_conductance_states). Each stage has an exact identity: brightening the whole scene ten thousand times leaves the lamina output unchanged (Weber, 7e-16), the three-arm T4 model with Haag et al. 2016’s verbatim constants (tau = 250 ms, k = 5/5/10) returns the paper’s 24.9636 and 0.8195 on its two-column stimulus, and the paper’s claim that the two mechanisms are complementary becomes a product identity (4.161 x 7.321 = 30.461 = the whole model) that holds to machine precision; the matched filter’s 1.7 rad/s comes back to nine digits. The limits are measured too: on the classical striped drum the estimate tracks a time-varying rotation at 0.976 correlation, in a natural 1/f scene at 0.897, and the single calibration gain it needs is 2.64 on the drum against 6.76 and 7.88 in natural scenes - 3.0x between kinds of scene and 1.16x between two scenes of identical statistics, because a correlation detector reports contrast-weighted motion rather than velocity. A single 80-degree eye measuring the same +0.5 rad/s across twelve scenes scatters by 1.05 of its mean and gets the sign of the rotation wrong in four of them; merging three eyes into 250 degrees with fly_eye_merge drops the scatter to 0.44 and the sign errors to zero - the width of a compound eye is not decoration. In closed loop (calibrated in scene A, flown in an unseen scene B) the open loop drifts 51 degrees, the visual reflex 33, and the ground-truth gyro 23: a reflex has no absolute heading and cannot null the drift, which is where the central complex would come in. Writing the steering on the connectome side gives the same 33 degrees, and the membrane potential is a convex combination of the reversal potentials so it cannot diverge. No data ships; the scenes are generated from seeds by fly_sky_1f.
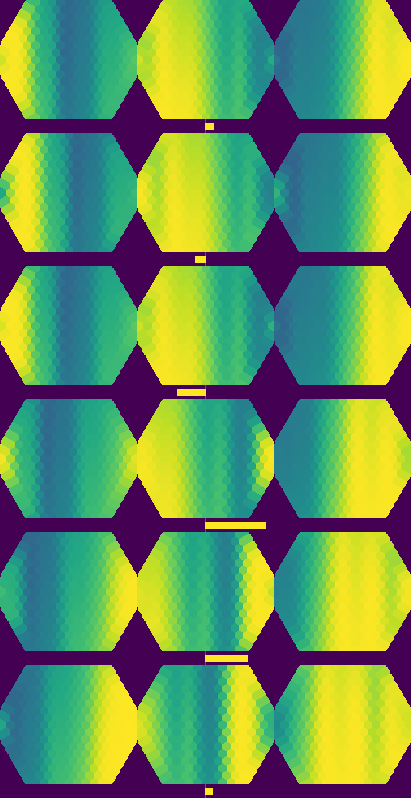
↑ Holding a Course with a Fly’s Optic Lobe Alone — From the Lamina to the Steering, Without Learning ―― A vehicle whose heading drifts under a disturbance, carrying nothing but a compound eye and closed-form circuitry, holds its course: the fly’s optomotor response built out of fullseye operators alone and measured next to a ground-truth gyro. Every stage is a closed form and nothing is trained: hexagonal sampling (fly_hex_resample), lamina adaptation and band-pass (fly_lamina_filter), the ON/OFF split (fly_onoff_split), direction selectivity in all six lattice directions (fly_t4t5_field), the local flow (fly_flow_from_directions), a linear fit against the matched filter (fly_matched_filter / fly_egomotion_from_flow), and a six-neuron, eight-synapse steering circuit run as conductances (graph_conductance_states). Each stage has an exact identity: brightening the whole scene ten thousand times leaves the lamina output unchanged (Weber, 7e-16), the three-arm T4 model with Haag et al. 2016’s verbatim constants (tau = 250 ms, k = 5/5/10) returns the paper’s 24.9636 and 0.8195 on its two-column stimulus, and the paper’s claim that the two mechanisms are complementary becomes a product identity (4.161 x 7.321 = 30.461 = the whole model) that holds to machine precision; the matched filter’s 1.7 rad/s comes back to nine digits. The limits are measured too: on the classical striped drum the estimate tracks a time-varying rotation at 0.976 correlation, in a natural 1/f scene at 0.897, and the single calibration gain it needs is 2.64 on the drum against 6.76 and 7.88 in natural scenes - 3.0x between kinds of scene and 1.16x between two scenes of identical statistics, because a correlation detector reports contrast-weighted motion rather than velocity. A single 80-degree eye measuring the same +0.5 rad/s across twelve scenes scatters by 1.05 of its mean and gets the sign of the rotation wrong in four of them; merging three eyes into 250 degrees with fly_eye_merge drops the scatter to 0.44 and the sign errors to zero - the width of a compound eye is not decoration. In closed loop (calibrated in scene A, flown in an unseen scene B) the open loop drifts 51 degrees, the visual reflex 33, and the ground-truth gyro 23: a reflex has no absolute heading and cannot null the drift, which is where the central complex would come in. Writing the steering on the connectome side gives the same 33 degrees, and the membrane potential is a convex combination of the reversal potentials so it cannot diverge. No data ships; the scenes are generated from seeds by fly_sky_1f.
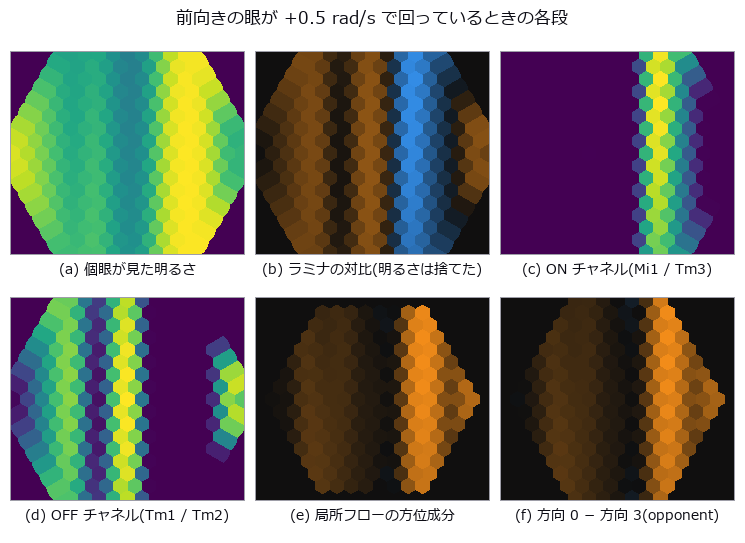
↑ The measurement ―― left to right, top to bottom: what the ommatidia see, the lamina’s contrast (brightness thrown away), the ON and OFF channels, and the direction-selective field read as a local flow. The eye is turning at 0.5 rad/s in a 1/f panorama; nothing here was trained. (figure labels are in Japanese; the numbers are the same)
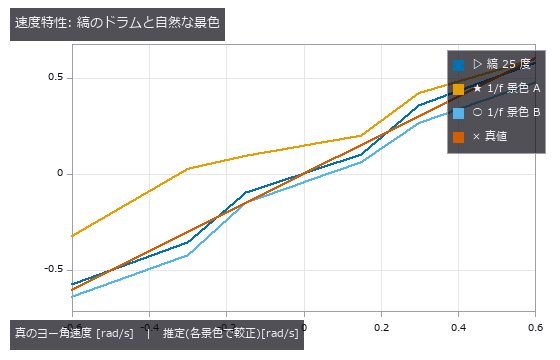
↑ each scene is fitted with its own single gain; the striped drum is nearly linear, and a natural 1/f scene needs a gain 3.0x larger — a correlation det…
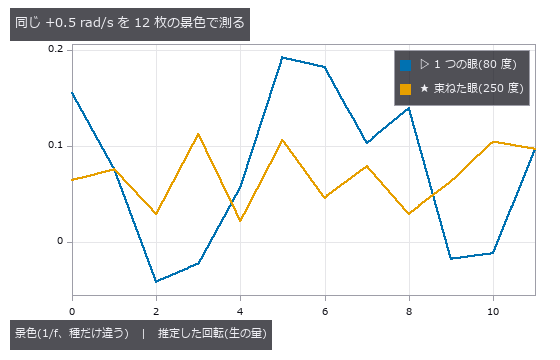
↑ a narrow eye is at the mercy of whichever few large features are in front of it: over eight scenes of identical statistics it scatters and gets the si…
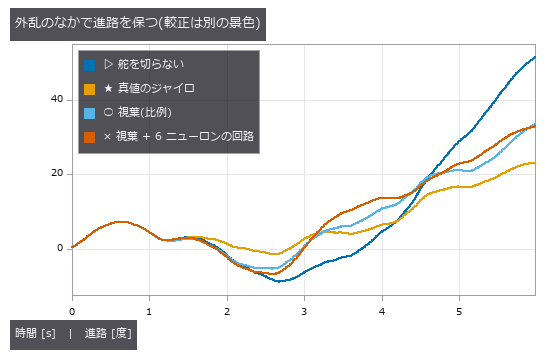
↑ the disturbance has a steady bias, so the open loop drifts away; the optomotor reflex cuts the drift but cannot null it — a reflex has no absolute hea…
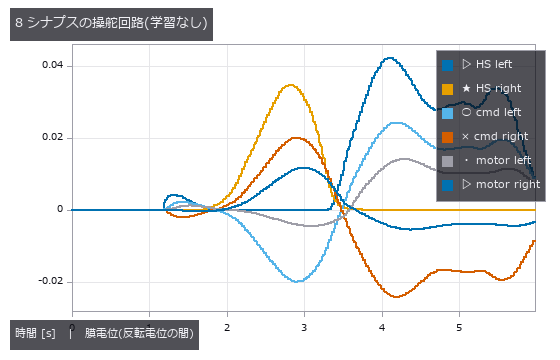
↑ the wiring is written by hand as a synapse table and run as a conductance circuit; the state is a convex combination of the reversal potentials, so it…
py -3.11 examples/poc_fly_optomotor_steering.py
Source: examples/poc_fly_optomotor_steering.py
This run produced 7 figures in total - see them all
Ops used (notes): fly_egomotion_from_flow · fly_eye_merge · fly_flow_from_directions · fly_hex_lattice · fly_hex_resample · fly_lamina_filter · fly_matched_filter · fly_onoff_split · fly_sky_1f · fly_t4t5_field · graph_conductance_states · graph_from_synapses
No.2026.148 —— The Exact Distance at Which Detail Vanishes, and the Area of a Changing Shape
Both a picture that mixes high and low frequencies and a shape that morphs smoothly carry exact truths that can be measured straight off the image - and the customary way of making them is the one that misses those truths. The first concerns orthogonality. Splitting an image into low and high parts with an ideal frequency mask makes the two exactly orthogonal, so the energies add: across four cut-off frequencies the relative discrepancy in E(low) + E(high) - E(original) is 1.9e-16. The textbook construction - blur with a Gaussian, call the remainder the high part - misses by 0.53 % to 3.10 %, even though both reconstruct the original exactly when added back: being invertible and being orthogonal are different properties. The discrepancy is also not monotone in the blur: the worst case is the weakest blur and the best is in the middle of the range, so neither strengthening nor weakening it fixes the problem. The second concerns distance. Binning k pixels - what moving away does - has the transfer function sin(pi f k)/(k sin(pi f)), which is exactly zero when f times k is an integer, so a pattern of period p pixels vanishes exactly when binned at p pixels (1.4e-14 over five periods). More strongly, the binned picture can be written pixel by pixel in closed form - the amplitude and the fact that the binned pixel’s centre shifts by (k-1)/2 - agreeing to 2.8e-14 over every pixel for bin widths 1 through 48. The third concerns shape. Interpolating polygon vertices linearly makes the enclosed area an exact quadratic in t, so three frames predict all of them (2.4e-15 across three shapes), and this survives measurement from the picture: rasterising the polygon and counting brings the deviation from 1.10 % on a 128 grid down to 0.053 % on a 512 grid with each pixel split four ways - and splitting a pixel into 4x4 gives exactly the same number as using a four times finer grid. The fourth is where measurement from a picture breaks. Morphing to the same polygon with its vertices reversed makes the signed area linear in t, vanishing at t = 0.5 where the polygon collapses to a line, and the quadratic prediction holds to 3.4e-15; but a picture only yields positive area, so the parabola folds and the three-frame prediction is off by exactly one quarter of the maximum - measured at 25.0 % for two different shapes. Even the size of the error has a closed form. The fifth pairs two exact spline properties: Catmull-Rom passes through its control points at distance 0.0e+00, while a Bezier curve does not pass through them but never leaves their convex hull (401 of 401 points across four sets) - exactly complementary guarantees. Three predictions were wrong and have been left in: that the bin width at which a hybrid image switches could be predicted from the cut-off frequency as 1/(2 fc), when in fact tripling the cut-off barely moves the measured switch because what governs it is the period the high-frequency picture actually contains; that the Gaussian discrepancy would grow with the blur; and that reading amplitude off the picture’s maximum and minimum would match the closed form, when at a bin width of six it reads 20.7 % low because the pixels never land on the crest - the formula is right even where no pixel sits. No new operator was added.

↑ The Exact Distance at Which Detail Vanishes, and the Area of a Changing Shape ―― Both a picture that mixes high and low frequencies and a shape that morphs smoothly carry exact truths that can be measured straight off the image - and the customary way of making them is the one that misses those truths. The first concerns orthogonality. Splitting an image into low and high parts with an ideal frequency mask makes the two exactly orthogonal, so the energies add: across four cut-off frequencies the relative discrepancy in E(low) + E(high) - E(original) is 1.9e-16. The textbook construction - blur with a Gaussian, call the remainder the high part - misses by 0.53 % to 3.10 %, even though both reconstruct the original exactly when added back: being invertible and being orthogonal are different properties. The discrepancy is also not monotone in the blur: the worst case is the weakest blur and the best is in the middle of the range, so neither strengthening nor weakening it fixes the problem. The second concerns distance. Binning k pixels - what moving away does - has the transfer function sin(pi f k)/(k sin(pi f)), which is exactly zero when f times k is an integer, so a pattern of period p pixels vanishes exactly when binned at p pixels (1.4e-14 over five periods). More strongly, the binned picture can be written pixel by pixel in closed form - the amplitude and the fact that the binned pixel’s centre shifts by (k-1)/2 - agreeing to 2.8e-14 over every pixel for bin widths 1 through 48. The third concerns shape. Interpolating polygon vertices linearly makes the enclosed area an exact quadratic in t, so three frames predict all of them (2.4e-15 across three shapes), and this survives measurement from the picture: rasterising the polygon and counting brings the deviation from 1.10 % on a 128 grid down to 0.053 % on a 512 grid with each pixel split four ways - and splitting a pixel into 4x4 gives exactly the same number as using a four times finer grid. The fourth is where measurement from a picture breaks. Morphing to the same polygon with its vertices reversed makes the signed area linear in t, vanishing at t = 0.5 where the polygon collapses to a line, and the quadratic prediction holds to 3.4e-15; but a picture only yields positive area, so the parabola folds and the three-frame prediction is off by exactly one quarter of the maximum - measured at 25.0 % for two different shapes. Even the size of the error has a closed form. The fifth pairs two exact spline properties: Catmull-Rom passes through its control points at distance 0.0e+00, while a Bezier curve does not pass through them but never leaves their convex hull (401 of 401 points across four sets) - exactly complementary guarantees. Three predictions were wrong and have been left in: that the bin width at which a hybrid image switches could be predicted from the cut-off frequency as 1/(2 fc), when in fact tripling the cut-off barely moves the measured switch because what governs it is the period the high-frequency picture actually contains; that the Gaussian discrepancy would grow with the blur; and that reading amplitude off the picture’s maximum and minimum would match the closed form, when at a bin width of six it reads 20.7 % low because the pixels never land on the crest - the formula is right even where no pixel sits. No new operator was added.

↑ The measurement ―― 低い周波数に粗い模様、高い周波数に細かい模様を入れた 1 枚を、束ねながら見たもの。束ねるのは「遠ざかる」ことで、細かいほうが先に消える。ただし ★いつ消えるかは遮断周波数では決まらない —— 下の数表の「外した予言」を参照。 (figure labels are in Japanese; the numbers are the same)

↑ どちらも足せば元に戻る(再構成の誤差は両方 1e-13 未満)。

↑ k = 24 と k = 48(f·k が整数)で 厳密に 0、その間では戻る。

↑ 閉形式なら 2.4e-15。

↑ 薄い折れ線が制御点をつないだもの、濃い線が Catmull-Rom。

↑ The animation ―― 6 角形が別の 6 角形へ変わって戻るところ。★見た目は連続に変わるが、囲む面積は t の 厳密な 2 次式に乗っている(次の図)。
py -3.11 examples/poc_vanishing_detail_and_morphing_area.py
Source: examples/poc_vanishing_detail_and_morphing_area.py
This run produced 14 figures in total - see them all
Ops used (notes): convex_hull · gauss_filter · morph
No.2026.184 —— The Segmentation Gauntlet — Ten Methods Across Six Worlds With Ground Truth, and Which Measure Is Blind to Which Failure
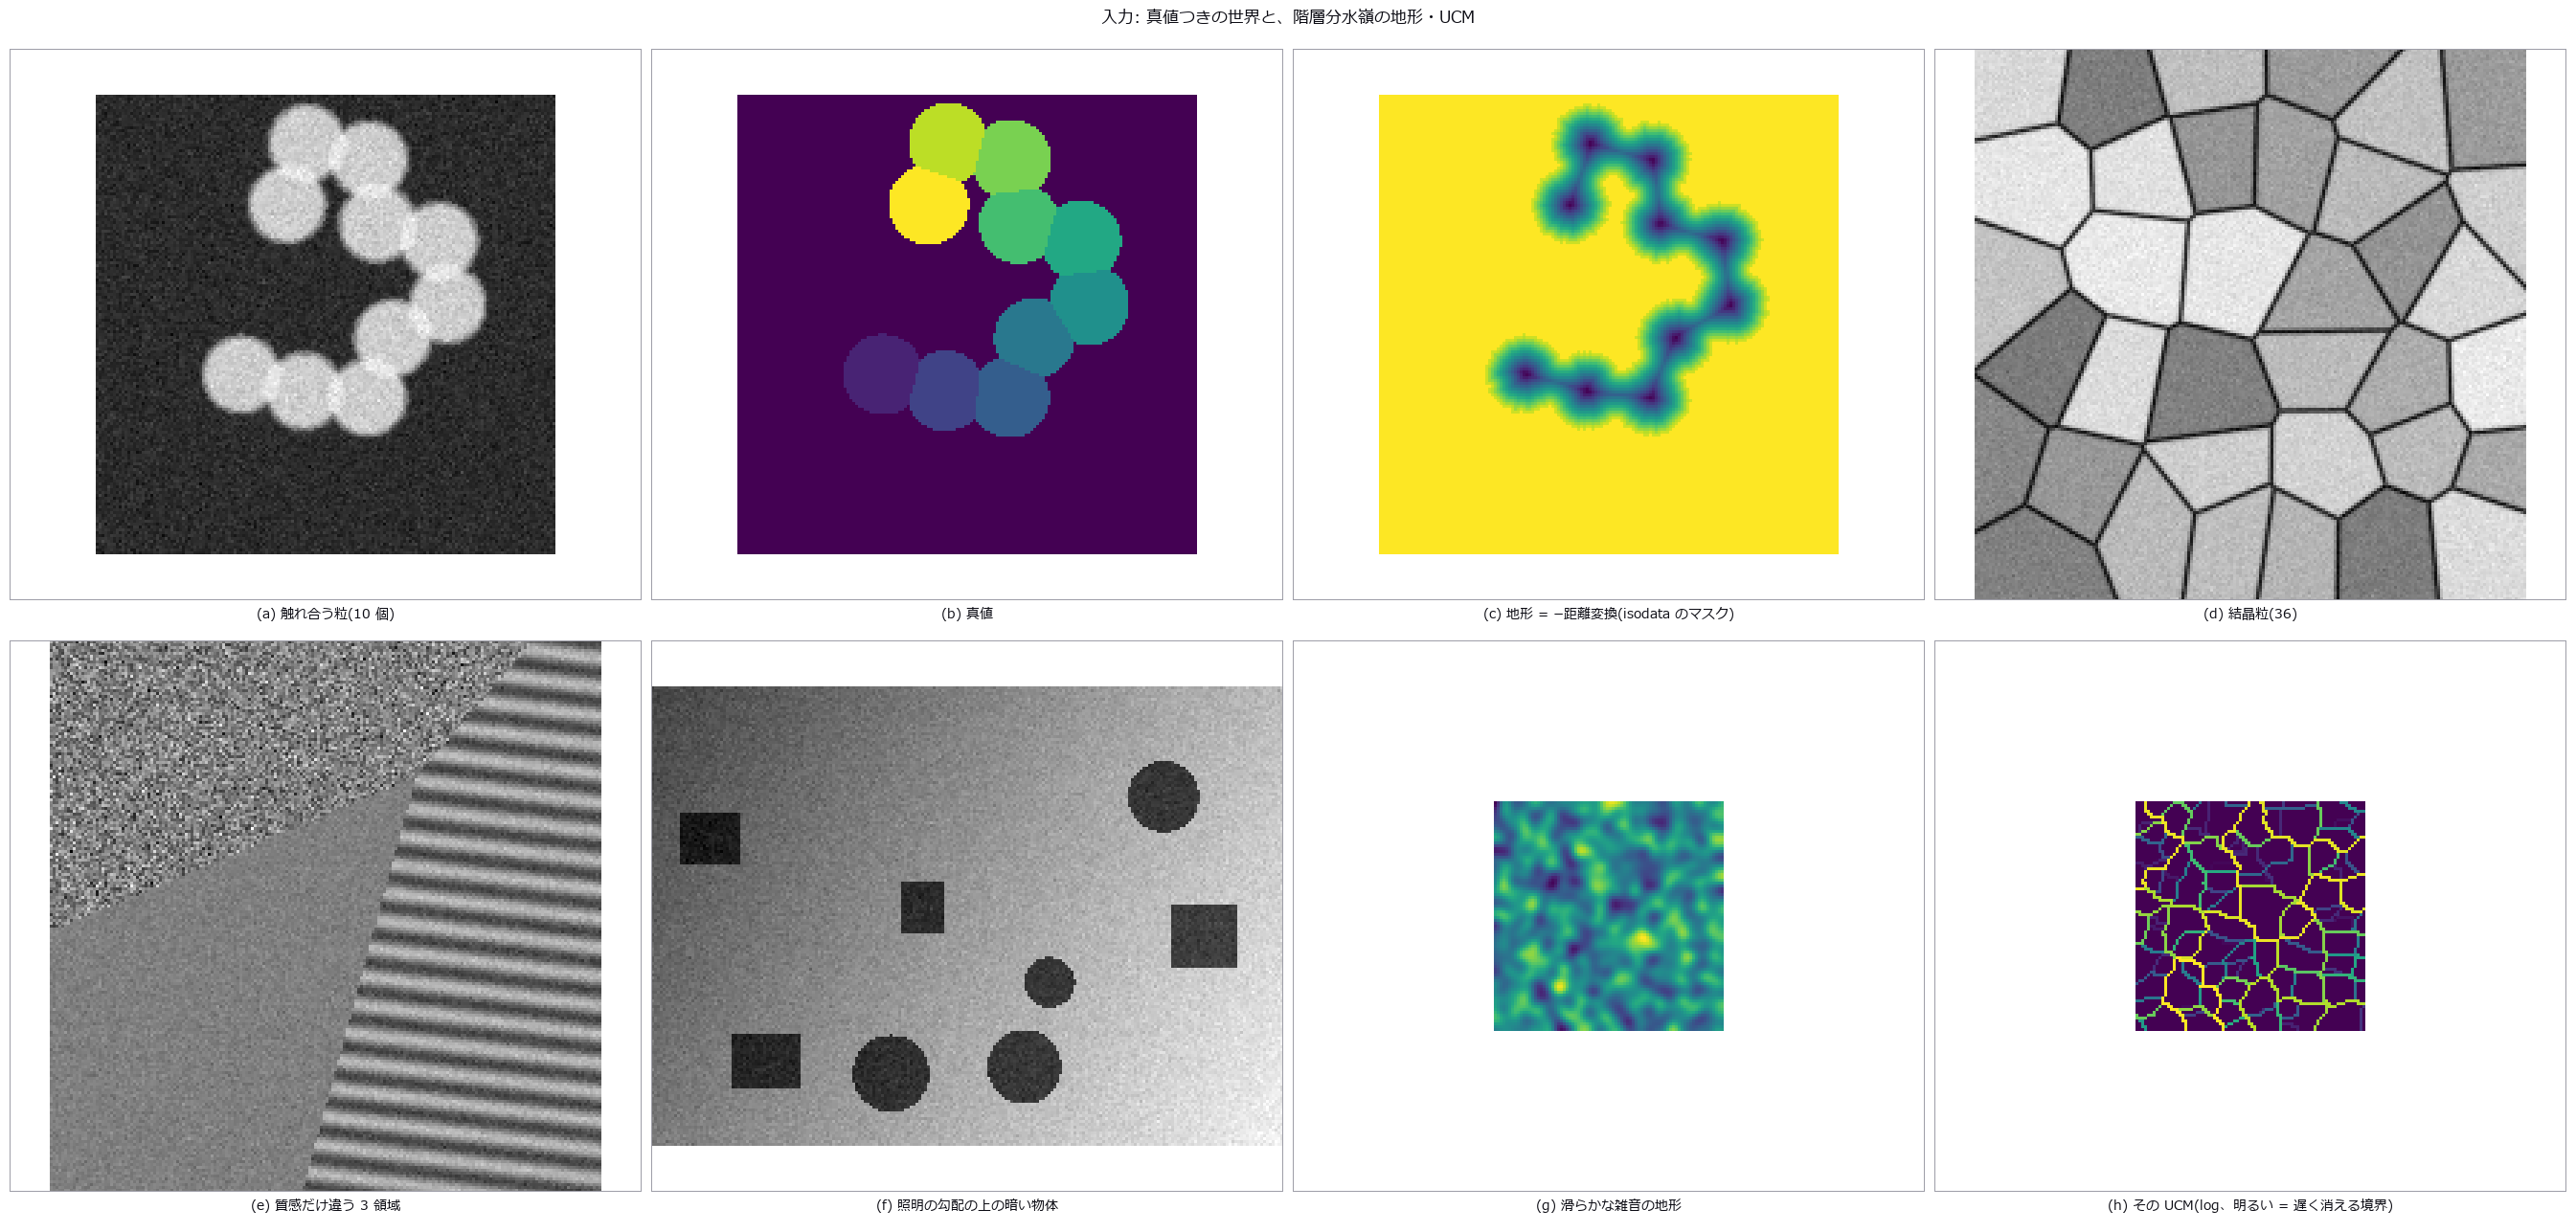
Before adding segmentation methods, the measures and the ground truth come first — new modules segeval (contingency table, Dice (region-overlap coefficient)/Jaccard (set-overlap coefficient), boundary F, Hausdorff (maximum nearest-set distance)/ASSD, over/under-segmentation, object-count matching, a score card; each op gated by an identity or a second implementation) and segworld (six synthetic worlds with ground truth: touching equal-radius blobs with the closed-form lens area, Voronoi grains whose boundary length matches scipy’s ridges to 1e-9, parts with shadows, same-mean regions differing only in texture, an illumination gradient, and 1–3 px thin structures). Ten existing methods (Otsu, local threshold, Niblack, Sauvola, Chan–Vese, random walker, two watersheds, Felzenszwalb, SLIC) run with default knobs across every world. Gates: truth vs truth scores perfectly on every measure in all six worlds / mask measures are blind to merging (Otsu scores J=0.95 while 9 of 10 blobs are merged) / boundary measures are blind to over-segmentation (gradient watershed BF=1.00 with 339 over-segmented) / Sauvola gets every grain count right but drops the boundary band, J=0.91 / on parts with shadows every method scores J < 0.3, and even a threshold oracle that sees the truth only J=0.29 / textures: mask methods ARI < 0.3, local-σ k-means ARI=0.92 / illumination gradient: global Otsu J=0.21, flat-fielded J=1.00 / thin structures: Otsu’s boundary F is 1.00 yet noise grains over-segment 29. Honestly: method knobs are fixed at defaults (some would recover if tuned), boundary F is the distance-transform BF rather than Martin 2004’s bipartite matching, and the edge condition in count matching is our own definition. 10 gates, 2.0 s.
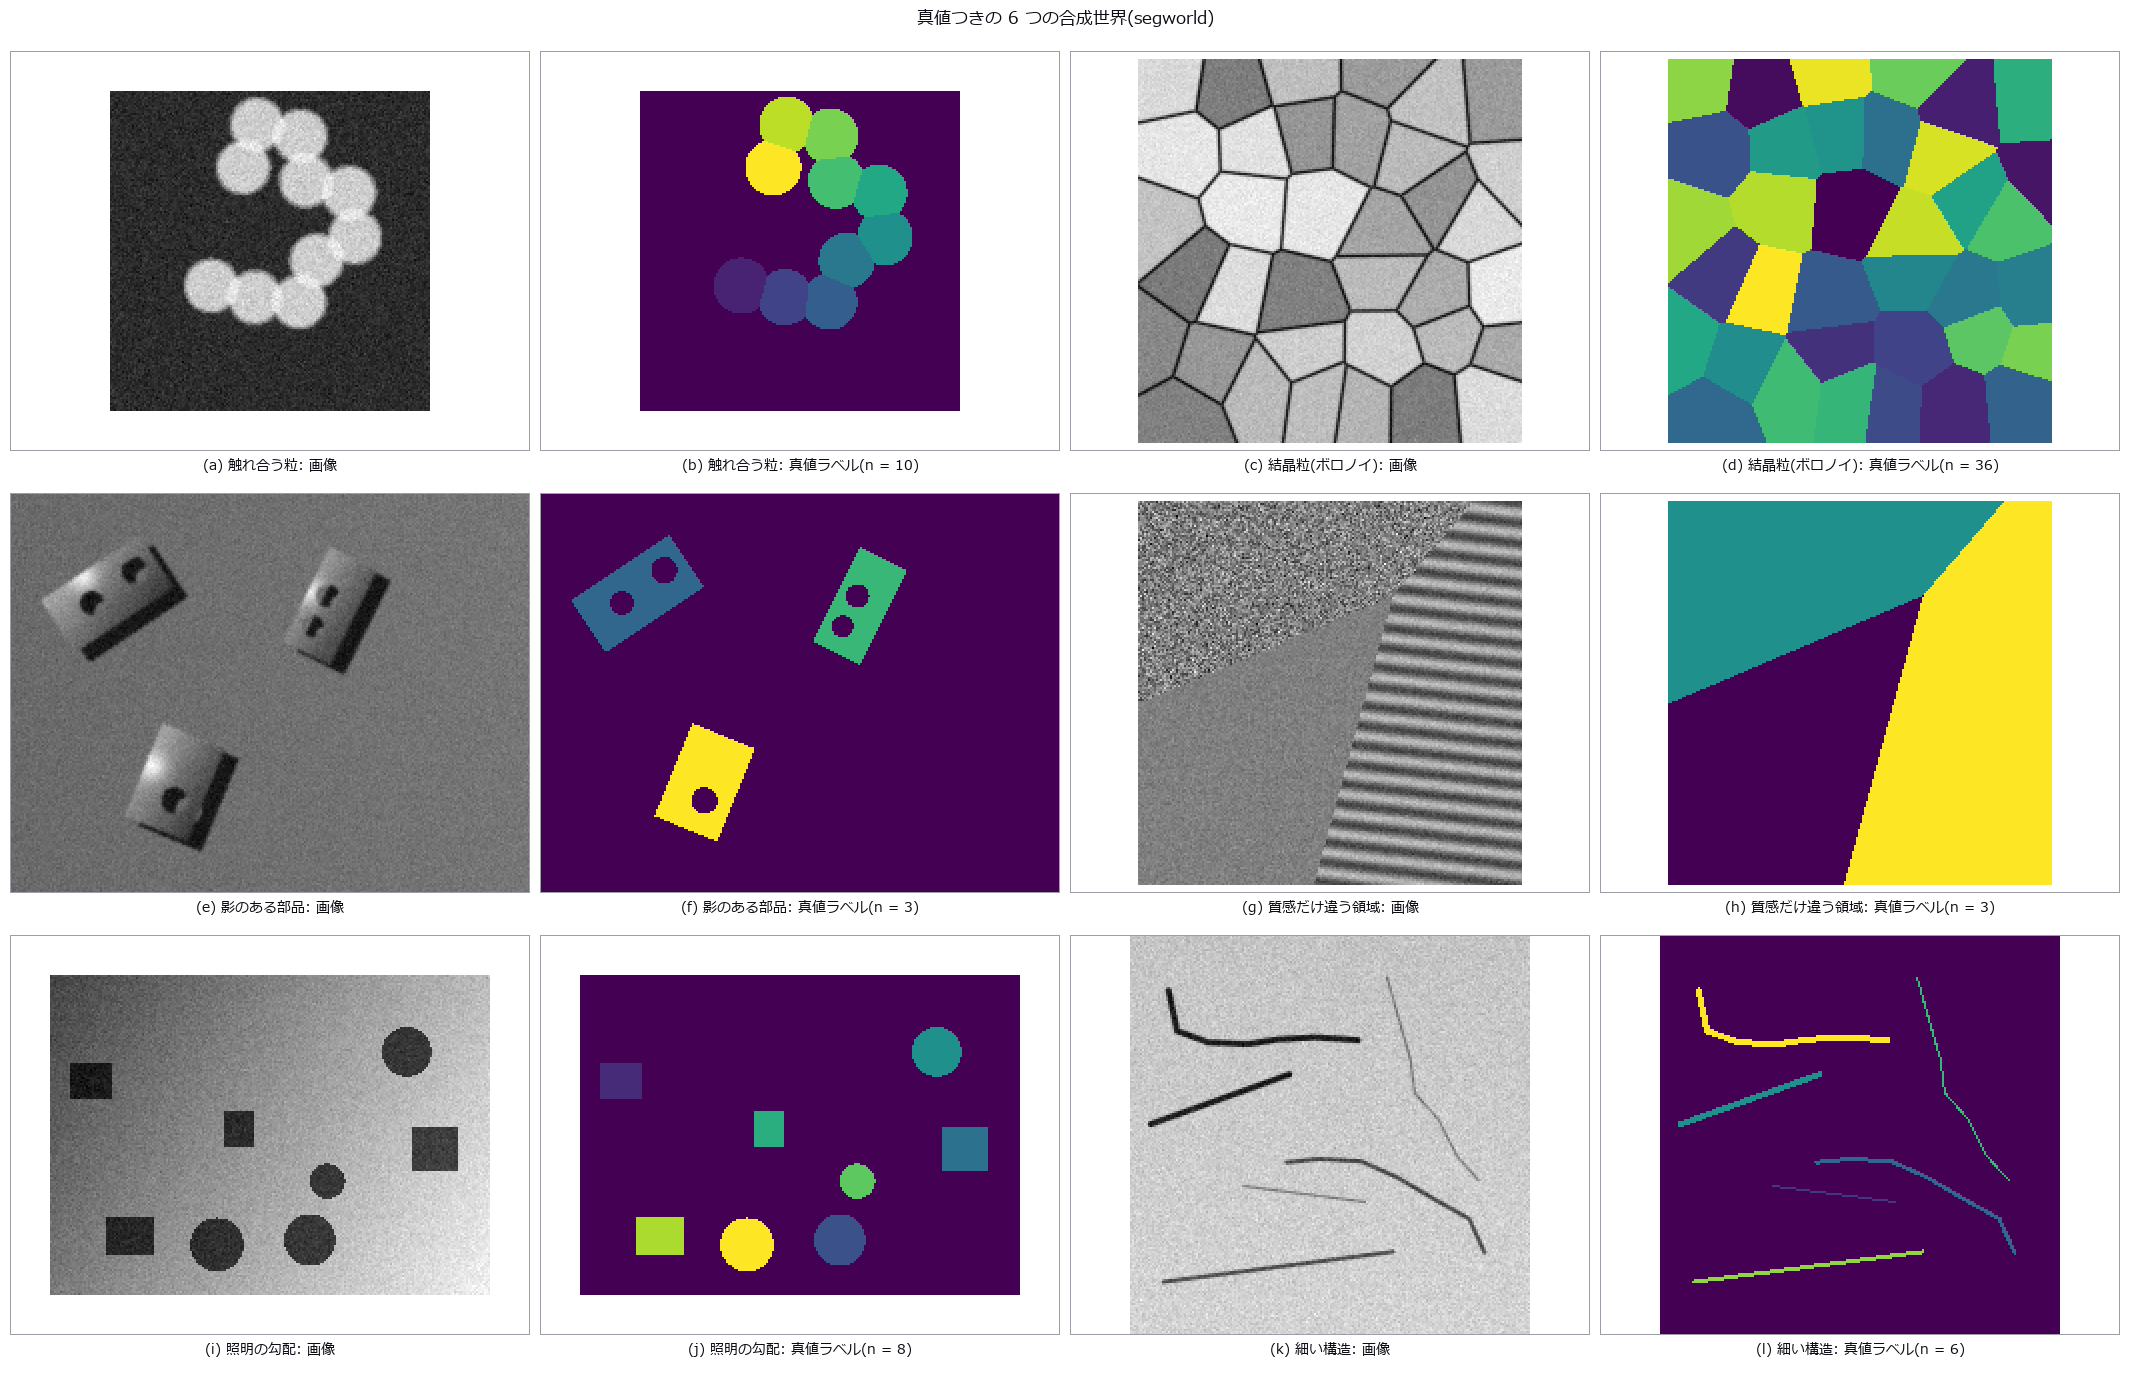
↑ The Segmentation Gauntlet — Ten Methods Across Six Worlds With Ground Truth, and Which Measure Is Blind to Which Failure ―― Before adding segmentation methods, the measures and the ground truth come first — new modules segeval (contingency table, Dice (region-overlap coefficient)/Jaccard (set-overlap coefficient), boundary F, Hausdorff (maximum nearest-set distance)/ASSD, over/under-segmentation, object-count matching, a score card; each op gated by an identity or a second implementation) and segworld (six synthetic worlds with ground truth: touching equal-radius blobs with the closed-form lens area, Voronoi grains whose boundary length matches scipy’s ridges to 1e-9, parts with shadows, same-mean regions differing only in texture, an illumination gradient, and 1–3 px thin structures). Ten existing methods (Otsu, local threshold, Niblack, Sauvola, Chan–Vese, random walker, two watersheds, Felzenszwalb, SLIC) run with default knobs across every world. Gates: truth vs truth scores perfectly on every measure in all six worlds / mask measures are blind to merging (Otsu scores J=0.95 while 9 of 10 blobs are merged) / boundary measures are blind to over-segmentation (gradient watershed BF=1.00 with 339 over-segmented) / Sauvola gets every grain count right but drops the boundary band, J=0.91 / on parts with shadows every method scores J < 0.3, and even a threshold oracle that sees the truth only J=0.29 / textures: mask methods ARI < 0.3, local-σ k-means ARI=0.92 / illumination gradient: global Otsu J=0.21, flat-fielded J=1.00 / thin structures: Otsu’s boundary F is 1.00 yet noise grains over-segment 29. Honestly: method knobs are fixed at defaults (some would recover if tuned), boundary F is the distance-transform BF rather than Martin 2004’s bipartite matching, and the edge condition in count matching is our own definition. 10 gates, 2.0 s.
Terms: Dice — A 0-to-1 overlap score equal to twice the intersection size divided by the sum of the two region sizes.; Jaccard — A 0-to-1 set-similarity score equal to intersection size divided by union size.; Hausdorff — A distance between two point sets given by the larger of their two directed maximum nearest-neighbour distances.; Otsu — A histogram thresholding method that chooses the threshold maximizing the variance between the two resulting classes.; Niblack — A local thresholding method that sets each pixel’s threshold from the mean and standard deviation in its neighbourhood.; Sauvola — A document-oriented refinement of Niblack thresholding that uses the local mean and a normalized local standard deviation.

↑ The measurement ―― Jaccard は物体マスク(格子を返す手法は —)。VI = Meilă の情報の変分(0 が一致)、ARI = 補正 Rand、境界 F は τ = 2 px、HD95 = 境界の Hausdorff の 95 % 点。過分割/未分割は分割表の多数決の多重度、一致/分裂/融合/欠落/偽は主に重なる辺の次数。最後の行はルールの直し方。 (figure labels are in Japanese; the numbers are the same)

↑ Jaccard は物体マスク(格子を返す手法は —)。

↑ Jaccard は物体マスク(格子を返す手法は —)。

↑ Jaccard は物体マスク(格子を返す手法は —)。

↑ Jaccard は物体マスク(格子を返す手法は —)。
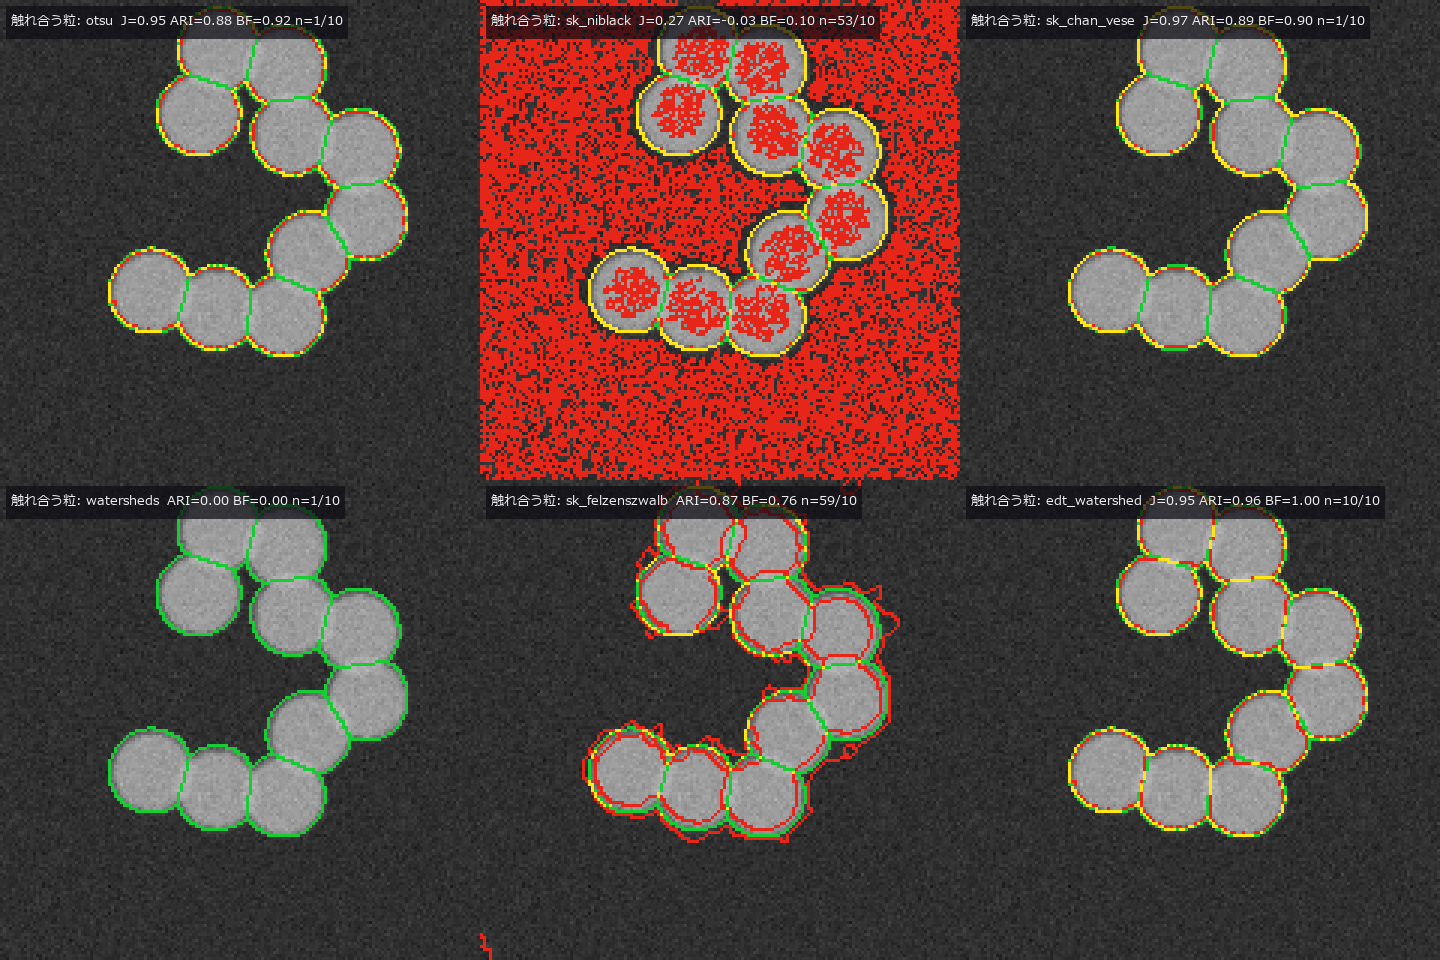
↑ The animation ―― 触れ合う粒: 緑 = 真値の境界、赤 = 手法の境界、黄 = 一致。1 コマ = 1 手法(otsu, local_threshold, sk_niblack, sk_sauvola, sk_chan_vese, xsk_random_walker, watersheds, sg_watershed_gradient, sk_felzenszwalb, sk_slic, edt_watershed)。
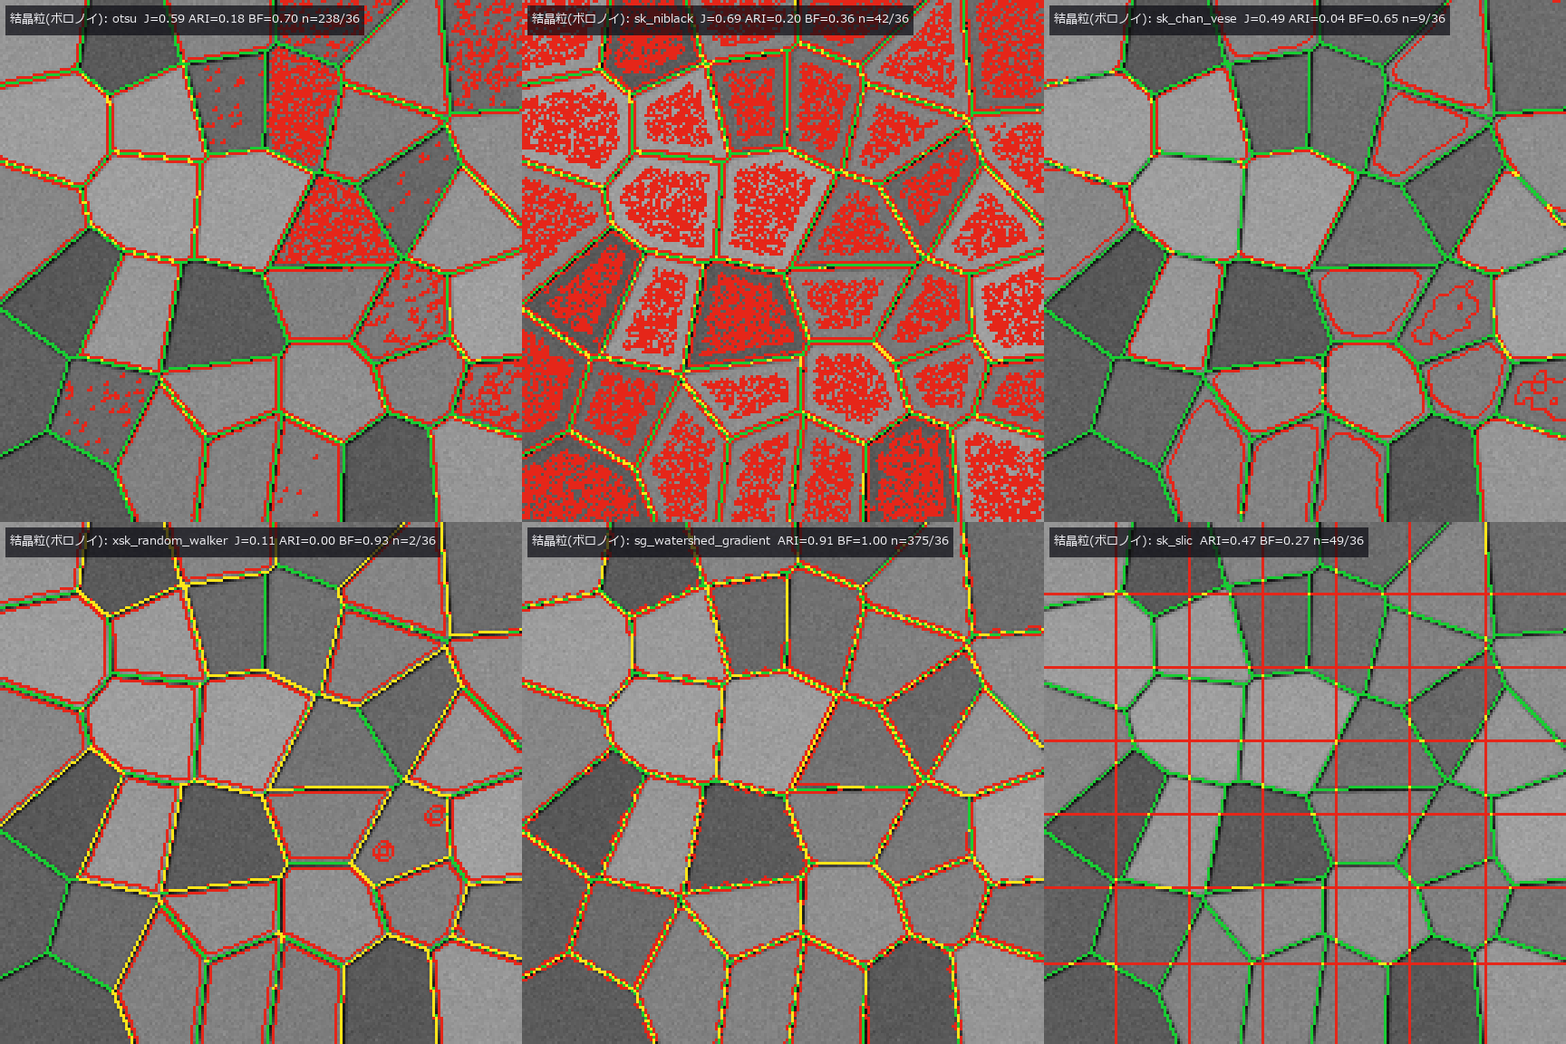
↑ The animation ―― 結晶粒(ボロノイ): 緑 = 真値の境界、赤 = 手法の境界、黄 = 一致。1 コマ = 1 手法(otsu, local_threshold, sk_niblack, sk_sauvola, sk_chan_vese, xsk_random_walker, watersheds, sg_watershed_gradient, sk_felzenszwalb, sk_slic)。
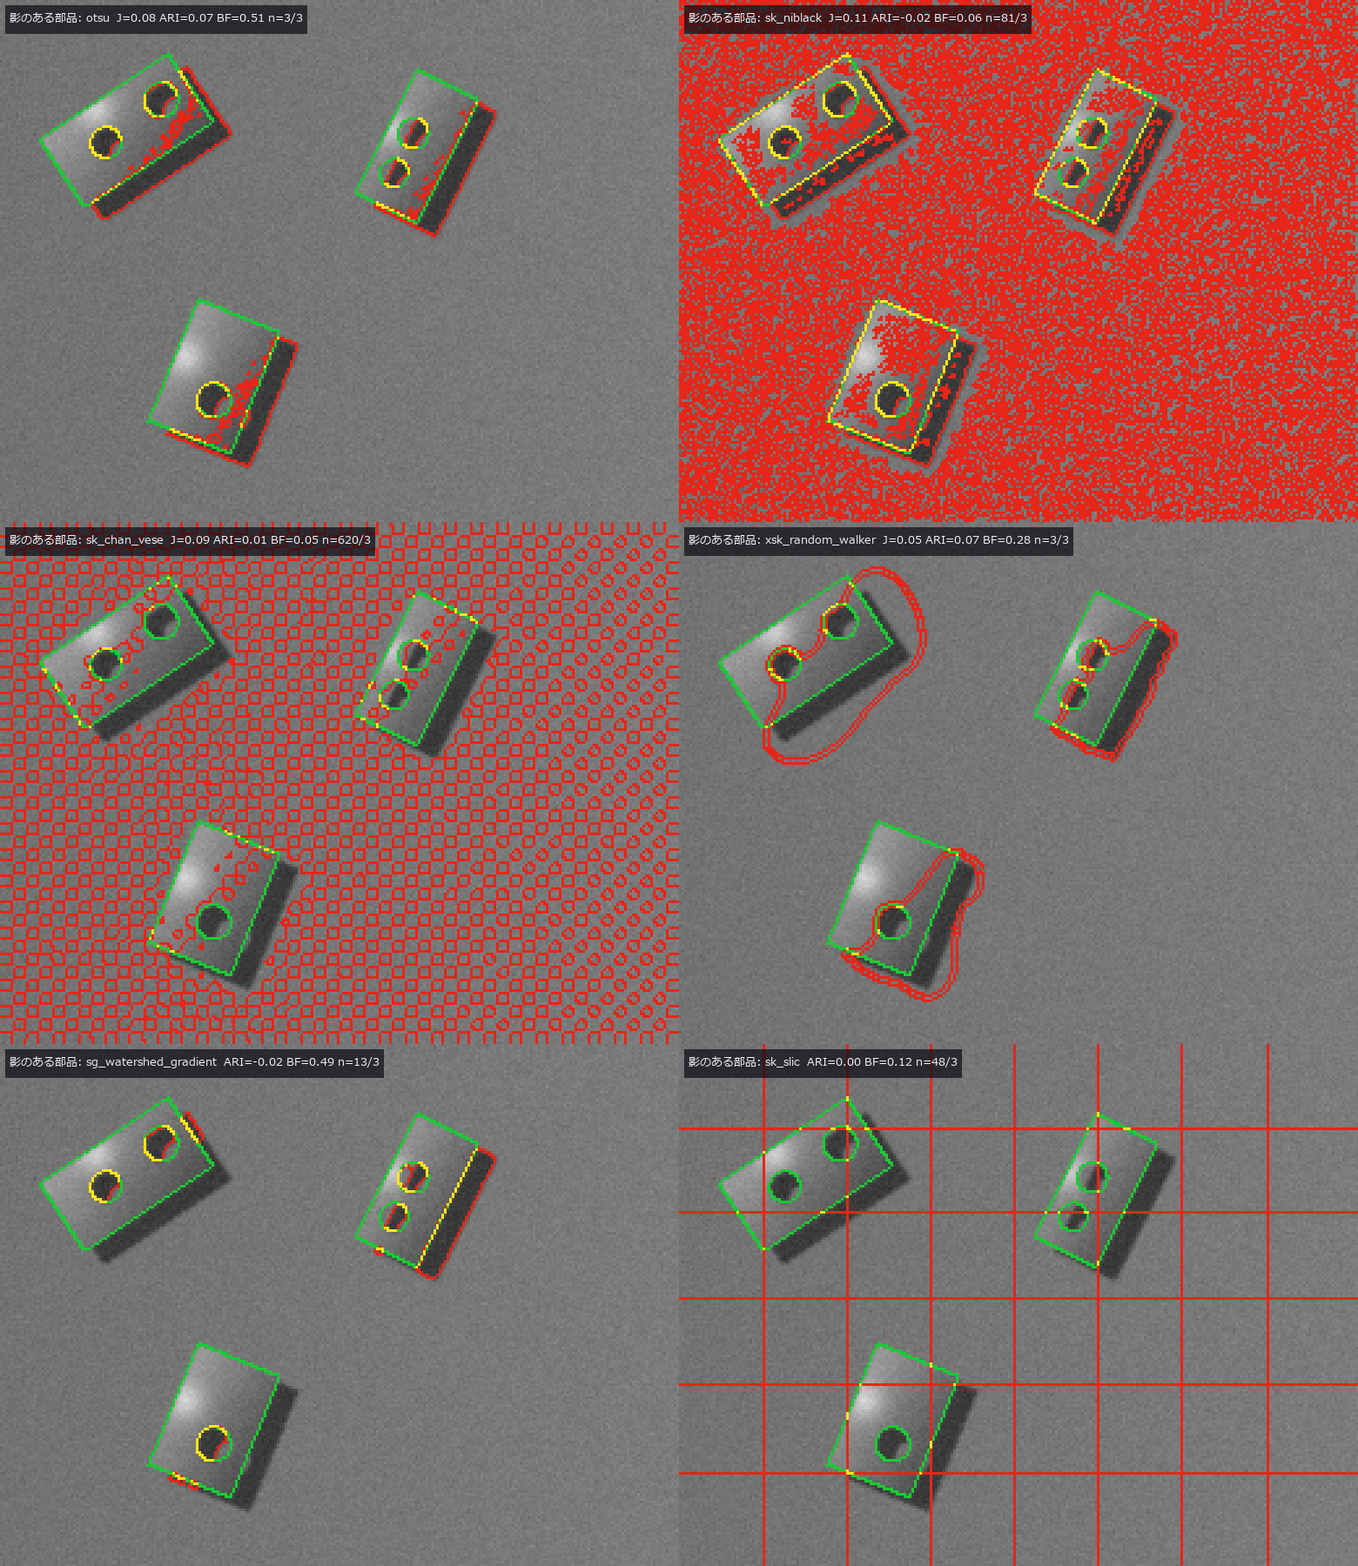
↑ The animation ―― 影のある部品: 緑 = 真値の境界、赤 = 手法の境界、黄 = 一致。1 コマ = 1 手法(otsu, local_threshold, sk_niblack, sk_sauvola, sk_chan_vese, xsk_random_walker, watersheds, sg_watershed_gradient, sk_felzenszwalb, sk_slic)。
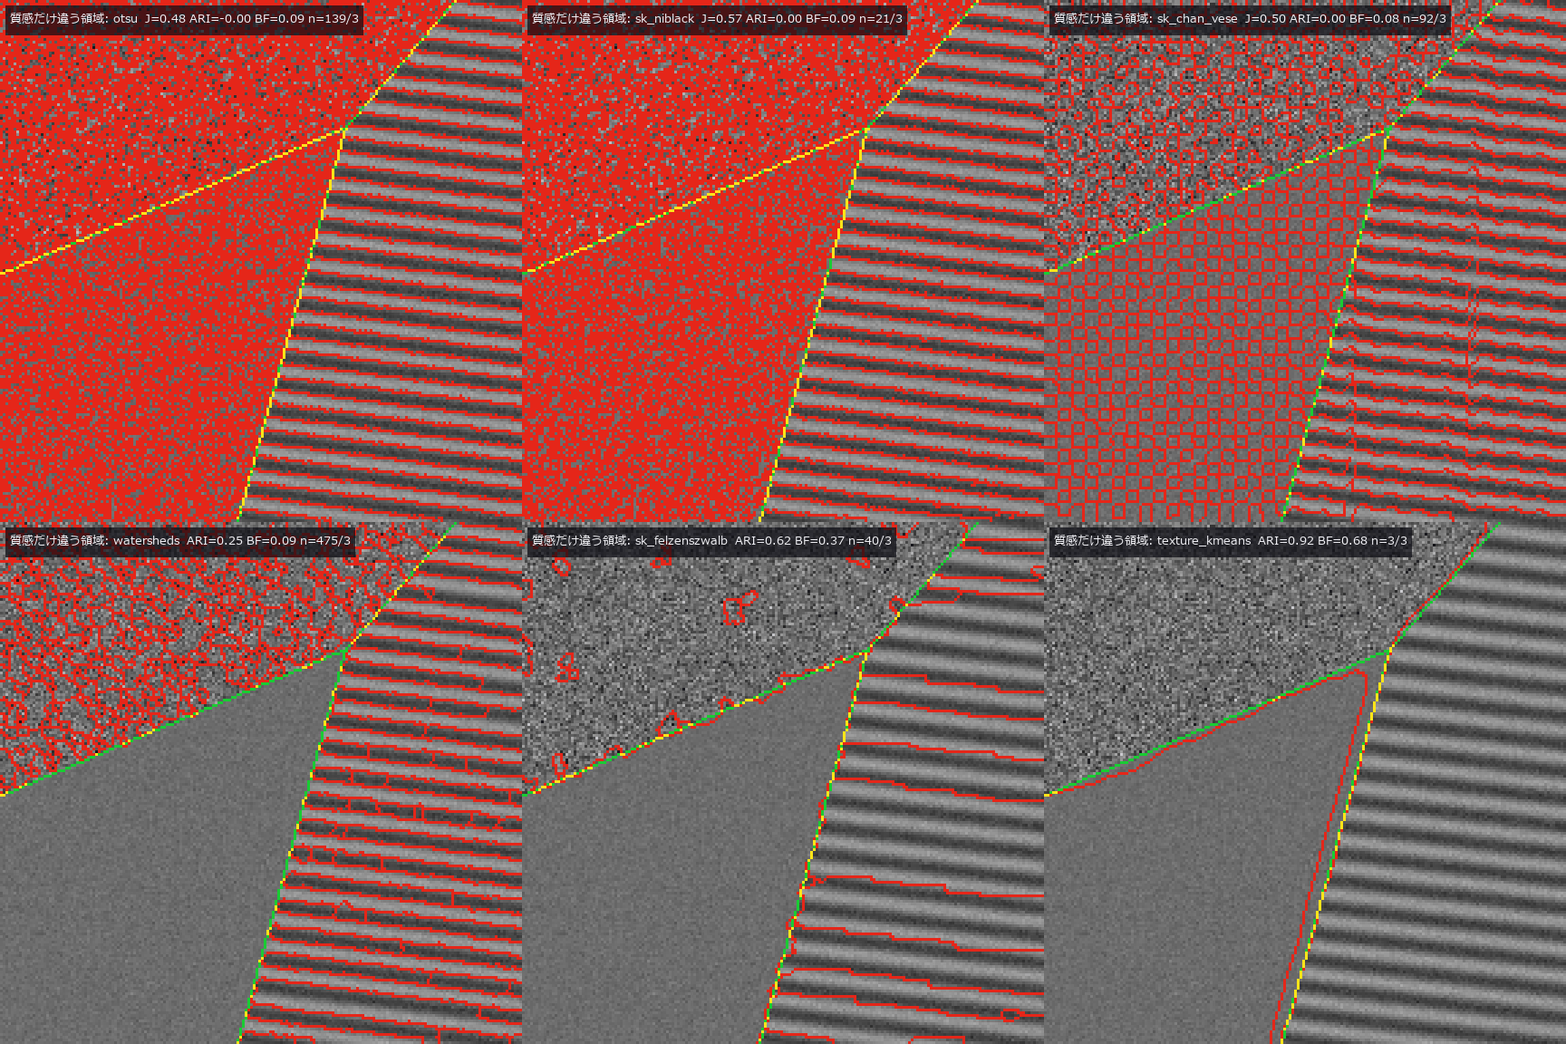
↑ The animation ―― 質感だけ違う領域: 緑 = 真値の境界、赤 = 手法の境界、黄 = 一致。1 コマ = 1 手法(otsu, local_threshold, sk_niblack, sk_sauvola, sk_chan_vese, xsk_random_walker, watersheds, sg_watershed_gradient, sk_felzenszwalb, sk_slic, texture_kmeans)。
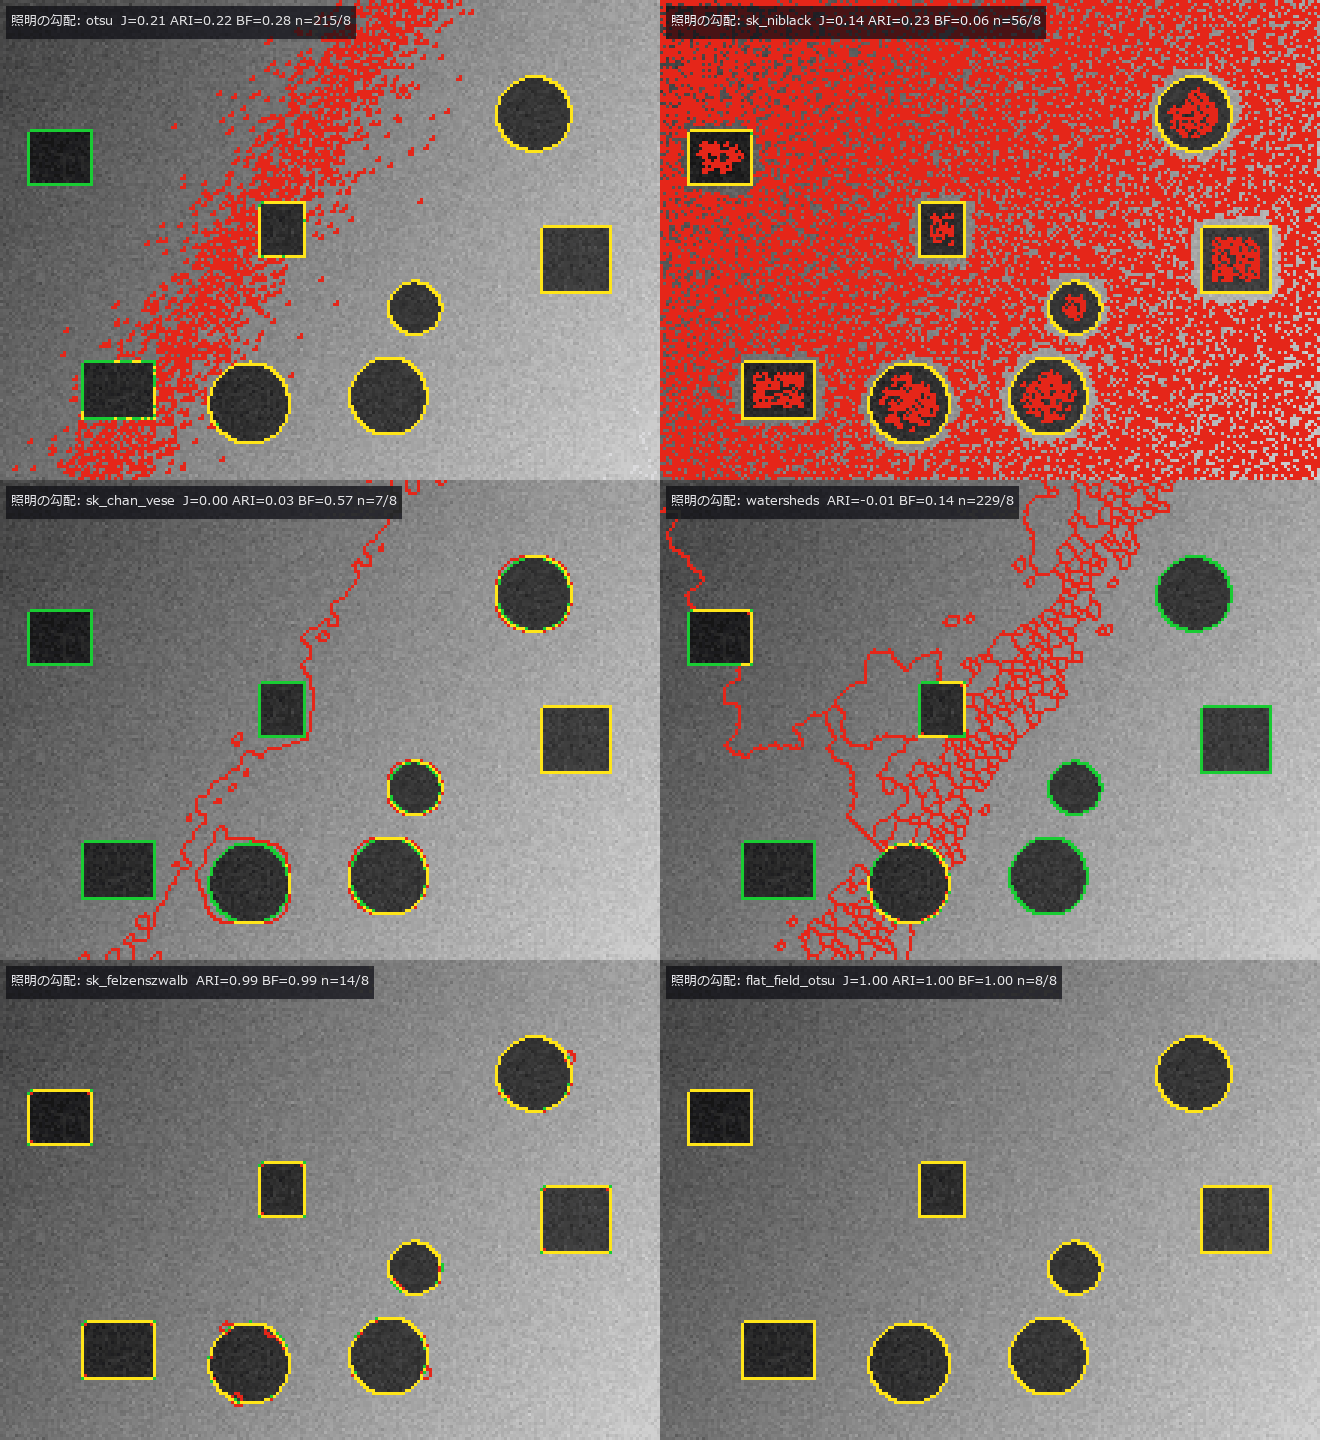
↑ The animation ―― 照明の勾配: 緑 = 真値の境界、赤 = 手法の境界、黄 = 一致。1 コマ = 1 手法(otsu, local_threshold, sk_niblack, sk_sauvola, sk_chan_vese, xsk_random_walker, watersheds, sg_watershed_gradient, sk_felzenszwalb, sk_slic, flat_field_otsu)。
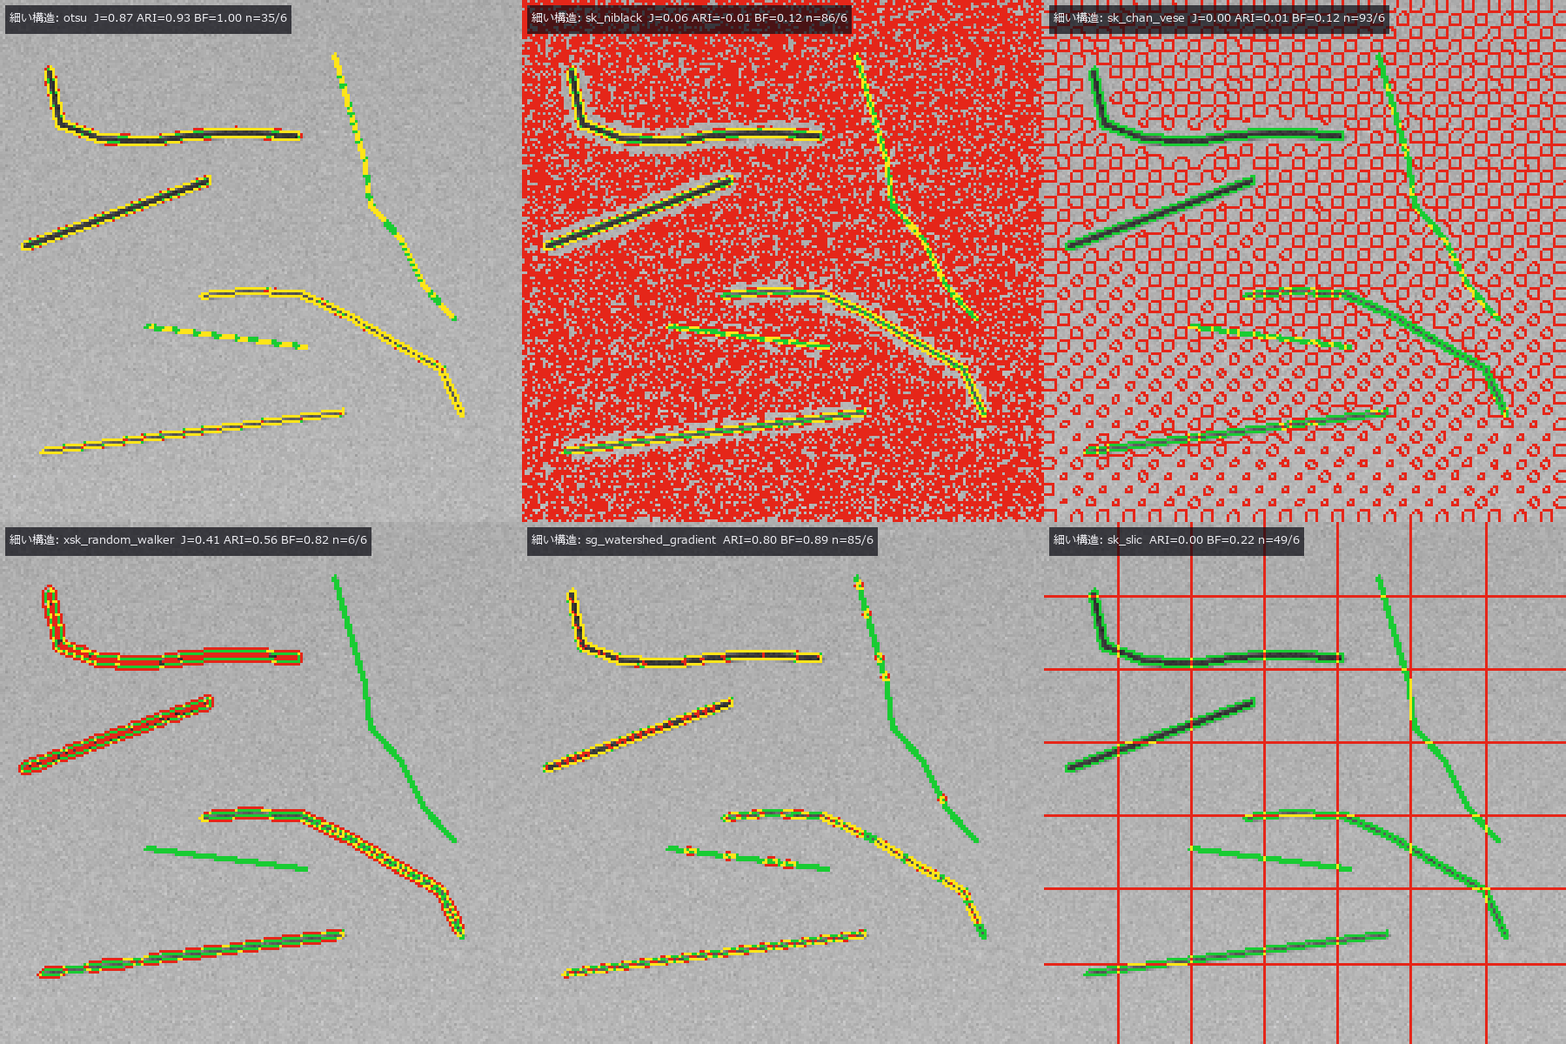
↑ The animation ―― 細い構造: 緑 = 真値の境界、赤 = 手法の境界、黄 = 一致。1 コマ = 1 手法(otsu, local_threshold, sk_niblack, sk_sauvola, sk_chan_vese, xsk_random_walker, watersheds, sg_watershed_gradient, sk_felzenszwalb, sk_slic)。
py -3.11 examples/poc_segmentation_gauntlet.py
Source: examples/poc_segmentation_gauntlet.py
This run produced 13 figures in total - see them all
Ops used (notes): blob_distance · blob_label · local_threshold · otsu · seg_dice_jaccard · seg_score_card · sg_watershed_gradient · sk_chan_vese · sk_felzenszwalb · sk_niblack · sk_sauvola · sk_slic · text_box · watersheds · world_blobs_touching · world_gradient_illumination · world_grains_voronoi · world_parts_with_shadow · world_texture_regions · world_thin_structures · xsk_random_walker
No.2026.186 —— Active Contours and Level Sets — Checking With Closed Forms How a Contour Shrinks, Enters a Concavity and Stops at an Edge
| Segmentation expansion, batch 2 — new module segcontour, 10 ops (snake, gradient vector flow, Chan–Vese energy and evolution, morphological Chan–Vese, morphological geodesic active contour with the edge-stopping function, signed-distance reinitialisation, DRLSE (distance-regularized level-set evolution), mean curvature flow). Each op is gated by a closed form or a second implementation: with no external force a circular snake shrinks exactly as the circulant-matrix eigenvalues say (error 3e-14) and matches skimage’s active_contour to 1e-13 / curvature flow loses area at dA/dt = −2π (circle −6.2767, a concave star −6.2822) / after reinitialisation | ∇φ | sits at 0.987–1.012 (10–90 %) and the zero level set does not move / the classical snake’s energy never rises (γ ≥ L, 0 increases), and Chan–Vese (alternating minimisation of the convex relaxation) is monotone in all four worlds / Dice 0.995 against the existing op sk_chan_vese. Scored with batch 1’s segeval and segworld: the classical snake cannot enter a U-shaped concavity (it bridges it completely and also floats off the flat sides — the edge-gradient force only reaches near edges), while the same α, β, γ with a GVF external force goes in (1.0 % bridged, Dice 0.993) / under an illumination gradient global two-mean Chan–Vese loses (J = 0.187) and edge-stopping local methods win (geodesic AC 0.960, DRLSE 0.938) / touching blobs score Dice 0.97 as a mask yet all 10 merge into one / on shadowed parts every contour method stays below J 0.7. Honestly: Chan–Vese 2001 does not claim monotone descent (the gate is on the convex side); the GVF, morphological-snake, DRLSE and Sussman equations were not checked against the original papers; DRLSE’s energy rose 247 times on the gradient world (explicit steps, not gated). 12 gates, 6.4 s. |
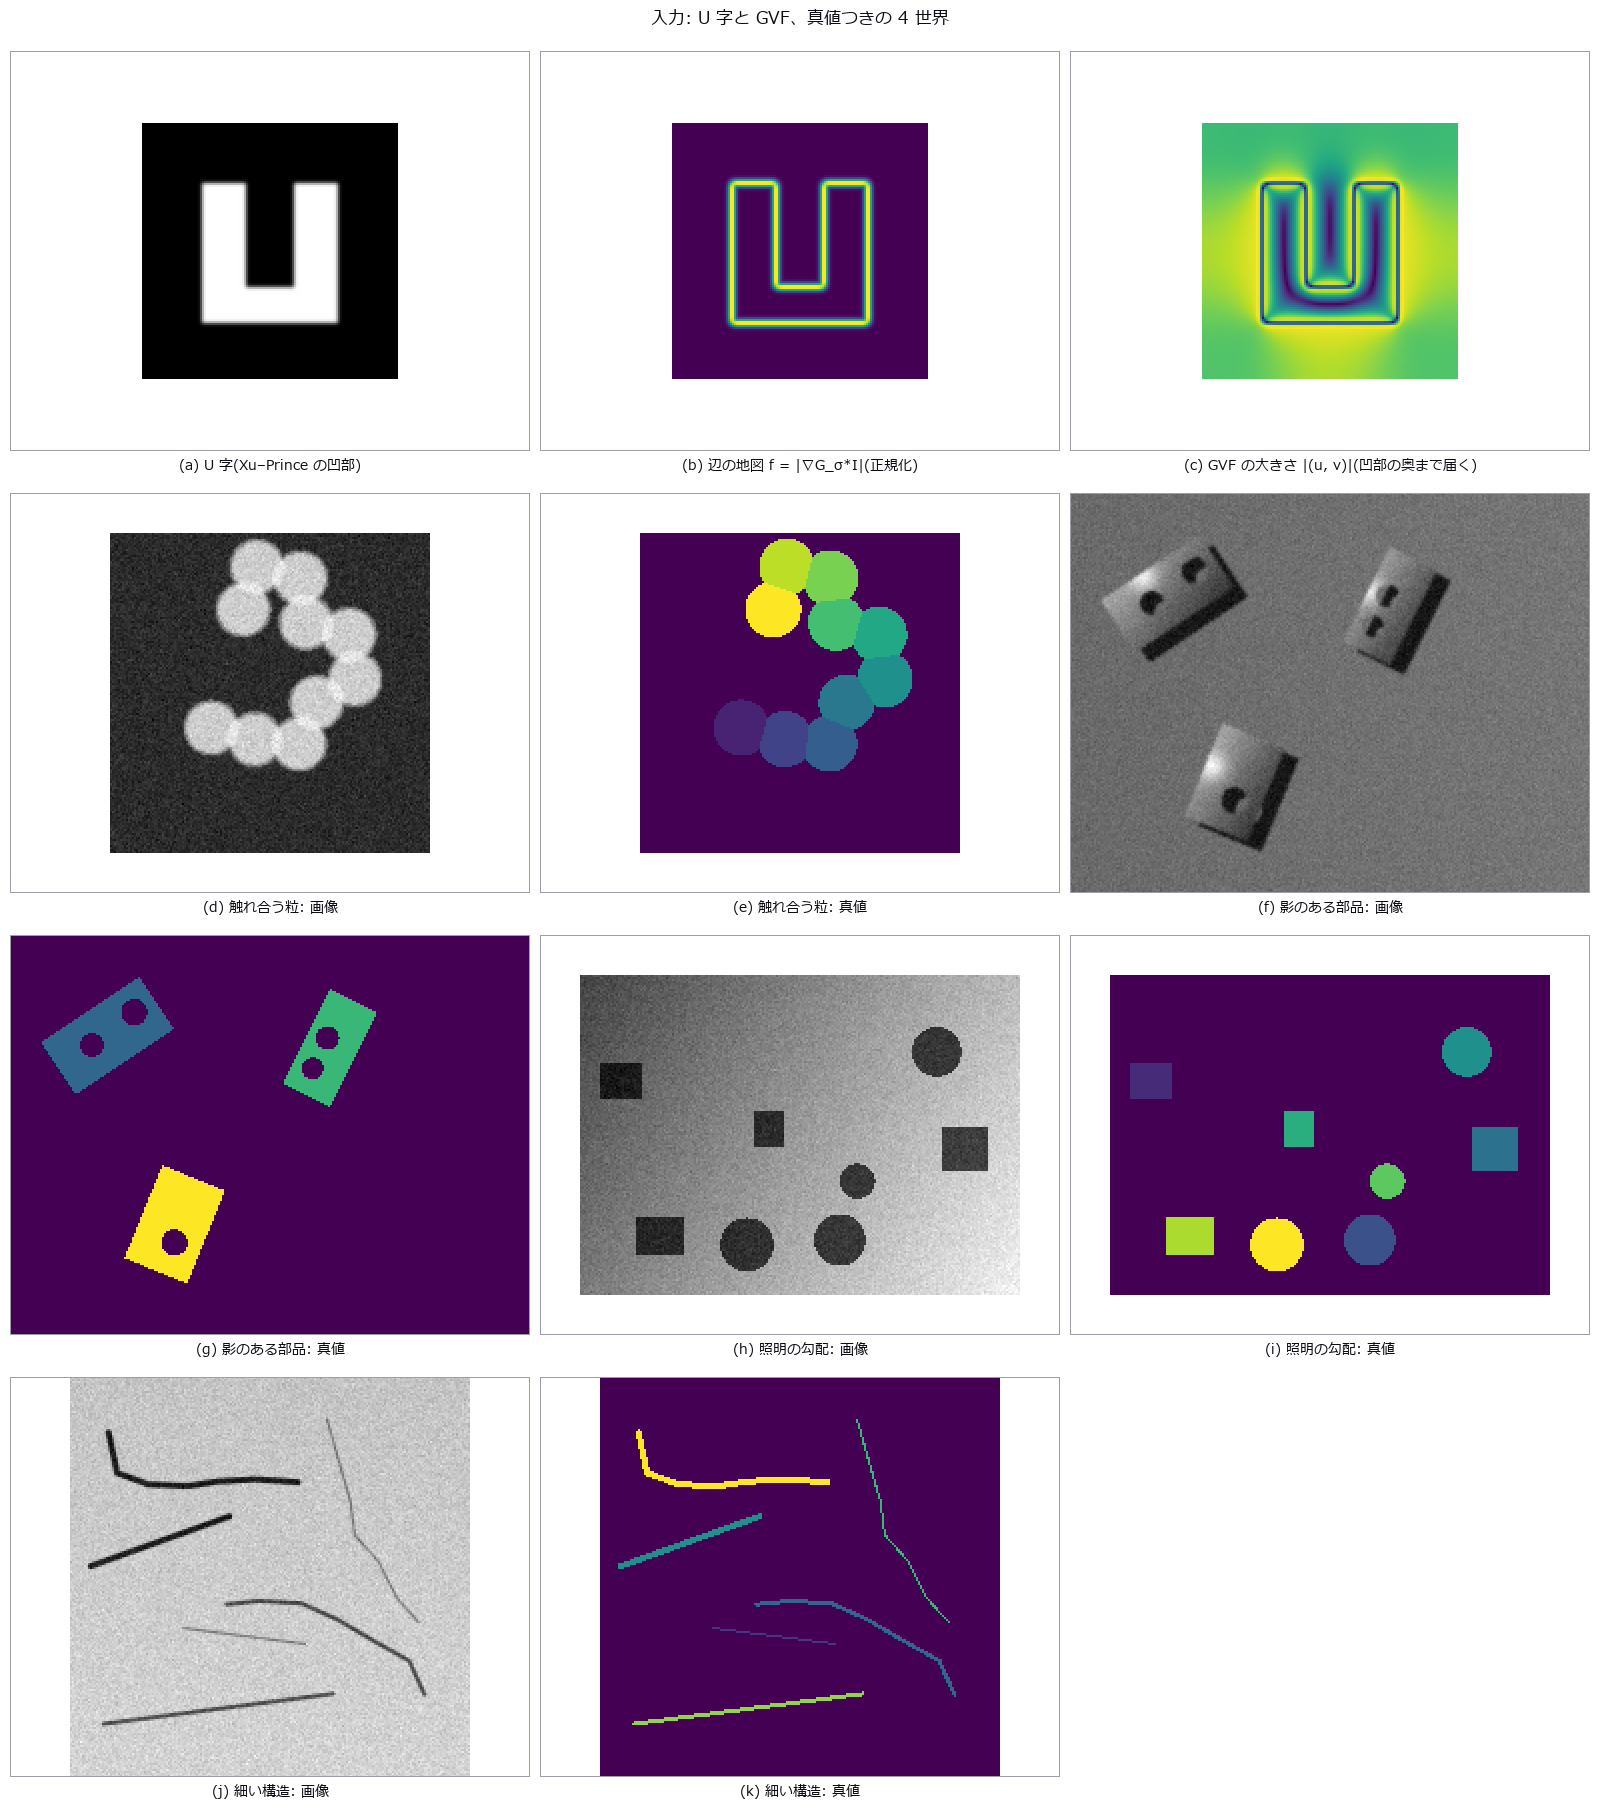
| *↑ Active Contours and Level Sets — Checking With Closed Forms How a Contour Shrinks, Enters a Concavity and Stops at an Edge ―― Segmentation expansion, batch 2 — new module segcontour, 10 ops (snake, gradient vector flow, Chan–Vese energy and evolution, morphological Chan–Vese, morphological geodesic active contour with the edge-stopping function, signed-distance reinitialisation, DRLSE (distance-regularized level-set evolution), mean curvature flow). Each op is gated by a closed form or a second implementation: with no external force a circular snake shrinks exactly as the circulant-matrix eigenvalues say (error 3e-14) and matches skimage’s active_contour to 1e-13 / curvature flow loses area at dA/dt = −2π (circle −6.2767, a concave star −6.2822) / after reinitialisation | ∇φ | sits at 0.987–1.012 (10–90 %) and the zero level set does not move / the classical snake’s energy never rises (γ ≥ L, 0 increases), and Chan–Vese (alternating minimisation of the convex relaxation) is monotone in all four worlds / Dice 0.995 against the existing op sk_chan_vese. Scored with batch 1’s segeval and segworld: the classical snake cannot enter a U-shaped concavity (it bridges it completely and also floats off the flat sides — the edge-gradient force only reaches near edges), while the same α, β, γ with a GVF external force goes in (1.0 % bridged, Dice 0.993) / under an illumination gradient global two-mean Chan–Vese loses (J = 0.187) and edge-stopping local methods win (geodesic AC 0.960, DRLSE 0.938) / touching blobs score Dice 0.97 as a mask yet all 10 merge into one / on shadowed parts every contour method stays below J 0.7. Honestly: Chan–Vese 2001 does not claim monotone descent (the gate is on the convex side); the GVF, morphological-snake, DRLSE and Sussman equations were not checked against the original papers; DRLSE’s energy rose 247 times on the gradient world (explicit steps, not gated). 12 gates, 6.4 s.* |
Terms: GVF — An external force for active contours that diffuses image gradients into a smooth vector field, extending capture range and reaching concavities.; DRLSE — A level-set evolution method whose distance regularization keeps the level-set function near a signed-distance function without reinitialization.; Dice — A 0-to-1 overlap score equal to twice the intersection size divided by the sum of the two region sizes.
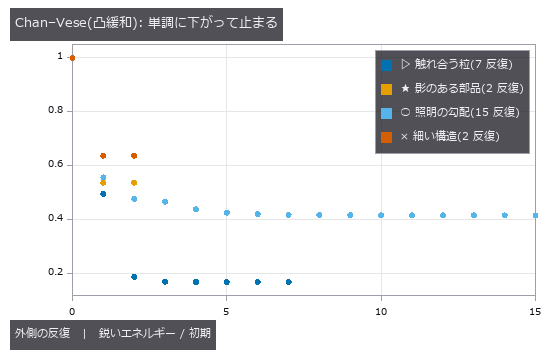
↑ The measurement ―― c の更新(内外の平均)と、c を固定した凸緩和(Chan–Esedoglu–Nikolova)の交互最小化。どの世界でも1 度も増えず、分割が変わらなくなった所で止まる(門 5)。止まった所が真値に近いかは別(表を見る)。 (figure labels are in Japanese; the numbers are the same)
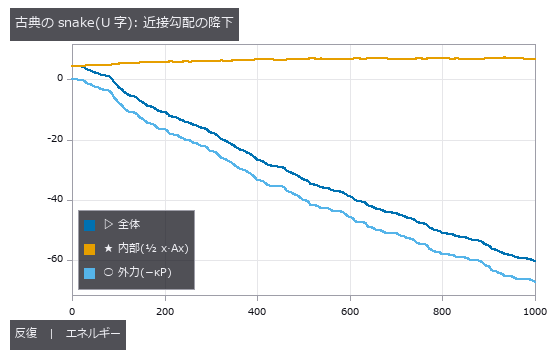
↑ γ = 1 ≥ L = 0.463(外力の勾配の Lipschitz 定数)なので降下補題により全体は増えない(実測 増加 0 回)。
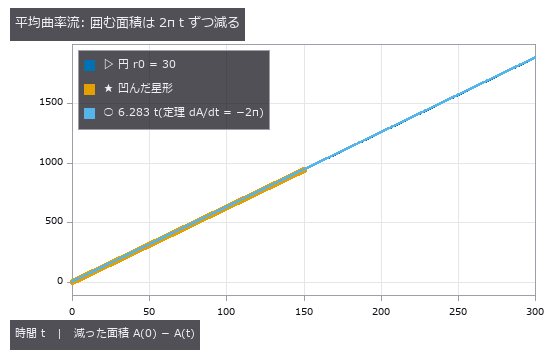
↑ dA/dt = −∮κ ds = −2π。

↑ Jaccard/Dice は物体マスク、境界 F は τ = 2 px。
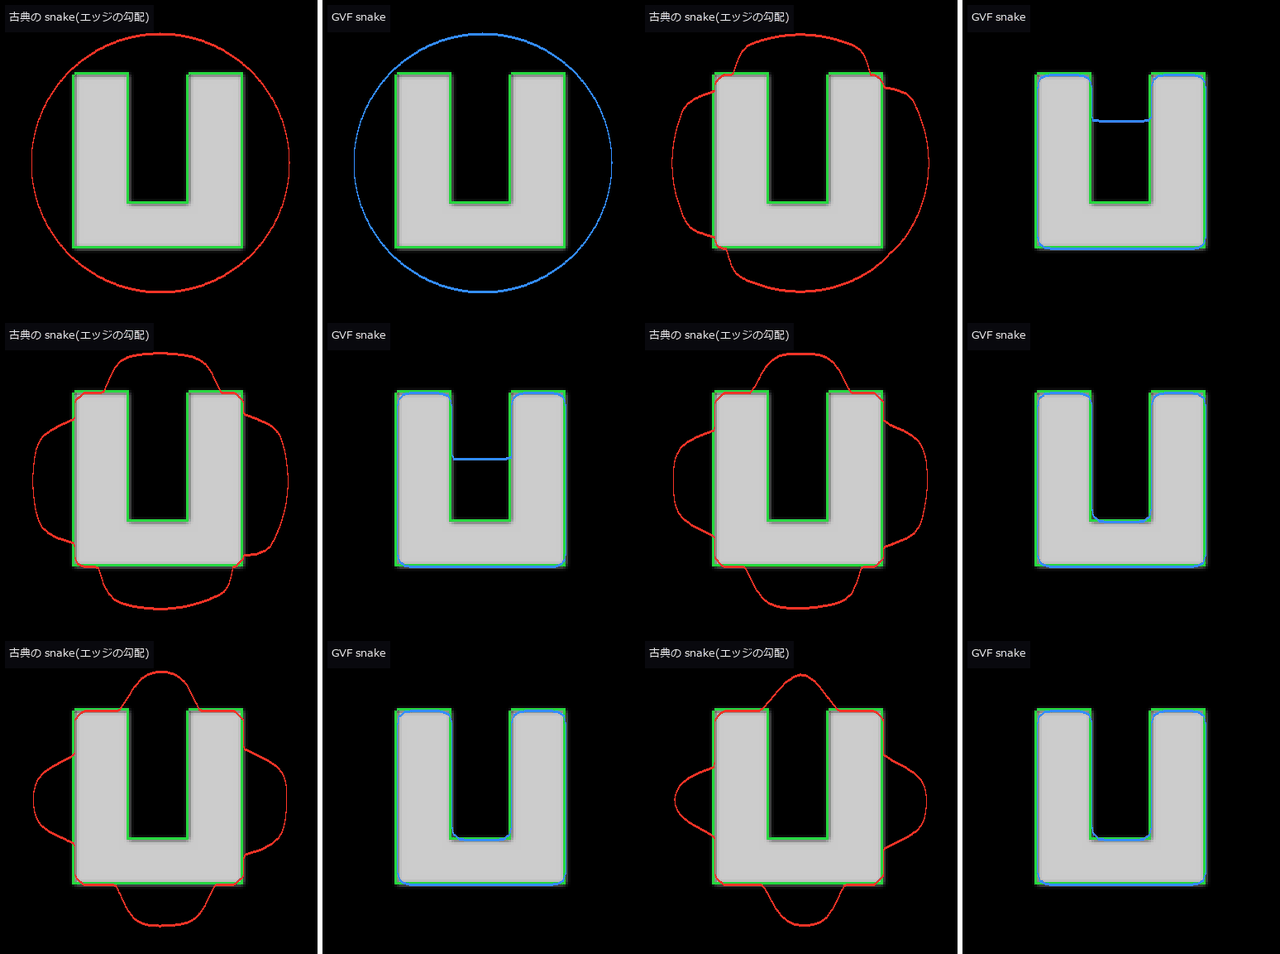
↑ The animation ―― U 字の凹部: 同じ α・β・γ で外力だけ違う。古典(赤)は凹部の口に橋を架けて止まり、辺の途中も外に浮いたまま(エッジの勾配の力は辺の近くにしか届かない)、GVF(青)は奥まで入る。緑 = 真の縁。1 コマ = 20 反復。
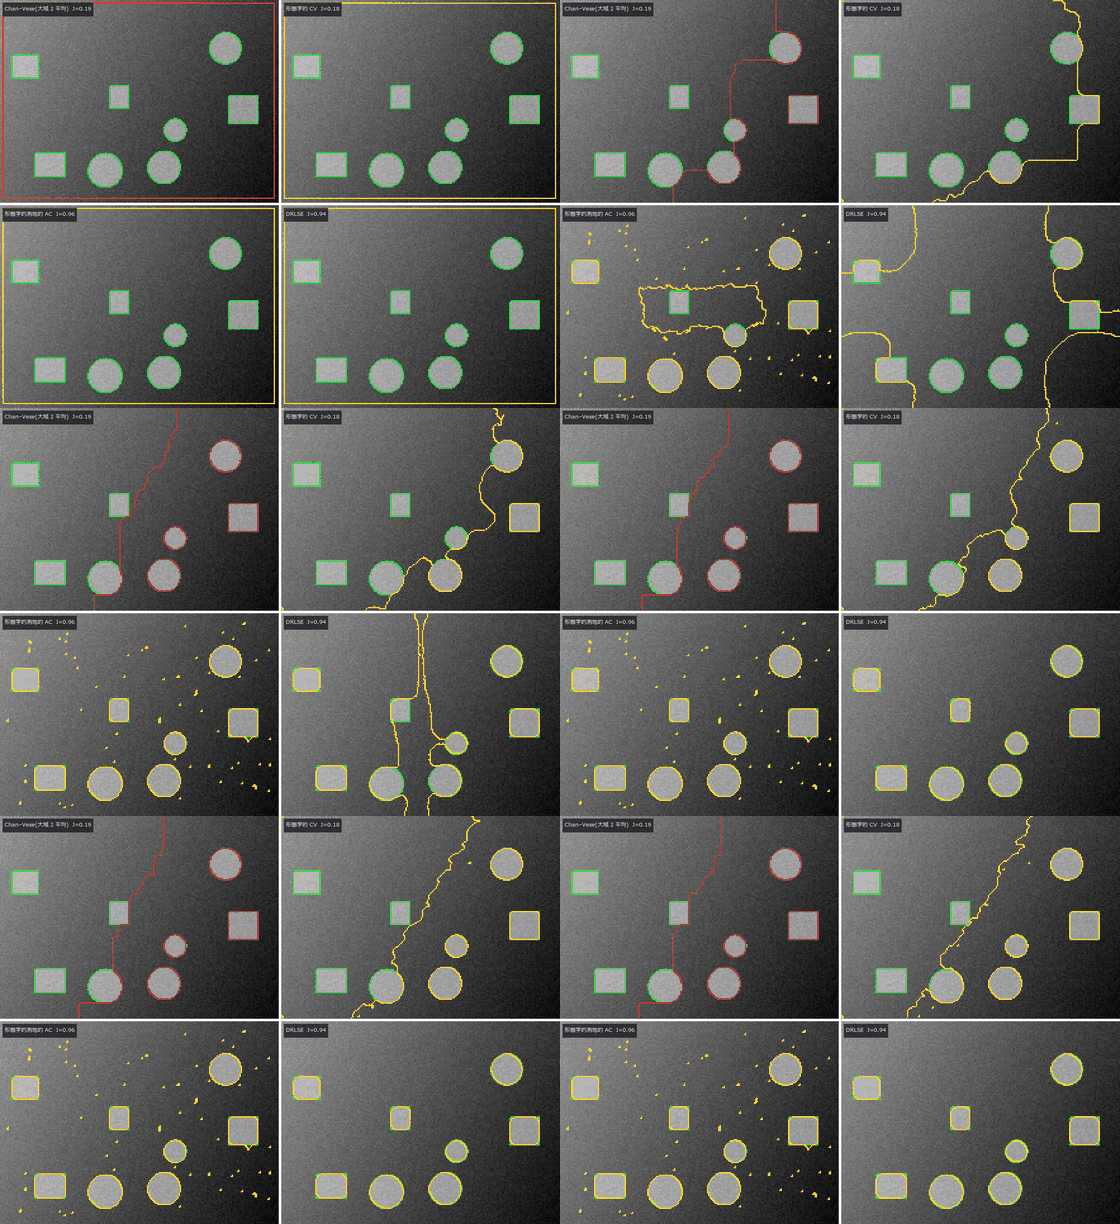
↑ The animation ―― 照明の勾配の上の暗い物体(反転して渡す)。全画面の矩形から 4 手法の輪郭が動く。大域の 2 平均(Chan–Vese・形態学的 CV)は明るい側の背景ごと切り、エッジで止まる GAC・DRLSE は物体に貼り付く(GAC は雑音の粒を数十個残す = 表の予測の個数)。緑 = 真の縁、各手法のコマは反復数に比例して間引いて 40 コマに揃えた。
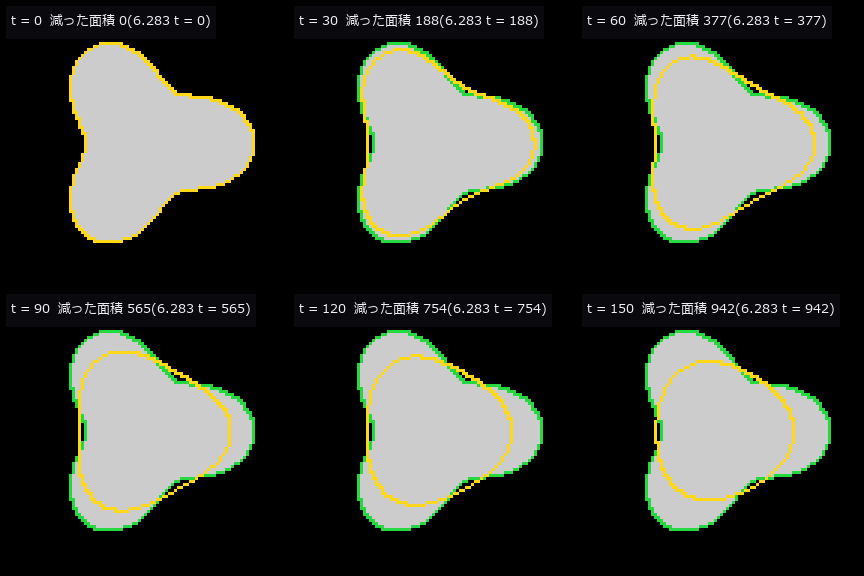
↑ The animation ―― 凹んだ星形の平均曲率流。凹部は外へ、凸部は内へ動き、丸くなりながら面積は毎時間 2π ずつ減る。
py -3.11 examples/poc_active_contours.py
Source: examples/poc_active_contours.py
This run produced 8 figures in total - see them all
Ops used (notes): chan_vese_evolve · curvature_flow · drle_evolve · edge_stop_g · gvf_field · level_set_reinit · morph_chan_vese · morph_geodesic_ac · seg_dice_jaccard · seg_score_card · sk_chan_vese · snake_evolve · text_box · world_blobs_touching · world_gradient_illumination · world_parts_with_shadow · world_thin_structures
No.2026.187 —— Graph, Hierarchical and Threshold Segmentation — Max Flow = Min Cut, Ultrametrics, and Turning a Knob From Coarse to Fine
Segmentation expansion, batch 3 — new module seggraph, 16 ops. Gates: graph cut matches the brute-force minimum on 40 problems of 3×4 pixels, and max flow = min cut (exactly, in integers, even at 160×160) / α-expansion stays within E ≤ 2c·E* on all 80 problems (Boykov–Veksler–Zabih 2001, Theorem 6.1), and a 3×3 trap shows it can stop at a local optimum / area opening on the component tree is idempotent and anti-extensive and matches skimage pixel for pixel / quasi-flat zones = connected components of the minimum spanning tree cut at α (six values of α), nested as α grows / the hierarchical watershed has 0 ultrametric violations over all triples of 107 basins, and the surviving basins are those with dynamics > θ / every SNIC superpixel is 4-connected and its boundary recall is within 0.05 of SLIC / isodata is a fixed point, triangle matches skimage, Kapur is the brute-force maximum. Which method wins where: on touching blobs the hierarchical watershed gives 19 regions at θ = 0 (over-segmented), exactly 10 blobs for θ = 0.5–3.5, and one region at large θ / graph cut at λ = 0.1 raises Dice on noisy blobs by +0.13 and lowers it on 1–3 px lines by −0.13 at the same λ / SRM gets down to 0.74–0.90 bit of VI on grains but on same-mean texture regions never beats a single region at any q / under an illumination gradient Kittler scores Dice 0.93–0.99 and isodata 0.29–0.41. Three sweep videos (θ, q, λ). Honestly: SRM’s predicate constants, the original conventions of Kittler, Kapur and the triangle method, and SNIC’s equation (1) were not checked against the papers. 13 gates, 6.4 s.
↑ Graph, Hierarchical and Threshold Segmentation — Max Flow = Min Cut, Ultrametrics, and Turning a Knob From Coarse to Fine ―― Segmentation expansion, batch 3 — new module seggraph, 16 ops. Gates: graph cut matches the brute-force minimum on 40 problems of 3×4 pixels, and max flow = min cut (exactly, in integers, even at 160×160) / α-expansion stays within E ≤ 2c·E on all 80 problems (Boykov–Veksler–Zabih 2001, Theorem 6.1), and a 3×3 trap shows it can stop at a local optimum / area opening on the component tree is idempotent and anti-extensive and matches skimage pixel for pixel / quasi-flat zones = connected components of the minimum spanning tree cut at α (six values of α), nested as α grows / the hierarchical watershed has 0 ultrametric violations over all triples of 107 basins, and the surviving basins are those with dynamics > θ / every SNIC superpixel is 4-connected and its boundary recall is within 0.05 of SLIC / isodata is a fixed point, triangle matches skimage, Kapur is the brute-force maximum. Which method wins where: on touching blobs the hierarchical watershed gives 19 regions at θ = 0 (over-segmented), exactly 10 blobs for θ = 0.5–3.5, and one region at large θ / graph cut at λ = 0.1 raises Dice on noisy blobs by +0.13 and lowers it on 1–3 px lines by −0.13 at the same λ / SRM gets down to 0.74–0.90 bit of VI on grains but on same-mean texture regions never beats a single region at any q / under an illumination gradient Kittler scores Dice 0.93–0.99 and isodata 0.29–0.41. Three sweep videos (θ, q, λ). Honestly: SRM’s predicate constants, the original conventions of Kittler, Kapur and the triangle method, and SNIC’s equation (1) were not checked against the papers. 13 gates, 6.4 s.*
Terms: SNIC — A priority-queue region-growing method that produces connected superpixels without iterative clustering.; SLIC — A local clustering method that groups pixels into approximately uniform superpixels using a distance over colour and image position.
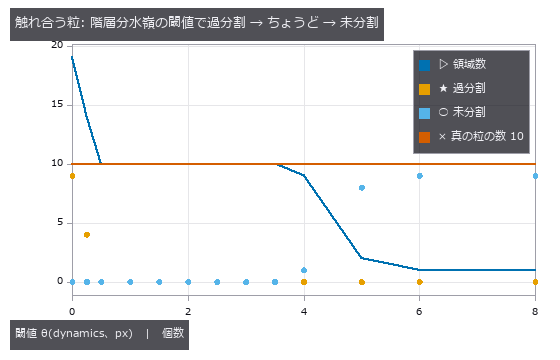
↑ The measurement ―― −距離変換の地形の 1 本の最小全域森を、dynamics ≤ θ の辺で結ぶ。θ = 0 は雑音の凹みまで盆地にして過分割、θ = 0.5〜3 px で粒の数ちょうど、くびれの深さ(重なり 20 %)を超えると隣の粒と融合する。 (figure labels are in Japanese; the numbers are the same)

↑ エネルギーは毎回厳密に最小(最大フロー = 最小カット)。
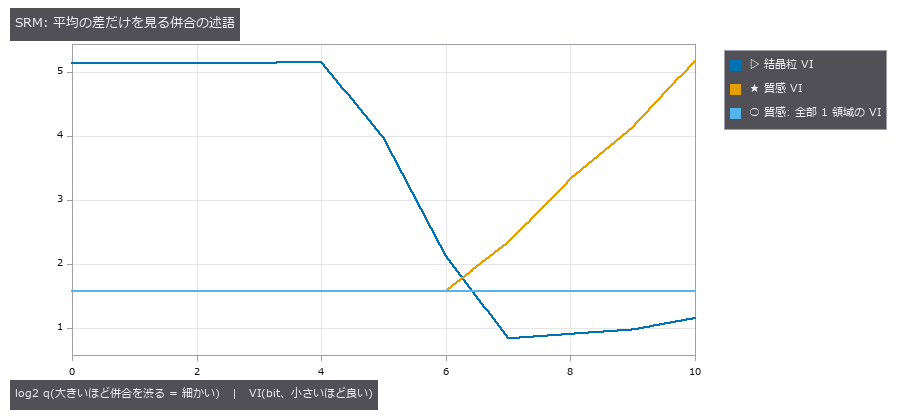
↑ 結晶粒は q = 256 付近で VI が 1 bit を切る。
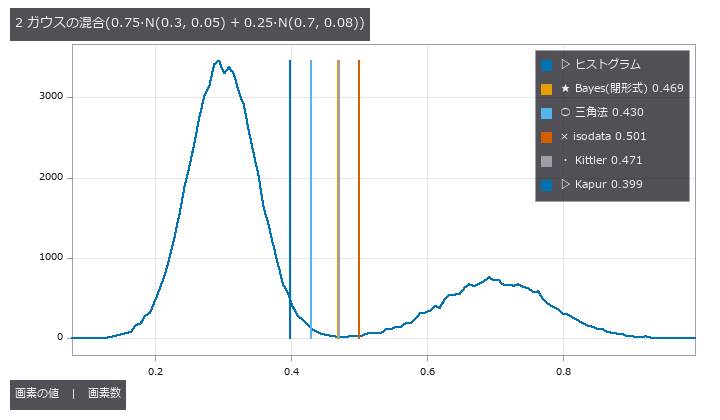
↑ Kittler は 2 クラスの分散を別々に持つので Bayes の最小誤差の閾値(2 次方程式の根)に乗る。

↑ 照明の勾配では背景の裾が長く、2 平均の中点(isodata)は背景の中に落ちる。
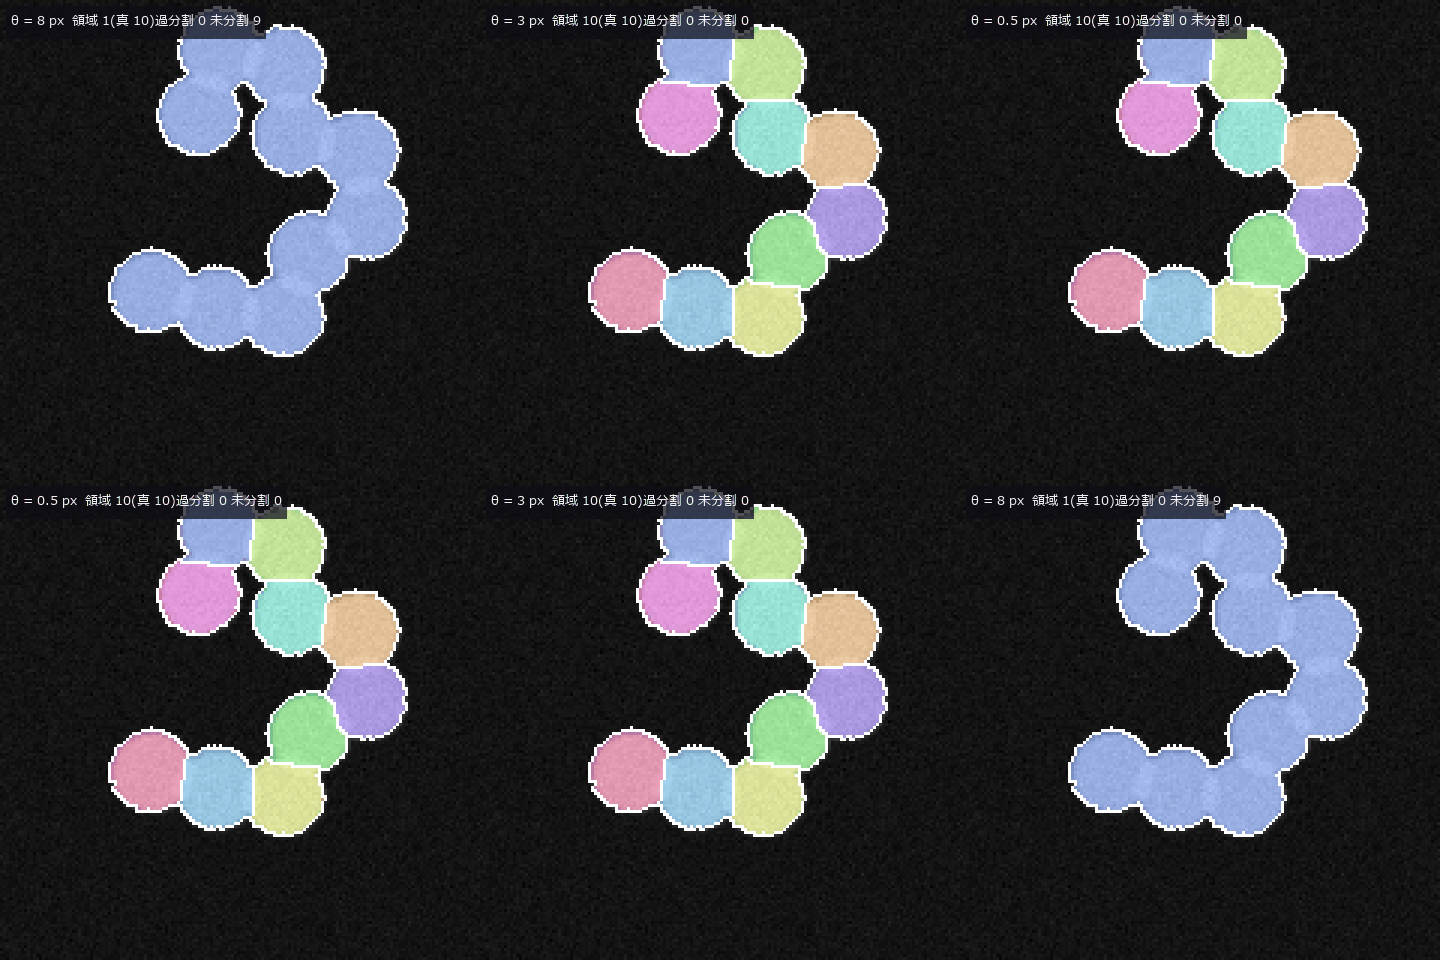
↑ The animation ―― 触れ合う粒の階層分水嶺。θ を大 → 小 → 大に振る: 1 領域から粒の数ちょうどを経て雑音の凹みで過分割へ、そして戻る。どのコマも同じ 1 本の木の切り方(入れ子)。
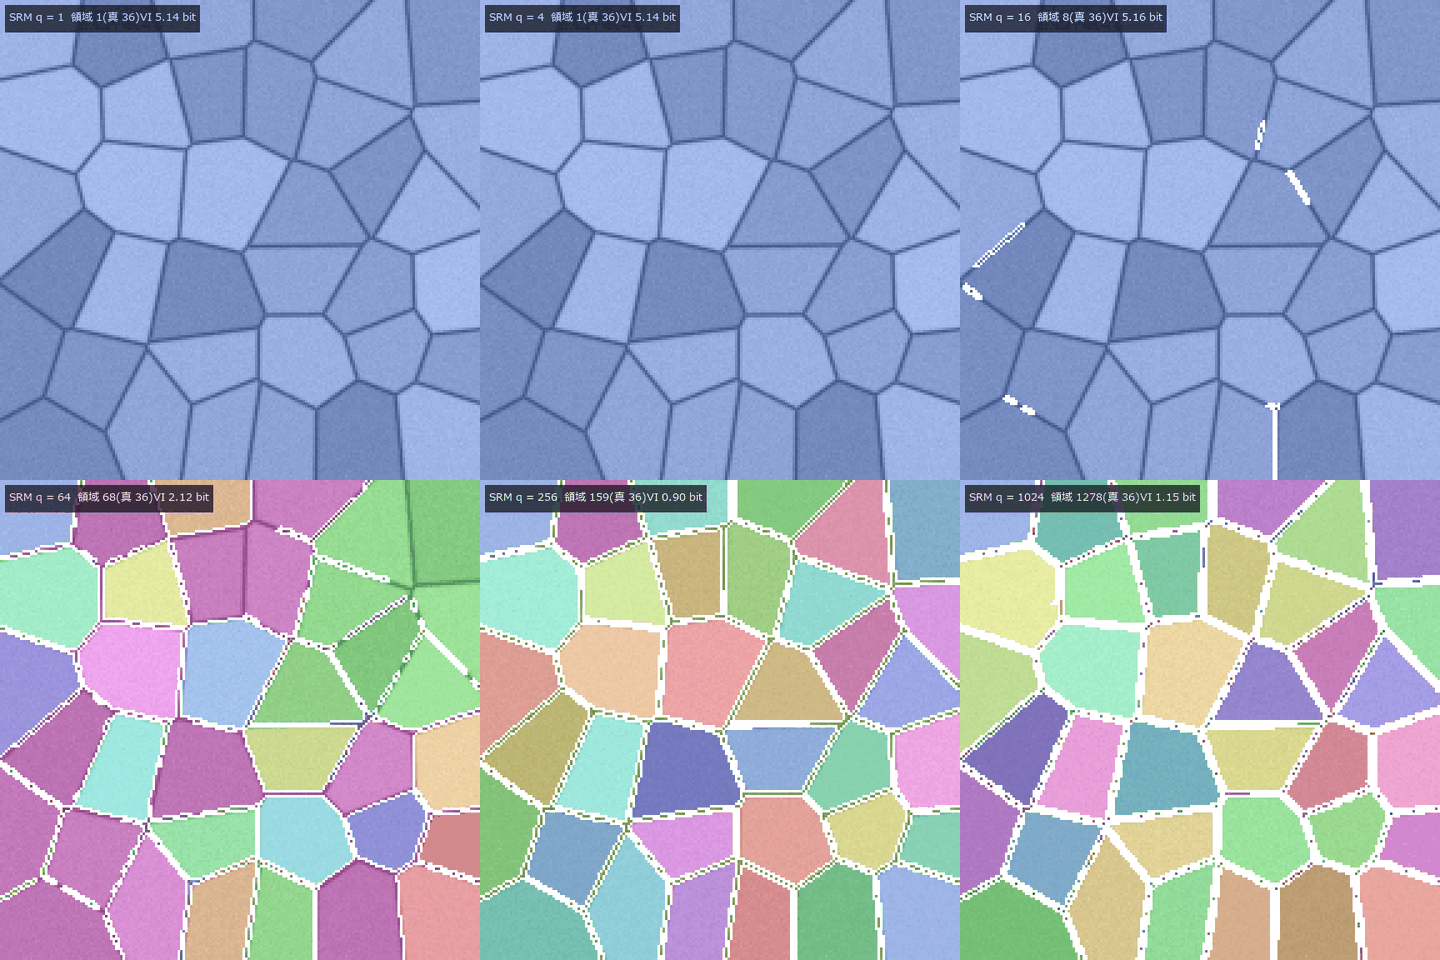
↑ The animation ―― 結晶粒の SRM。q = 1(全部 1 領域)から 1024(細切れ)へ。q = 256 前後で粒界に沿う。
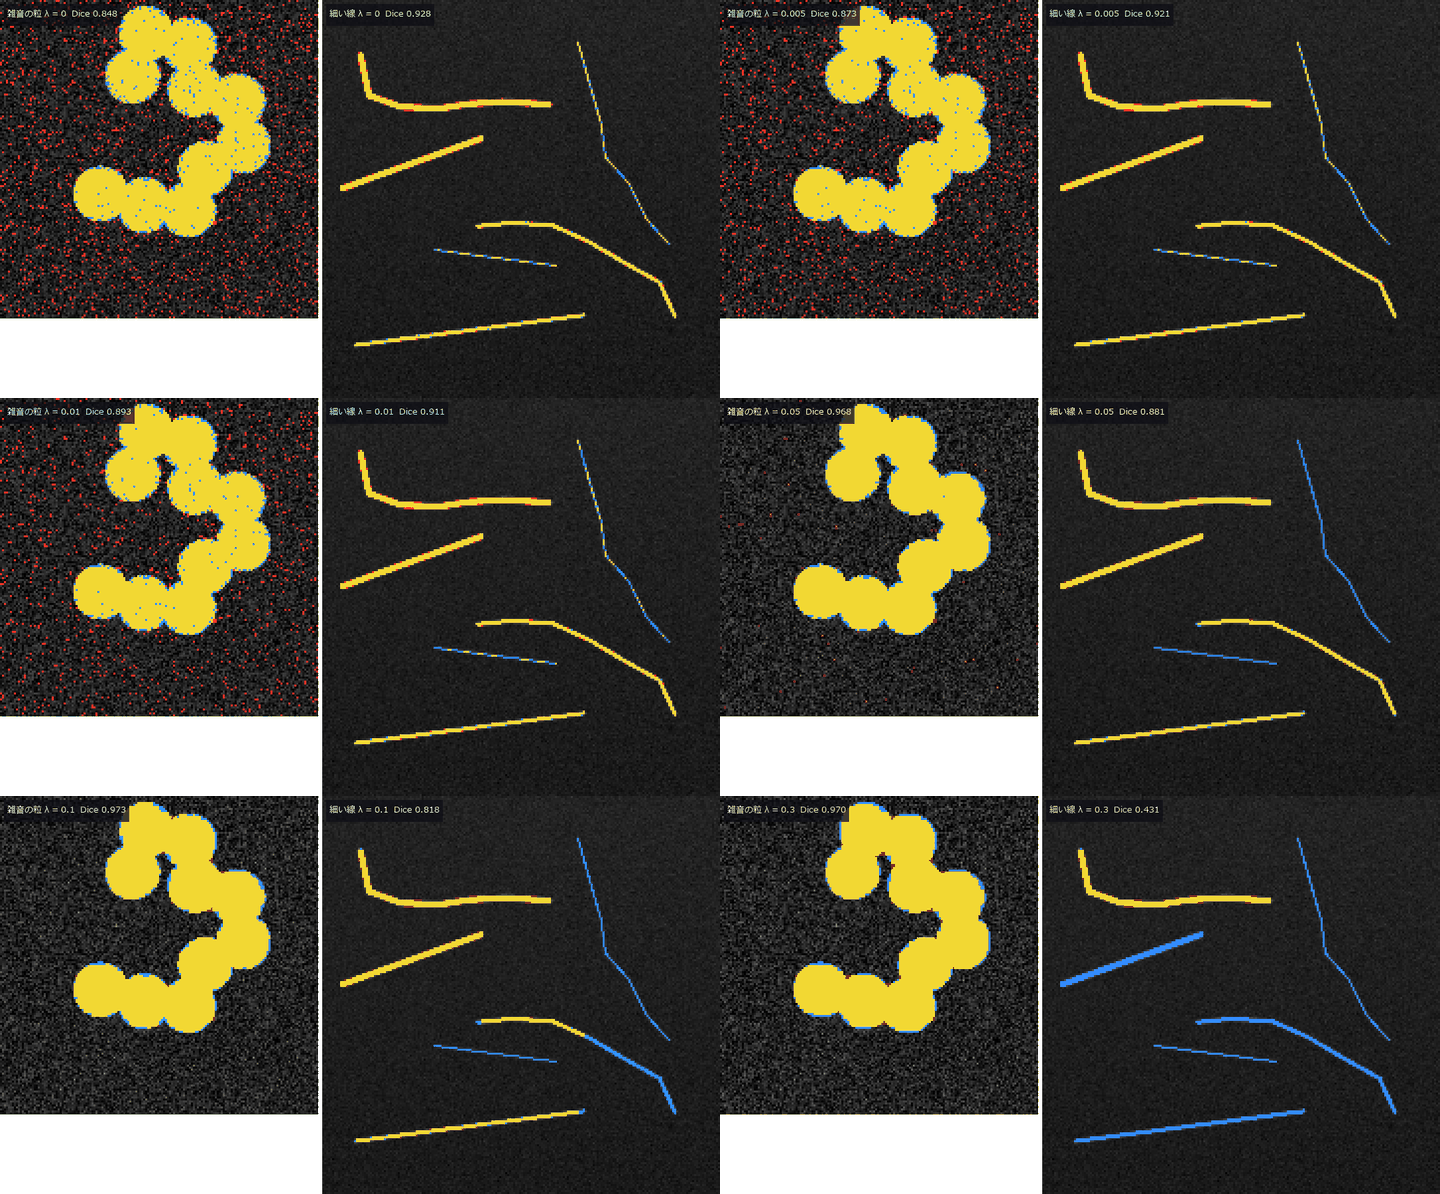
↑ The animation ―― graph cut の λ を 0 → 0.3。黄 = 正解の物体、赤 = 余計、青 = 取り逃し。左の雑音の点は消え、右の細い線も同じ λ で途切れて消える。
py -3.11 examples/poc_graph_hierarchy_segmentation.py
Source: examples/poc_graph_hierarchy_segmentation.py
This run produced 10 figures in total - see them all
Ops used (notes): alpha_expansion · alpha_tree · area_opening_attr · graph_cut_binary · hierarchical_watershed · quasi_flat_zones · quickshift · seg_boundary_f · seg_dice_jaccard · seg_object_counts_match · seg_score_card · seg_under_over_segmentation · snic_superpixels · statistical_region_merging · superpixel_quality · text_box · threshold_isodata · threshold_kapur · threshold_kittler · threshold_triangle · ultrametric_contour_map · world_blobs_touching · world_gradient_illumination · world_grains_voronoi … (+3)
No.2026.227 —— A Fly’s Eye Closing In on Stripes — Do Zebra Stripes Really Spoil a Compound Eye’s Sense of Distance, and Would a Fibonacci Eye Do Better?
Tabanid flies cannot slow down in a controlled way before zebra stripes (Caro et al. 2019) and fly faster, keep away and do not land near stripes or checkerboards (How et al. 2020). This PoC counts how much of the folk claim that stripes spoil the sense of distance can be explained by the closed forms of a compound eye and a Hassenstein–Reichardt correlator. Six new ops: fly_view_plane_texture samples a periodic frontal surface analytically under the hexagonal lattice and a Gaussian acceptance function (no image resampling, 1e-9 against the closed form), sampling_alias_distance returns the distance P cos^2(theta)/(sqrt(3) dphi) beyond which a period P aliases on a lattice of pitch dphi (also the working-distance rule of an inspection camera), fly_expansion_readout reads tau from the flow over the whole eye, traj_tau_dot gives tau and tau-dot along a measured trajectory, fly_vogel_lattice is a Fibonacci (Vogel-spiral) eye and lattice_moire_peak the sharpness of the moire. A 7 cm stripe aliases for a tabanid eye (dphi 1.1 deg) beyond 2.105 m head-on and 0.526 m at 60 deg, while a Drosophila eye (4.63 / 8.23 deg) blurs it away (MTF 0.024). The HR sign reversal agrees with the closed form in more than 97 % of ommatidia, retreats to the periphery on approach, and the azimuthal pairs switch from ‘receding’ to ‘approaching’ at 1.71 m against a predicted 1.65 to 1.77 m. The aperture effect of vertical stripes returns exactly 2 tau in both the radial fit and the divergence (closed form 2, measured 1.992) and a checkerboard restores tau, which reproduces in numbers the logic of How et al. 2020 that avoidance of checkerboards rules out the aperture effect. The temporal frequency v tan(theta)/P during the approach does not depend on distance, so the correlator loses the range. The Fibonacci eye (same 721 ommatidia, same mean spacing) wins on moire diffusion (peak sharpness 2521 hexagonal / 4.3 Vogel / 5.2 jittered hexagonal), the hexagon resolves best just below Nyquist (residual 0.021 / 0.035 / 0.022), false flow is set by pair spacing rather than by lattice regularity (every azimuthal pair of the hexagon is reversed, every diagonal pair is correct), and a fovea (density power 0.5 to 0.8) sharpens the true-frequency peak from 5.2 to 11.0. The external truth (How et al. 2020’s Dryad 3-D trajectories, CC0) runs when placed and is skipped with an explicit ‘not placed’ otherwise. Dettlaff 2026 (arXiv:2605.17049, preprint, single author, code not public) is named as the moire hypothesis this is compared against. Nothing is learned; one gain is calibrated.
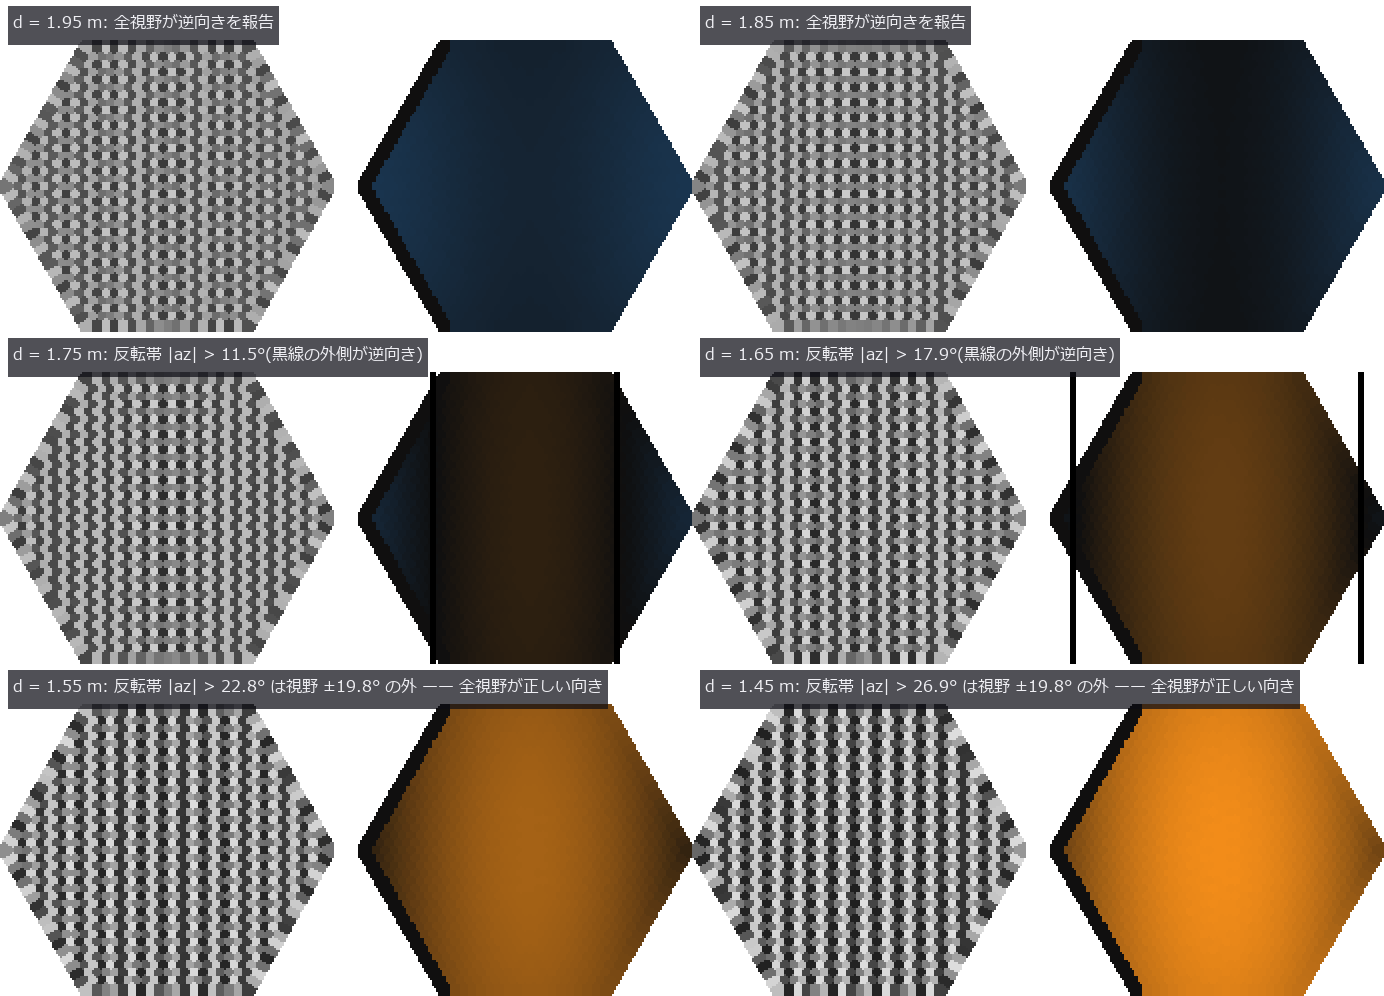
↑ A Fly’s Eye Closing In on Stripes — Do Zebra Stripes Really Spoil a Compound Eye’s Sense of Distance, and Would a Fibonacci Eye Do Better? ―― Tabanid flies cannot slow down in a controlled way before zebra stripes (Caro et al. 2019) and fly faster, keep away and do not land near stripes or checkerboards (How et al. 2020). This PoC counts how much of the folk claim that stripes spoil the sense of distance can be explained by the closed forms of a compound eye and a Hassenstein–Reichardt correlator. Six new ops: fly_view_plane_texture samples a periodic frontal surface analytically under the hexagonal lattice and a Gaussian acceptance function (no image resampling, 1e-9 against the closed form), sampling_alias_distance returns the distance P cos^2(theta)/(sqrt(3) dphi) beyond which a period P aliases on a lattice of pitch dphi (also the working-distance rule of an inspection camera), fly_expansion_readout reads tau from the flow over the whole eye, traj_tau_dot gives tau and tau-dot along a measured trajectory, fly_vogel_lattice is a Fibonacci (Vogel-spiral) eye and lattice_moire_peak the sharpness of the moire. A 7 cm stripe aliases for a tabanid eye (dphi 1.1 deg) beyond 2.105 m head-on and 0.526 m at 60 deg, while a Drosophila eye (4.63 / 8.23 deg) blurs it away (MTF 0.024). The HR sign reversal agrees with the closed form in more than 97 % of ommatidia, retreats to the periphery on approach, and the azimuthal pairs switch from ‘receding’ to ‘approaching’ at 1.71 m against a predicted 1.65 to 1.77 m. The aperture effect of vertical stripes returns exactly 2 tau in both the radial fit and the divergence (closed form 2, measured 1.992) and a checkerboard restores tau, which reproduces in numbers the logic of How et al. 2020 that avoidance of checkerboards rules out the aperture effect. The temporal frequency v tan(theta)/P during the approach does not depend on distance, so the correlator loses the range. The Fibonacci eye (same 721 ommatidia, same mean spacing) wins on moire diffusion (peak sharpness 2521 hexagonal / 4.3 Vogel / 5.2 jittered hexagonal), the hexagon resolves best just below Nyquist (residual 0.021 / 0.035 / 0.022), false flow is set by pair spacing rather than by lattice regularity (every azimuthal pair of the hexagon is reversed, every diagonal pair is correct), and a fovea (density power 0.5 to 0.8) sharpens the true-frequency peak from 5.2 to 11.0. The external truth (How et al. 2020’s Dryad 3-D trajectories, CC0) runs when placed and is skipped with an explicit ‘not placed’ otherwise. Dettlaff 2026 (arXiv:2605.17049, preprint, single author, code not public) is named as the moire hypothesis this is compared against. Nothing is learned; one gain is calibrated.

↑ The measurement ―― the alias distance P/(sqrt3 dphi) for a 7 cm period against the inter-ommatidial angle; the acceptance ratio changes only the contrast left at Nyquist, not the distance (figure labels are in Japanese; the numbers are the same)
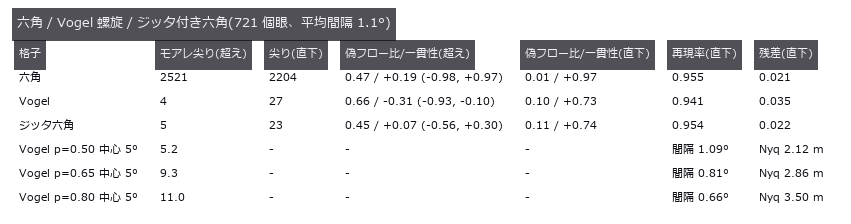
↑ moire sharpness = strongest peak / median of the sub-Nyquist spectrum; false flow = energy of HR pair responses with the wrong sign / total, and the c…
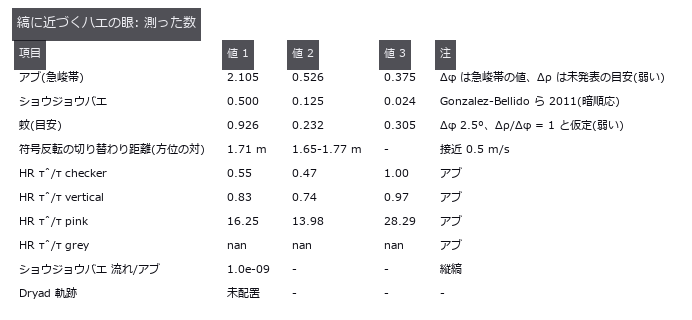
↑ この回の図
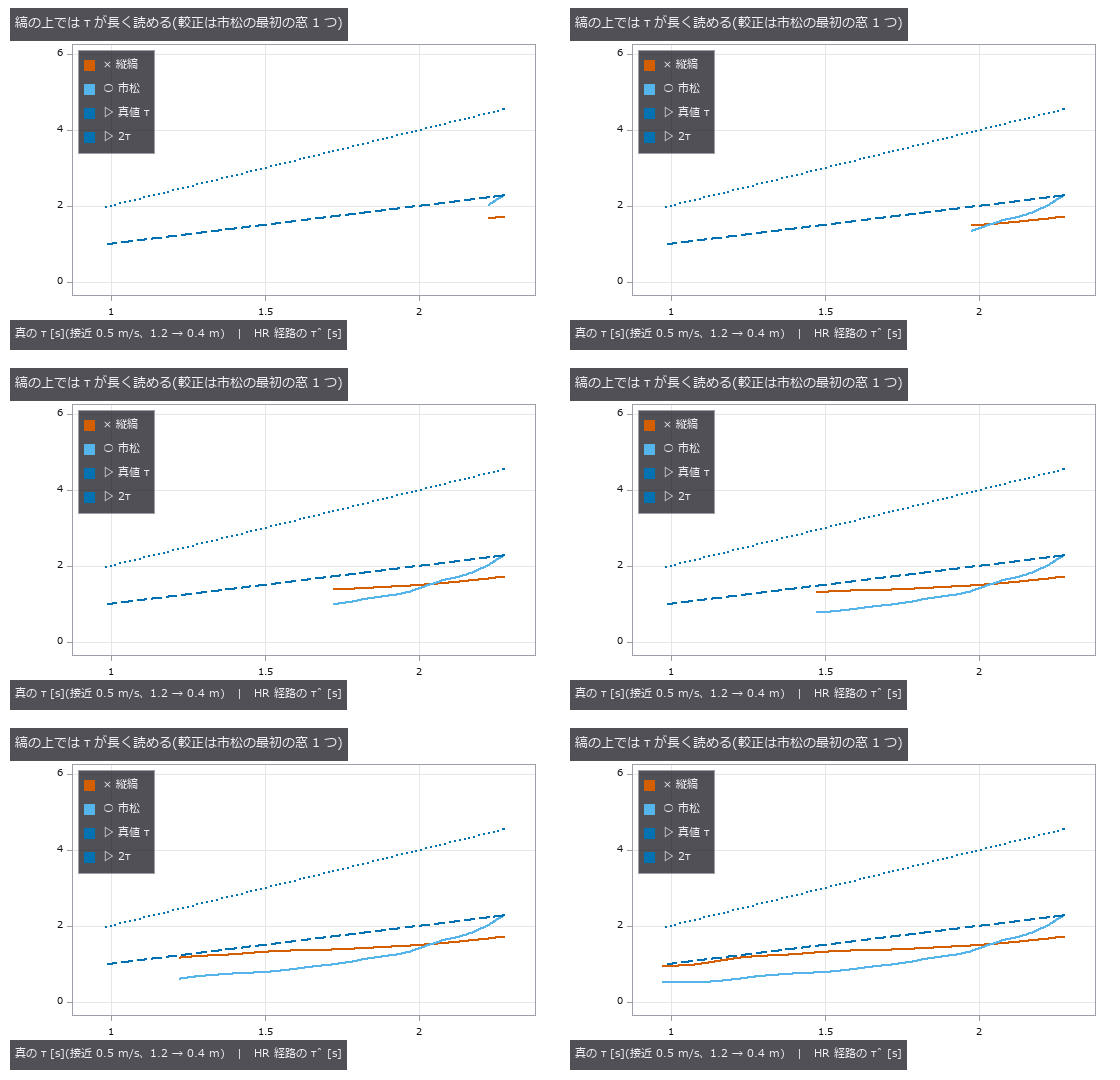
↑ The animation ―― the time-to-contact read by the HR pathway (radial fit of the flow over the eye, one gain calibrated on the first checkerboard window) against the true tau during an approach at 0.5 m/s: over vertical stripes it reads longer than over a checkerboard (median ratio 1.52; the closed-form aperture effect says 2) while the checkerboard itself drifts from tau as the correlator’s phase moves with distance. The 1/f texture is left off the axes: with the same single gain it reads 14 to 28 tau, because its flow energy is a thousandth of the checkerboard’s — a correlator is not a speedometer
py -3.11 examples/poc_zebra_stripes_fly_eye.py
Source: examples/poc_zebra_stripes_fly_eye.py
This run produced 5 figures in total - see them all
Ops used (notes): coherence · fly_emd_response · fly_expansion_readout · fly_flow_from_directions · fly_hex_lattice · fly_t4t5_field · fly_tau_from_expansion · fly_view_plane_texture · fly_vogel_lattice · jitter · lattice_moire_peak · sampling_alias_distance · text_box · traj_tau_dot
No.2026.252 —— Calibrating Pixel-Shift Offsets and Pixel Aperture from the Images — Where Only Stripes Are Seen, the Shift Is Fixed in One Direction Only
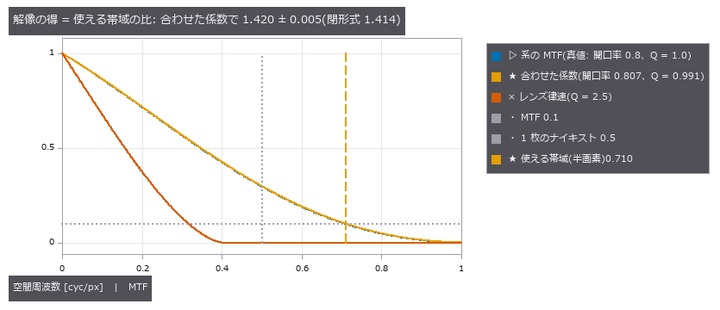
Sim-to-real calibration (simcal) of pixel-shift offsets, pixel aperture and the lens Q = λN/p from the captured frames, refusing numbers that the data cannot fix. The centrepiece is an ‘undetermined map’ of a Siemens star cut into 8-pixel tiles: on the spokes the shift is fixed only along the tangent, the Cramér-Rao ellipses stretch radially, and the ‘determined combination’ simcal returns lies within 2.5 degrees of the closed-form tangent. This chapter found a bug in simcal (the determined combination was divided by the sensitivity column norms instead of multiplied), now fixed with a regression test. Injected ±0.1 px shifts are recovered at the Cramér-Rao bound (Fisher-distance chi-square p = 0.62); a noise model off by 4x fails the same gate (p = 3e-21). A rotated frame fitted by translation only is rejected by the residual PCA and the absolute chi-square gate. With half-pixel shifts the fitted aperture and Q give a resolution gain of 1.420 ± 0.005 (closed form 1.414), and Q = 2.5 is lens-limited with gain 1; a stuck row actuator and a 60 DN dim capture both make it refuse the gain. On real raw frames (PixelShift200, Qian et al., ICCP 2022, CC BY 4.0) the G-to-G diagonal pairs agree tile by tile with phase correlation (paired t-test p = 0.22 / 0.30) and the cross-colour pair is refused (chi-square per dof 31). No training.

↑ Calibrating Pixel-Shift Offsets and Pixel Aperture from the Images — Where Only Stripes Are Seen, the Shift Is Fixed in One Direction Only ―― Sim-to-real calibration (simcal) of pixel-shift offsets, pixel aperture and the lens Q = λN/p from the captured frames, refusing numbers that the data cannot fix. The centrepiece is an ‘undetermined map’ of a Siemens star cut into 8-pixel tiles: on the spokes the shift is fixed only along the tangent, the Cramér-Rao ellipses stretch radially, and the ‘determined combination’ simcal returns lies within 2.5 degrees of the closed-form tangent. This chapter found a bug in simcal (the determined combination was divided by the sensitivity column norms instead of multiplied), now fixed with a regression test. Injected ±0.1 px shifts are recovered at the Cramér-Rao bound (Fisher-distance chi-square p = 0.62); a noise model off by 4x fails the same gate (p = 3e-21). A rotated frame fitted by translation only is rejected by the residual PCA and the absolute chi-square gate. With half-pixel shifts the fitted aperture and Q give a resolution gain of 1.420 ± 0.005 (closed form 1.414), and Q = 2.5 is lens-limited with gain 1; a stuck row actuator and a 60 DN dim capture both make it refuse the gain. On real raw frames (PixelShift200, Qian et al., ICCP 2022, CC BY 4.0) the G-to-G diagonal pairs agree tile by tile with phase correlation (paired t-test p = 0.22 / 0.30) and the cross-colour pair is refused (chi-square per dof 31). No training.

↑ The measurement ―― 【1 章】同じ 4 つのつまみ(フレームのずれ dr・dc・回転・露出)を、縞の向きだけが違う 6 種の被写体で Morris のふるいにかけた。撮れた生の画像(32 × 32 画素を 8 倍、灰色は白の釣り合いを戻した値)と、dr・dc の分類。縦縞では縞に沿った dr が画像を変えず「効かない」、斜めの縞では dr と dc が縞を横切る組(右上がりは dr + dc、右下がりは dr − dc)でしか決まらない —— 開口問題。 (figure labels are in Japanese; the numbers are the same)

↑ 【2 章】3 枚のフレームに dr・dc ∈ ±0.1 px、回転 ±2 mrad、露出 ±2 % を注入し、物理の経路(ポアソン + 読み出し雑音 + 丸め)で撮って合わせた。

↑ 【4 章】3 mrad 回ったフレームを 2 つのモデルで合わせた残差(雑音の標準偏差で割り、5 × 5 で平均、8 倍。
| [](https://raw.githubusercontent.com/furuse-kazufumi/fullseye/master/docs/articles/assets/poc/poc_simcal_pixel_shift/05_resolution_budget.png) |
| *↑ 【5 章】半画素シフト 4 枚(白黒)で、開口率・レンズの Q = λN/p・3 枚のずれを合わせ、pixel_shift_resolution_budget の閉形式( | sinc(f·開口率) | × 回折の MTF)に入れた。* |
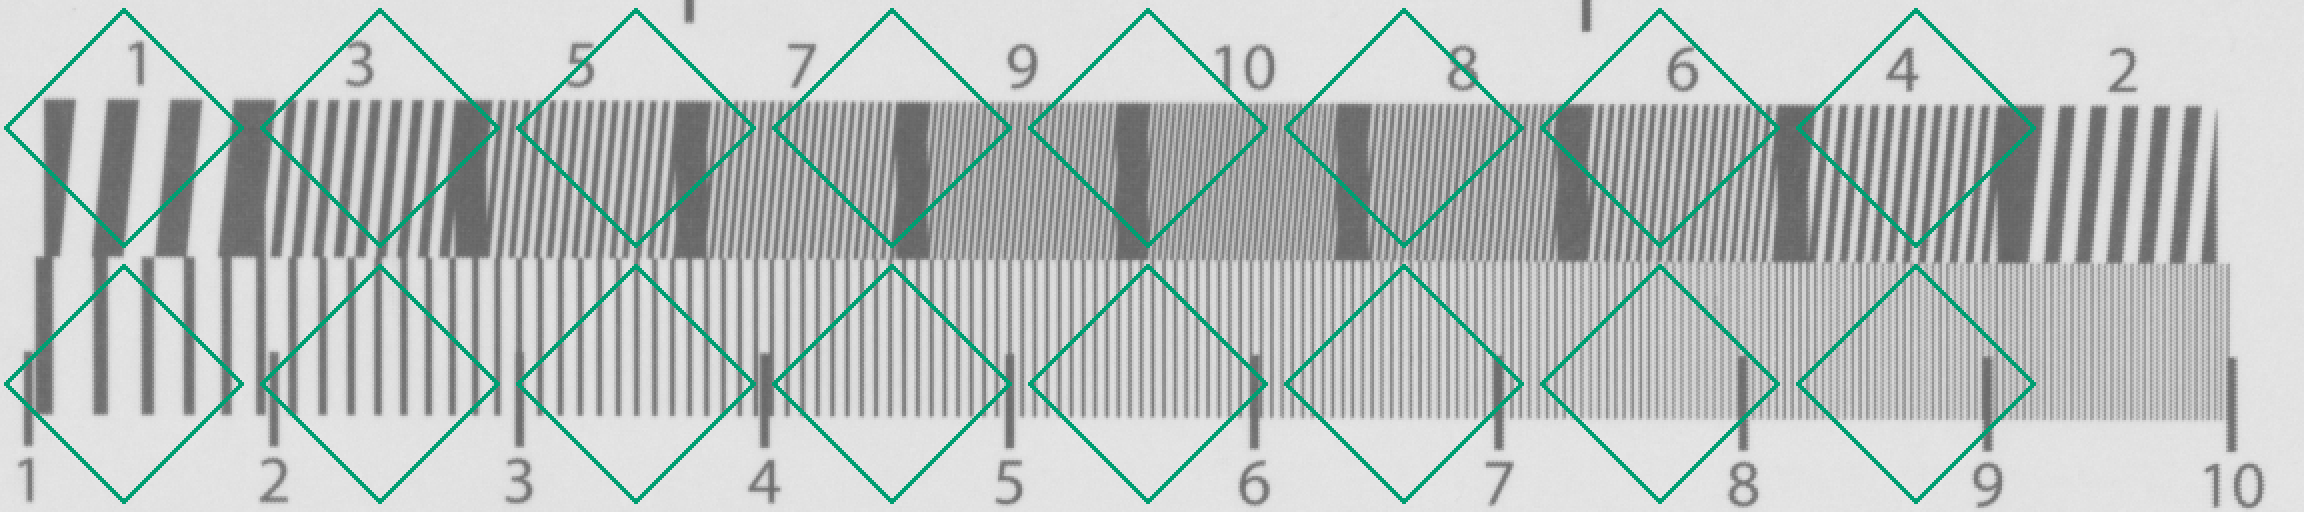
↑ 【実データ】ピクセルシフト 4 枚の未加工 RAW の 1 枚目(白の釣り合いを掛けたモザイクのまま、256 × 1152 画素を 2 倍)。
py -3.11 examples/poc_simcal_pixel_shift.py
Source: examples/poc_simcal_pixel_shift.py
This run produced 6 figures in total - see them all
Ops used (notes): pixel_shift_capture · pixel_shift_merge · pixel_shift_pattern · pixel_shift_resolution_budget · simcal_discrepancy · simcal_fit · simcal_identifiability · simcal_model · simcal_observe · simcal_screen · simcal_simulate · simcal_validate · text_box
No.2026.266 —— Water and Transparent Media — Ocean Waves, Surface Refraction, Colour Under Water and the Caustic of a Bottle, Scored Against Closed Forms, Published Values and Second Implementations
Water is a moving lens seen from above and a colour filter that thickens with distance seen from below. Ten new ops (watermedia, category watermedia of opsoptics): ocean_spectrum (S(omega) of Pierson-Moskowitz and JONSWAP, significant height and period), ocean_height_field (a Tessendorf FFT sea: height, slopes, normals, choppiness, depth), fresnel_water_air (the index of water is the real part of the material table with dispersion; flags total internal reflection), snell_window (window radius and apparent depth), refracted_view (where an underwater point appears, as a stationary point of the optical path: bisection on a flat surface, Newton iteration on a wavy one with the vector Snell law verified and failures returned as NaN), water_attenuation (Pope & Fry pure-water absorption, Smith & Baker scattering, Solonenko & Mobley a, b and Kd of the Jerlov types), underwater_image (Akkaynak & Treibitz image formation: direct signal plus backscatter), phase_function_hg / scattering_phase_petzold (the Petzold volume scattering function) and cylinder_lens_caustic (paraxial focus and real-ray caustic of a cylinder). (1) A Pierson-Moskowitz sea at 8 m/s: significant height 1.3656 m (0.21 U^2/g = 1.3705 m, 0.36 %), peak 1.0753 rad/s (0.877 g/U = 1.0751, 2e-4), JONSWAP with gamma = 1 equals PM to 1e-9, the height is real (imaginary part 3.5e-16), the spatial variance is within 0.02 % of the integral of the spectrum (8 seeds) and a single mode has the period 2 pi / omega to 2.8e-16. Against Cox & Munk (0.003 + 0.00512 U) the slope variance of the resolved waves alone is 11 % at 5 m/s and 16 % at 10 m/s (PM has no capillary waves); carrying the saturation range to the capillary wave number 370 /m gives 98 % (-2.5 %) at 5 m/s but 61 % (-38.7 %) at 10 m/s, kept in the gates as the limit that the constant alpha of PM does not grow with the wind. (2) A checkerboard on the bottom of a 2 m pool: the apparent depth straight above is d / n to 0, the found path satisfies Snell’s law to 7.8e-16, the flat refraction point agrees with the quartic to 1e-15 and with a direct minimisation of the optical path to 2.8e-8, and on a wavy surface the backward ray trace that builds the image returns to the same bottom point within 9.6e-9 m. In a fisheye looking up from under water the total internal reflection starts within one pixel (1.5 degrees) after the critical angle 48.59 degrees. (3) A water-filled bottle (R = 30 mm, n = 1.52, wall 1.5 mm, water 1.333): paraxial focus 61.24 mm, marginal ray 40.01 mm (spherical aberration 21.23 mm); the paraxial focus of a rod matches n R / (2 (n - 1)) and the real-ray focus matches the trigonometric chord to 3.6e-14. The power is 0.01633 /mm filled and -0.00120 /mm empty (ratio 13.6); on a screen 50 mm behind, the centre is 4.88 times the incident light where there is water (peak 13.97) and 0.94 times where the bottle is empty. (4) A colour chart at 1, 5 and 15 m: the Pope & Fry absorption has its minimum 0.00442 /m at 417.5 nm and 0.624 /m at 700 nm (table values), Beer-Lambert agrees with glassmirror to 1.1e-16, a count of 200,000 photons follows the exponential law to 0.2 sigma, Kd at 500 nm is 0.029 < 0.064 < 0.109 < 0.120 (I < II < III < 1C), red decays 12.2 times faster than blue in Jerlov I (transmission over 10 m: red 0.074, green 0.557, blue 0.807) and the R of the red patch at 15 m is 0.010. (5) Limits: the flat-surface apparent depth d / n is wrong the more obliquely one looks (7 % too deep at 30 degrees, 52 % at 60). The probes that break the answer on purpose (an index of 1.4, alpha changed by 10 %, Snell’s law reversed) turn a gate red. No learning, no calibration, 43 gates.
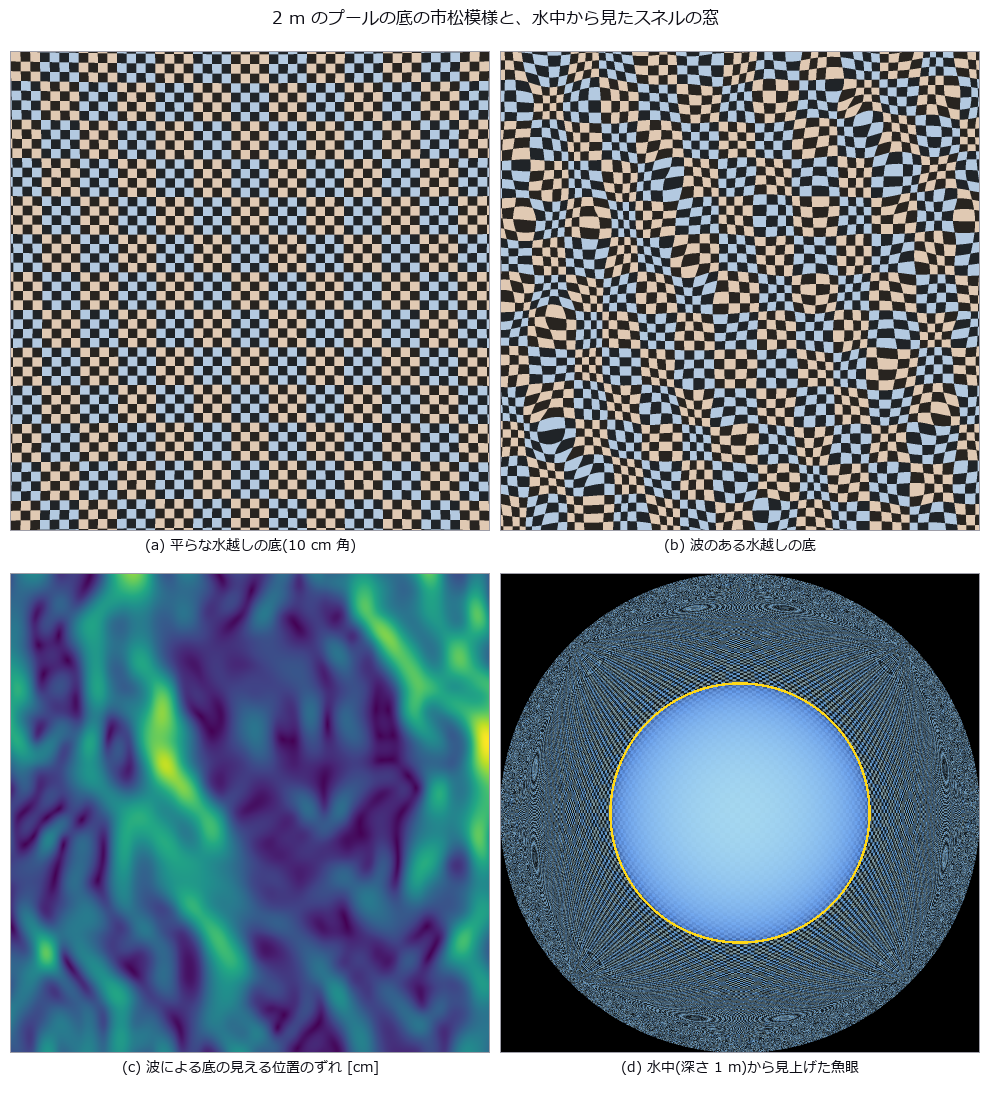
↑ Water and Transparent Media — Ocean Waves, Surface Refraction, Colour Under Water and the Caustic of a Bottle, Scored Against Closed Forms, Published Values and Second Implementations ―― Water is a moving lens seen from above and a colour filter that thickens with distance seen from below. Ten new ops (watermedia, category watermedia of opsoptics): ocean_spectrum (S(omega) of Pierson-Moskowitz and JONSWAP, significant height and period), ocean_height_field (a Tessendorf FFT sea: height, slopes, normals, choppiness, depth), fresnel_water_air (the index of water is the real part of the material table with dispersion; flags total internal reflection), snell_window (window radius and apparent depth), refracted_view (where an underwater point appears, as a stationary point of the optical path: bisection on a flat surface, Newton iteration on a wavy one with the vector Snell law verified and failures returned as NaN), water_attenuation (Pope & Fry pure-water absorption, Smith & Baker scattering, Solonenko & Mobley a, b and Kd of the Jerlov types), underwater_image (Akkaynak & Treibitz image formation: direct signal plus backscatter), phase_function_hg / scattering_phase_petzold (the Petzold volume scattering function) and cylinder_lens_caustic (paraxial focus and real-ray caustic of a cylinder). (1) A Pierson-Moskowitz sea at 8 m/s: significant height 1.3656 m (0.21 U^2/g = 1.3705 m, 0.36 %), peak 1.0753 rad/s (0.877 g/U = 1.0751, 2e-4), JONSWAP with gamma = 1 equals PM to 1e-9, the height is real (imaginary part 3.5e-16), the spatial variance is within 0.02 % of the integral of the spectrum (8 seeds) and a single mode has the period 2 pi / omega to 2.8e-16. Against Cox & Munk (0.003 + 0.00512 U) the slope variance of the resolved waves alone is 11 % at 5 m/s and 16 % at 10 m/s (PM has no capillary waves); carrying the saturation range to the capillary wave number 370 /m gives 98 % (-2.5 %) at 5 m/s but 61 % (-38.7 %) at 10 m/s, kept in the gates as the limit that the constant alpha of PM does not grow with the wind. (2) A checkerboard on the bottom of a 2 m pool: the apparent depth straight above is d / n to 0, the found path satisfies Snell’s law to 7.8e-16, the flat refraction point agrees with the quartic to 1e-15 and with a direct minimisation of the optical path to 2.8e-8, and on a wavy surface the backward ray trace that builds the image returns to the same bottom point within 9.6e-9 m. In a fisheye looking up from under water the total internal reflection starts within one pixel (1.5 degrees) after the critical angle 48.59 degrees. (3) A water-filled bottle (R = 30 mm, n = 1.52, wall 1.5 mm, water 1.333): paraxial focus 61.24 mm, marginal ray 40.01 mm (spherical aberration 21.23 mm); the paraxial focus of a rod matches n R / (2 (n - 1)) and the real-ray focus matches the trigonometric chord to 3.6e-14. The power is 0.01633 /mm filled and -0.00120 /mm empty (ratio 13.6); on a screen 50 mm behind, the centre is 4.88 times the incident light where there is water (peak 13.97) and 0.94 times where the bottle is empty. (4) A colour chart at 1, 5 and 15 m: the Pope & Fry absorption has its minimum 0.00442 /m at 417.5 nm and 0.624 /m at 700 nm (table values), Beer-Lambert agrees with glassmirror to 1.1e-16, a count of 200,000 photons follows the exponential law to 0.2 sigma, Kd at 500 nm is 0.029 < 0.064 < 0.109 < 0.120 (I < II < III < 1C), red decays 12.2 times faster than blue in Jerlov I (transmission over 10 m: red 0.074, green 0.557, blue 0.807) and the R of the red patch at 15 m is 0.010. (5) Limits: the flat-surface apparent depth d / n is wrong the more obliquely one looks (7 % too deep at 30 degrees, 52 % at 60). The probes that break the answer on purpose (an index of 1.4, alpha changed by 10 %, Snell’s law reversed) turn a gate red. No learning, no calibration, 43 gates.
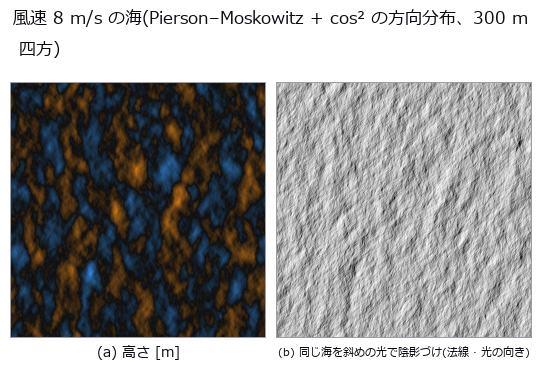
↑ The measurement ―― Tessendorf の FFT。有義波高 1.37 m、周期 5.8 s。波は +x(右)へ進む。 (figure labels are in Japanese; the numbers are the same)
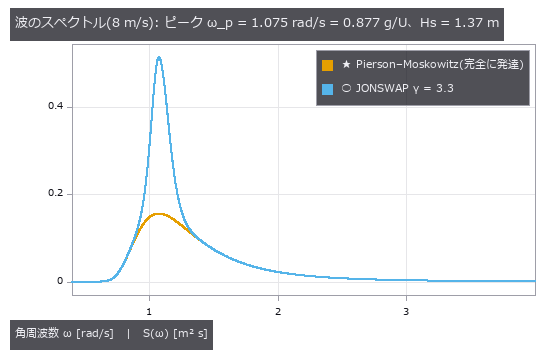
↑ JONSWAP はピークを γ 倍に尖らせる。
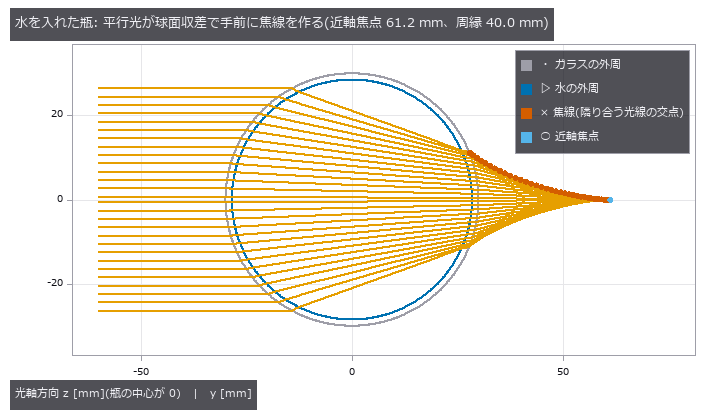
↑ 空の瓶はほとんど曲げない(屈折力は水入りの 1/14)。
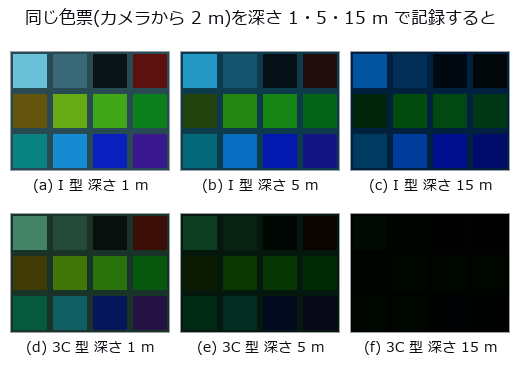
↑ 上: 外洋(ジャーロフ I)、下: 沿岸(3C)。
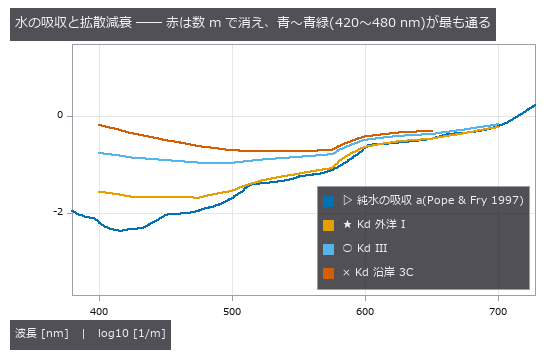
↑ 純水の吸収の最小は 417.5 nm の 0.00442 /m、700 nm で 0.624 /m。
↑ The animation ―― 同じFFT海面の時刻を進めると波面が風下へ動く。
py -3.11 examples/poc_water_transparent_media.py
Source: examples/poc_water_transparent_media.py
This run produced 20 figures in total - see them all
Ops used (notes): beer_lambert_transmittance · cylinder_lens_caustic · fresnel_water_air · ocean_height_field · ocean_spectrum · phase_function_hg · refract_rays · refracted_view · scattering_phase_petzold · snell_window · underwater_image · water_attenuation
No.2026.268 —— How Water Looks in Inspection Images — Pool-Floor Caustics, a Bottle from the Side, a Wet Plate and a Hull Under Water, Scored Against Closed Forms and Second Methods
Water changes what an inspection camera records in four ways: a wavy surface lays a bright web of caustics over the pattern on the floor, a bottle with liquid is a cylindrical lens, a wet surface is darker and glossier, and in murky water a lamp beside the lens makes a veil of backscatter. Seven new ops (watervision, category watervision of opsoptics): caustic_irradiance (the irradiance on a floor by a photon count and by the Jacobian of the surface-to-floor map), bottle_image (a side view of a bottle ray-cast in the horizontal section of every row, backlit or frontlit, with bubbles and a meniscus), fill_level_from_image (the fill line read back from the image), wet_surface_appearance (the Lekner and Dorf wet surface), wet_dry_inspection_pair (one plate rendered dry and wet, with the defect contrast), underwater_inspection_image (a hull seen with a lamp at the camera, and the per-pixel SNR) and caustic_floor_segmentation (the caustic lines as a mask). (1) Pool floor: a flat surface gives a uniform cos(theta) T to 1e-9, the photon total equals the incident beam times the mean transmittance to 1e-6 (periodic wrap), the photon count and the Jacobian agree to 0.30 % relative RMS on a smooth surface, at the folds (66 pixels on a surface of 0.2 m waves) the wavefront method returns inf and a flag while the photons count a finite value 5.0 times the mean, and doubling the ray density changes the result by 0.85 %. The crack detector (the registry’s canny) fires on the edges of the caustics at 3 m/s and its precision falls to 0.05 (1.00 on a plate without them); removing the edges with the caustic segmentation brings it back to 1.00 (recall 1.00 to 0.45). At 6 m/s the relative threshold loses to the gradient of the caustic edges (recall 0.15), masking does not bring the crack back (0.00), and dividing by the irradiance does (1.00 / 1.00). (2) Bottle (R = 30 mm, n = 1.52, water 1.333): rows above and below the line are bit identical to the empty and the full section, the central brightness ratio 1.0816 matches the ratio of the Fresnel transmittance products of the four interfaces to 1e-9, the half width of the lit band of the filled section is 9.50 mm (9.91 mm predicted from the paraxial focus of 62.13 mm, -4.1 %), the fill line is within 1 pixel for five fills and two lights (difference 0), and the outer diameter of the dark ring of a bubble is 54 pixels (53.3 from the paraxial 2 x 2 matrix, magnification 1.333). (3) Wet surface: a film of 0 leaves the albedo unchanged, the closed form agrees with an independent quadrature to 1.1e-16, wet over dry is 0.673 at a = 0.5, the diffuse contrast of a scratch goes from 0.411 to 0.494 (0.494 predicted), the total from 0.449 to 0.558, and the glint pixels from 361 to 127. (4) Hull (1, 3 and 6 m, Jerlov I and 3C): the SNR falls monotonically with distance, pure water as the distance tends to 0 equals the clear-water case to 2.7e-11, and the veil in the centre is about 5 times that in the corner. (5) Limit: the bottle is traced section by section and ignores the vertical tilt of the rays; at a tilt of 40 degrees the half width of the band moves by 29 % (a vertical cylinder is exact with effective indices, a shoulder is not covered). No learning, no calibration, 39 gates.
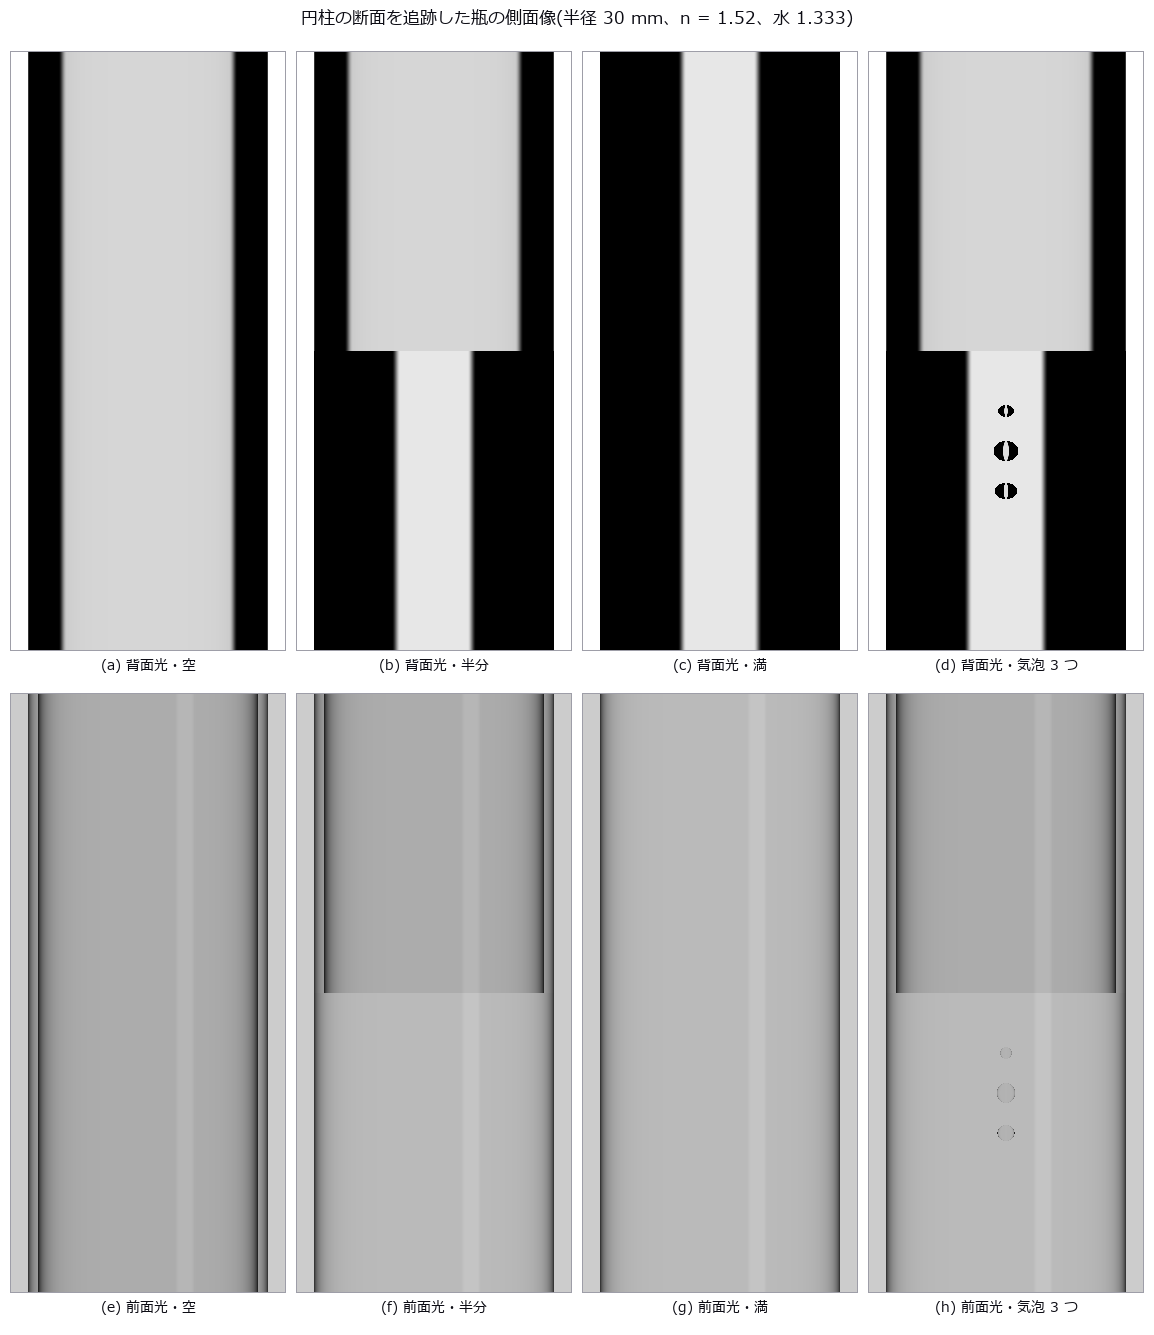
↑ How Water Looks in Inspection Images — Pool-Floor Caustics, a Bottle from the Side, a Wet Plate and a Hull Under Water, Scored Against Closed Forms and Second Methods ―― Water changes what an inspection camera records in four ways: a wavy surface lays a bright web of caustics over the pattern on the floor, a bottle with liquid is a cylindrical lens, a wet surface is darker and glossier, and in murky water a lamp beside the lens makes a veil of backscatter. Seven new ops (watervision, category watervision of opsoptics): caustic_irradiance (the irradiance on a floor by a photon count and by the Jacobian of the surface-to-floor map), bottle_image (a side view of a bottle ray-cast in the horizontal section of every row, backlit or frontlit, with bubbles and a meniscus), fill_level_from_image (the fill line read back from the image), wet_surface_appearance (the Lekner and Dorf wet surface), wet_dry_inspection_pair (one plate rendered dry and wet, with the defect contrast), underwater_inspection_image (a hull seen with a lamp at the camera, and the per-pixel SNR) and caustic_floor_segmentation (the caustic lines as a mask). (1) Pool floor: a flat surface gives a uniform cos(theta) T to 1e-9, the photon total equals the incident beam times the mean transmittance to 1e-6 (periodic wrap), the photon count and the Jacobian agree to 0.30 % relative RMS on a smooth surface, at the folds (66 pixels on a surface of 0.2 m waves) the wavefront method returns inf and a flag while the photons count a finite value 5.0 times the mean, and doubling the ray density changes the result by 0.85 %. The crack detector (the registry’s canny) fires on the edges of the caustics at 3 m/s and its precision falls to 0.05 (1.00 on a plate without them); removing the edges with the caustic segmentation brings it back to 1.00 (recall 1.00 to 0.45). At 6 m/s the relative threshold loses to the gradient of the caustic edges (recall 0.15), masking does not bring the crack back (0.00), and dividing by the irradiance does (1.00 / 1.00). (2) Bottle (R = 30 mm, n = 1.52, water 1.333): rows above and below the line are bit identical to the empty and the full section, the central brightness ratio 1.0816 matches the ratio of the Fresnel transmittance products of the four interfaces to 1e-9, the half width of the lit band of the filled section is 9.50 mm (9.91 mm predicted from the paraxial focus of 62.13 mm, -4.1 %), the fill line is within 1 pixel for five fills and two lights (difference 0), and the outer diameter of the dark ring of a bubble is 54 pixels (53.3 from the paraxial 2 x 2 matrix, magnification 1.333). (3) Wet surface: a film of 0 leaves the albedo unchanged, the closed form agrees with an independent quadrature to 1.1e-16, wet over dry is 0.673 at a = 0.5, the diffuse contrast of a scratch goes from 0.411 to 0.494 (0.494 predicted), the total from 0.449 to 0.558, and the glint pixels from 361 to 127. (4) Hull (1, 3 and 6 m, Jerlov I and 3C): the SNR falls monotonically with distance, pure water as the distance tends to 0 equals the clear-water case to 2.7e-11, and the veil in the centre is about 5 times that in the corner. (5) Limit: the bottle is traced section by section and ignores the vertical tilt of the rays; at a tilt of 40 degrees the half width of the band moves by 29 % (a vertical cylinder is exact with effective indices, a shoulder is not covered). No learning, no calibration, 39 gates.
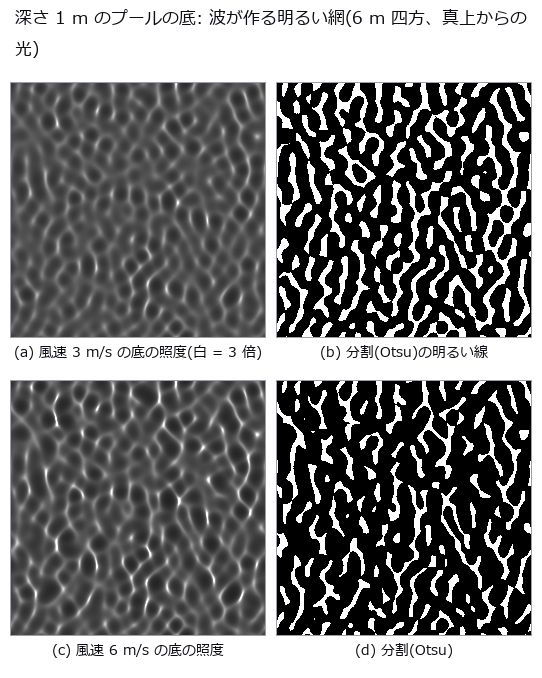
↑ The measurement ―― 照度の最大 3.0 倍(3 m/s)・7.7 倍(6 m/s)。分割は床の 29 %・21 %。傾きの RMS は手で 0.06・0.10 に合わせた。 (figure labels are in Japanese; the numbers are the same)

↑ 上: 3 m/s は分割で縁を除くと適合率が戻る。
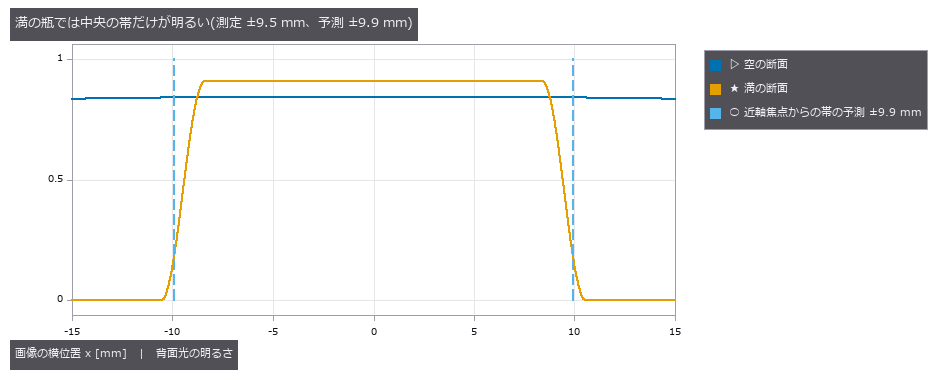
↑ 空の瓶は縁近くまで明るい。

↑ 全体のコントラスト 0.449 → 0.558。
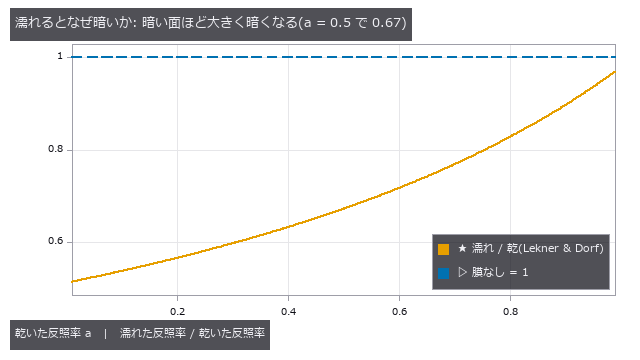
↑ 内部反射 r = 0.476 の水–空気界面が光を膜に閉じ込め、基板に吸わせる。
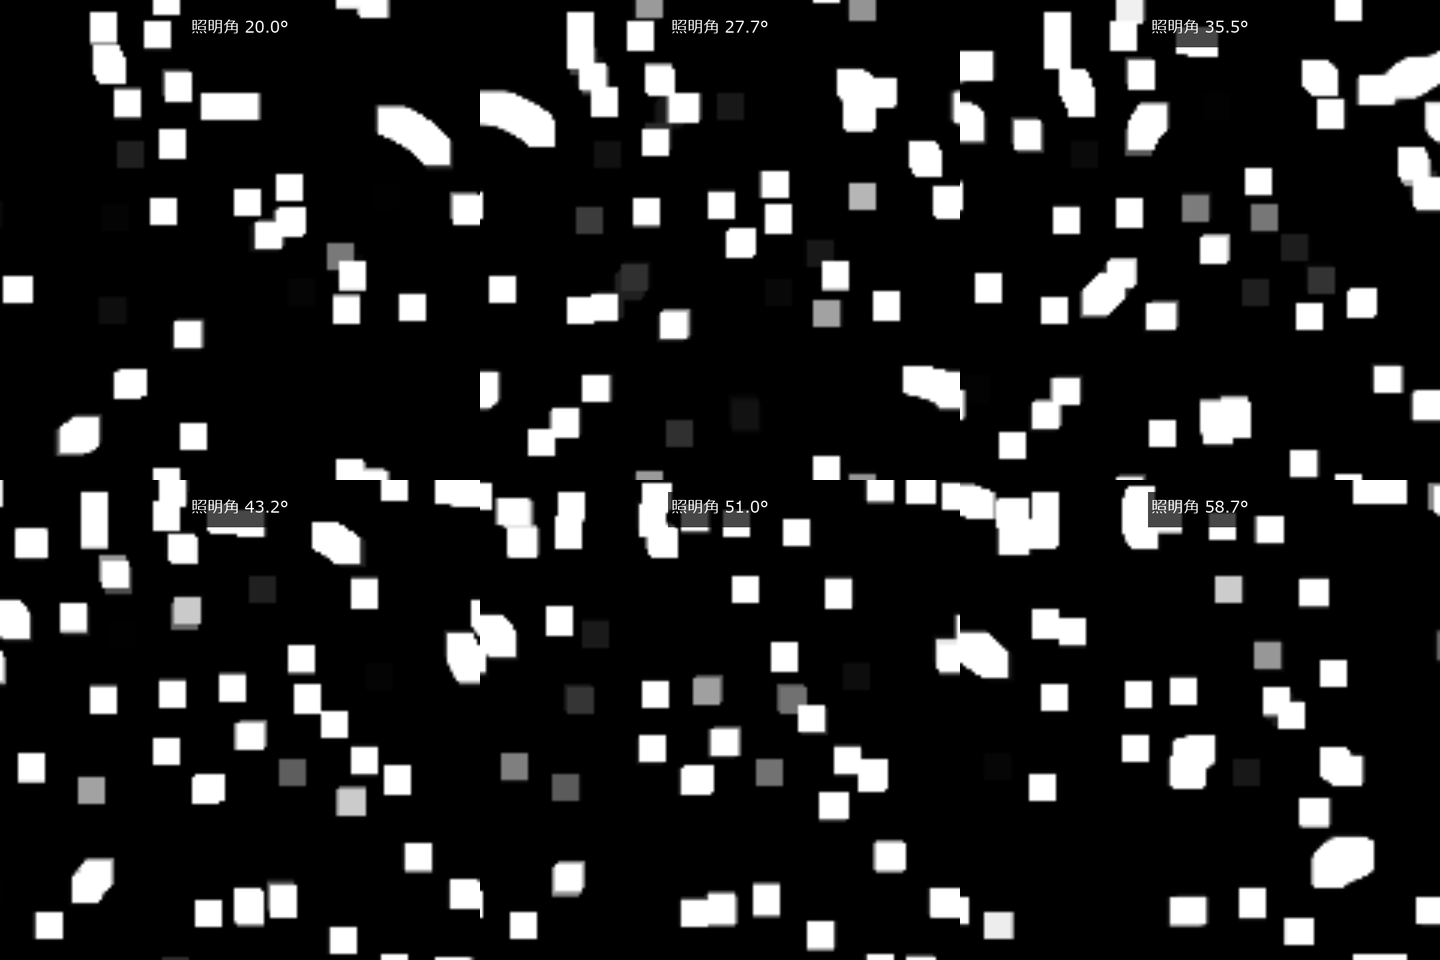
↑ The animation ―― 照明角を動かすと濡れた板のてかりが移動する。
py -3.11 examples/poc_water_inspection_images.py
Source: examples/poc_water_inspection_images.py
This run produced 16 figures in total - see them all
Ops used (notes): bottle_image · canny · caustic_floor_segmentation · caustic_irradiance · fill_level_from_image · fresnel_water_air · ocean_height_field · otsu · underwater_inspection_image · water_attenuation · wet_dry_inspection_pair · wet_surface_appearance
No.2026.269 —— Photographing a 3-D Scene Through the Actual Lens Prescription — Depth of Field, Cat’s-Eye Bokeh, Corner Illumination, Colour Fringes and Ghosts, Scored Against Closed Forms, Existing Ops and an Independent Trace
A lens-design screen reports spot diagrams and MTF (modulation transfer function) numbers but not what the prescription records when it photographs a document one metre away. The exit pupil is sampled from the sensor, every ray is traced backwards through the whole prescription (Kolb, Mitchell & Hanrahan 1995), the scene is shaded in object space, and photons, shot noise, read noise and quantisation follow. Eight new ops (lensrender, category lensrender of opsoptics): lens_scene (validated planes, spheres, meshes and lights), exit_pupil_samples, trace_sensor_rays (sensor, pupil, every surface backwards; vignetted and totally reflected rays are NaN and flagged), scene_radiance (Lambertian plus Blinn-Phong plus shadows), render_scene_through_lens (irradiance, electrons, noise, image), bokeh_shape (the cat’s eye), render_ghost_overlay (two-reflection ghosts) and render_compare_prescriptions (a quality table per prescription). (1) The backward trace is the reverse of ray_bundle (entrance point 8.7e-15 mm, direction 4.2e-16); a white plane through an ideal lens gives pi L sin^2(alpha) to 2e-6 relative, a point source lands on one pixel with the photon count I Omega t QE lambda/hc to 1e-6, the 15 checkerboard edges follow distortion_map to 0.096 px (the distortion is 5.2 px at the outer edge) and the lateral colour at 0.7 field follows chromatic_shift to 0.08 px. (2) Two triplets of the same EFL and F-number (one with its radii detuned by 1.5 times 7 to 10 %) photograph a resolution chart at 1 m: the on-axis RMS spot is 10.7 and 53.4 um (5.0 times), the 10-90 % edge rise 4.6 and 15.4 px, MTF50 0.116 and 0.053 cyc/px, in the order of spot_stats. (3) The bokeh of a point at 0.5 m through an ideal lens is the thin-lens circle of confusion to 0.31 %, and F/8 is 0.349 times F/2.8 (2.8/8 = 0.350). With a round baffle 20 mm behind an ideal lens the cat’s-eye area ratio agrees with the closed form for the overlap of two discs, 0.635, to 1.6 % (hull 0.625, rendered 0.639, pupil pass 0.636) and is symmetric about the meridional plane to 3.6e-15 mm. At the corner of the triplet field curvature makes the blur disc itself 1.3 times larger, so its area ratio does not equal the pupil pass (stated). (4) The relative illumination of a white plane follows lensimage to 1.61 % up to 0.7 field and differs by 3.2 % at 8.7 degrees (object-side against image-side cos^4); a singlet with the stop in front gives a -6.6 % barrel grid. (5) The energy ratios of 15 ghosts equal the closed form r^2 (1-r)^(2(j-i)-2) to 4.4e-16, the centroids agree with ghost_analysis to 8e-4 px and a reflectance of 0 gives an overlay of exactly 0. (6) The contrast of a 0.2 mm scratch (10.4 um on the sensor) is 0.547 through the good lens and 0.261 (48 %) through the detuned one, against 0.542 and 0.261 from an independent prediction (forward-traced spot convolved with the line). (7) Honest limit: geometric optics has no diffraction, so the point image of the good lens stopped down to F/11 is drawn at 0.32 times the Airy disc (at F/6.25, aberration-limited, it is 2.7 times). (8) Break-it probes (reversed index ratio, aperture radius off by 10 %, focus moved to 1.5 m) turn the gates red. Learning 0, calibration 0, 30 gates.

↑ Photographing a 3-D Scene Through the Actual Lens Prescription — Depth of Field, Cat’s-Eye Bokeh, Corner Illumination, Colour Fringes and Ghosts, Scored Against Closed Forms, Existing Ops and an Independent Trace ―― A lens-design screen reports spot diagrams and MTF (modulation transfer function) numbers but not what the prescription records when it photographs a document one metre away. The exit pupil is sampled from the sensor, every ray is traced backwards through the whole prescription (Kolb, Mitchell & Hanrahan 1995), the scene is shaded in object space, and photons, shot noise, read noise and quantisation follow. Eight new ops (lensrender, category lensrender of opsoptics): lens_scene (validated planes, spheres, meshes and lights), exit_pupil_samples, trace_sensor_rays (sensor, pupil, every surface backwards; vignetted and totally reflected rays are NaN and flagged), scene_radiance (Lambertian plus Blinn-Phong plus shadows), render_scene_through_lens (irradiance, electrons, noise, image), bokeh_shape (the cat’s eye), render_ghost_overlay (two-reflection ghosts) and render_compare_prescriptions (a quality table per prescription). (1) The backward trace is the reverse of ray_bundle (entrance point 8.7e-15 mm, direction 4.2e-16); a white plane through an ideal lens gives pi L sin^2(alpha) to 2e-6 relative, a point source lands on one pixel with the photon count I Omega t QE lambda/hc to 1e-6, the 15 checkerboard edges follow distortion_map to 0.096 px (the distortion is 5.2 px at the outer edge) and the lateral colour at 0.7 field follows chromatic_shift to 0.08 px. (2) Two triplets of the same EFL and F-number (one with its radii detuned by 1.5 times 7 to 10 %) photograph a resolution chart at 1 m: the on-axis RMS spot is 10.7 and 53.4 um (5.0 times), the 10-90 % edge rise 4.6 and 15.4 px, MTF50 0.116 and 0.053 cyc/px, in the order of spot_stats. (3) The bokeh of a point at 0.5 m through an ideal lens is the thin-lens circle of confusion to 0.31 %, and F/8 is 0.349 times F/2.8 (2.8/8 = 0.350). With a round baffle 20 mm behind an ideal lens the cat’s-eye area ratio agrees with the closed form for the overlap of two discs, 0.635, to 1.6 % (hull 0.625, rendered 0.639, pupil pass 0.636) and is symmetric about the meridional plane to 3.6e-15 mm. At the corner of the triplet field curvature makes the blur disc itself 1.3 times larger, so its area ratio does not equal the pupil pass (stated). (4) The relative illumination of a white plane follows lensimage to 1.61 % up to 0.7 field and differs by 3.2 % at 8.7 degrees (object-side against image-side cos^4); a singlet with the stop in front gives a -6.6 % barrel grid. (5) The energy ratios of 15 ghosts equal the closed form r^2 (1-r)^(2(j-i)-2) to 4.4e-16, the centroids agree with ghost_analysis to 8e-4 px and a reflectance of 0 gives an overlay of exactly 0. (6) The contrast of a 0.2 mm scratch (10.4 um on the sensor) is 0.547 through the good lens and 0.261 (48 %) through the detuned one, against 0.542 and 0.261 from an independent prediction (forward-traced spot convolved with the line). (7) Honest limit: geometric optics has no diffraction, so the point image of the good lens stopped down to F/11 is drawn at 0.32 times the Airy disc (at F/6.25, aberration-limited, it is 2.7 times). (8) Break-it probes (reversed index ratio, aperture radius off by 10 %, focus moved to 1.5 m) turn the gates red. Learning 0, calibration 0, 30 gates.
Terms: MTF — The magnitude of the optical transfer function, showing how image contrast is transferred at each spatial frequency.
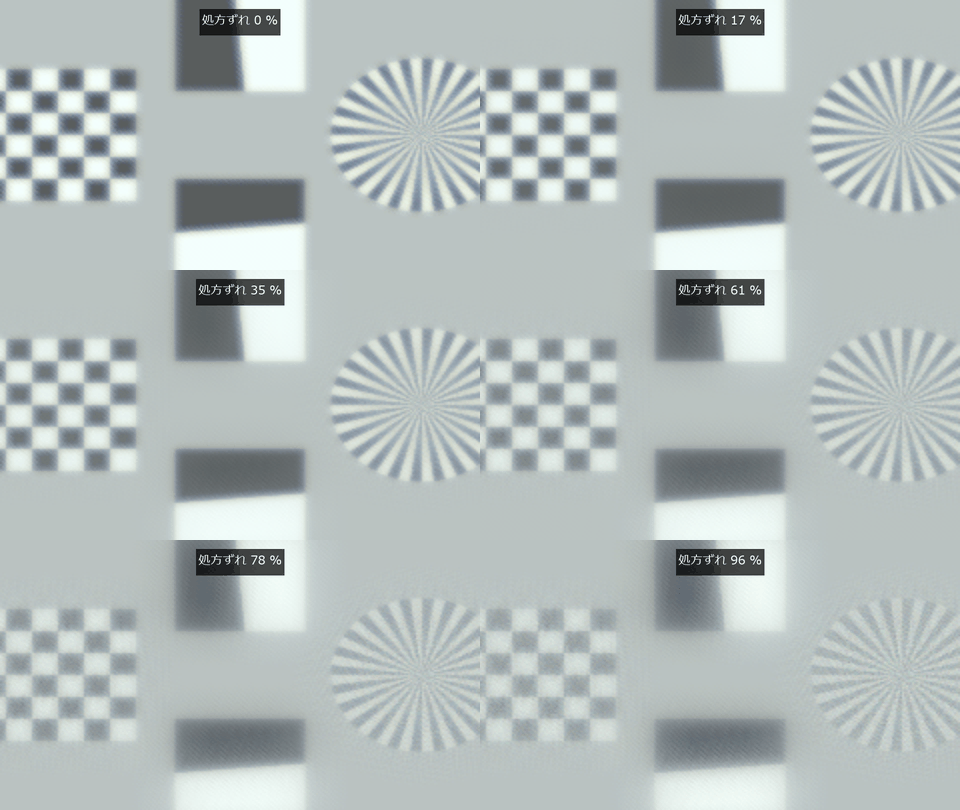
↑ The measurement ―― 同じチャートを良好な処方からずらした処方へ連続的に比較する。 (figure labels are in Japanese; the numbers are the same)

↑ RMS スポットは raytrace.spot_stats、光量は lensimage、刃は edgesfr で同じ絵から測った。
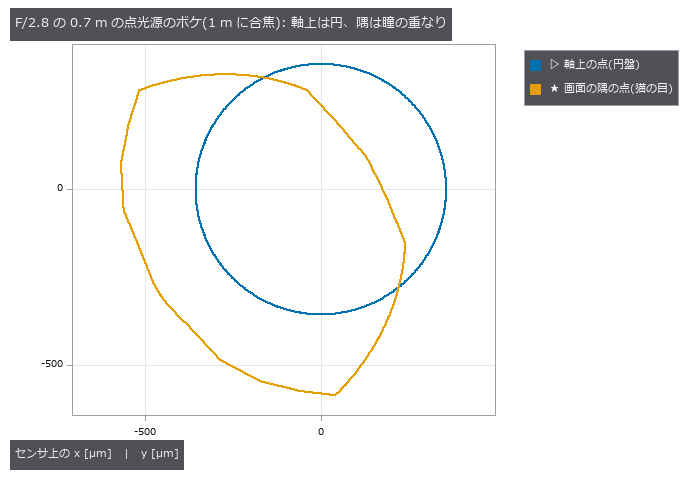
↑ 遮光筒が隅の斜めの光束を削り、瞳の通過率は 90 %(形は円から外れる)。

↑ 絞りを前に置いた単玉(樽型 -6.6 %)で撮った 30 mm 格子の絵。
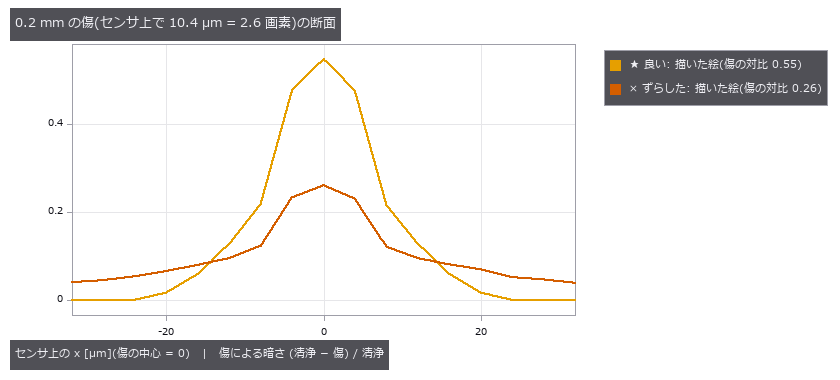
↑ 良い三枚玉では傷の中心の画素が 55 % 暗くなるが、ずらした方では 26 % しか暗くならず、周りの画素と区別がつきにくい。
py -3.11 examples/poc_photograph_through_prescription.py
Source: examples/poc_photograph_through_prescription.py
This run produced 22 figures in total - see them all
Ops used (notes): bokeh_shape · chief_ray · chromatic_shift · depth_of_field · distortion_map · exit_pupil_samples · ghost_analysis · lens_scene · lens_system · noncoaxial_system · paraxial_trace · ray_bundle · relative_illumination · render_compare_prescriptions · render_ghost_overlay · render_scene_through_lens · spot_stats · trace_sensor_rays · with_wavelength
The Time-as-3-D Wing — A Video Is One Volume
Treat a 2-D video as one (t, y, x) volume and the 3-D ops — connected components, isosurfaces, region properties — work along time unchanged. Merging colonies become a Y in space-time, passing vehicles become bands in a (t, x) image, a wavefront’s arrival time becomes an isosurface. The 21 exhibits here demonstrate exactly that.
The time axis also brings its own traps. Rounding onto the frame grid always delays; pixel area makes merging look early. Mislinks come in two opposite kinds, so a single error rate cannot say which way the diffusion coefficient is wrong. Template tracking drifts quietly before it ever loses the target, and all 152 drifted frames report ‘found’.
The motion-magnification exhibit carries the most candid conclusion in the room: exact to machine precision up to a magnification of 200, and of no help for measurement. Magnification is a tool for showing people, not for measuring.
No.2026.055 —— Modal identification from video — frequency survives to the end, damping lies first
A correct vibration frequency in video does not ensure correct damping. Noise and lighting flicker were added to a freely decaying cantilever; modal frequencies stayed within 0.06 Hz. At low amplitude, damping fails before frequency and varies with the estimator used on the same time series.
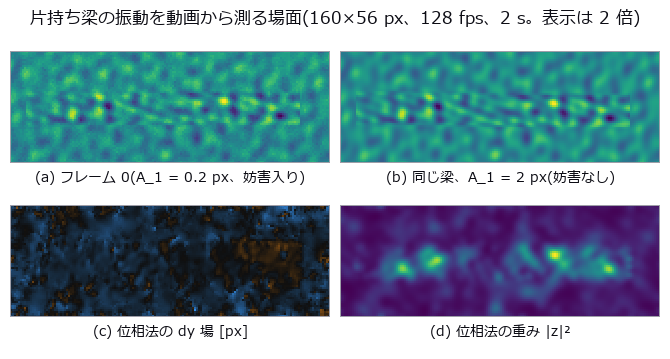
↑ Modal identification from video — frequency survives to the end, damping lies first ―― A cantilever beam (closed-form Euler–Bernoulli modes) decaying freely in three modes is rendered into video with sensor noise, 100 Hz lighting flicker, camera shake and rolling shutter, then identified with phase-based displacement (phase_displacement) and PIV (piv_cross_correlate). All three natural frequencies come out within 0.06 Hz, but the damping ratio of mode 1 from the very same series is 0.0778 (half-power), 0.0188 (envelope) or 0.0181 (fit) against a true 0.02. Sweeping the amplitude from 0.02 to 2 px, the quantities break in the order f → ζ → MAC_2 → MAC_3: at 0.02 px the phase method still has f_1 within +0.030 Hz while ζ_1 is 0.23 of the truth. At 48.5 fps the flicker alias lands exactly on f_1 = 3.00 Hz; a single-pixel brightness zero-point cannot report ζ at all, while the phase method survives at 0.0191.
Terms: PIV — A flow-measurement method that estimates a velocity field from the displacement of particle patterns between images separated by a short time.
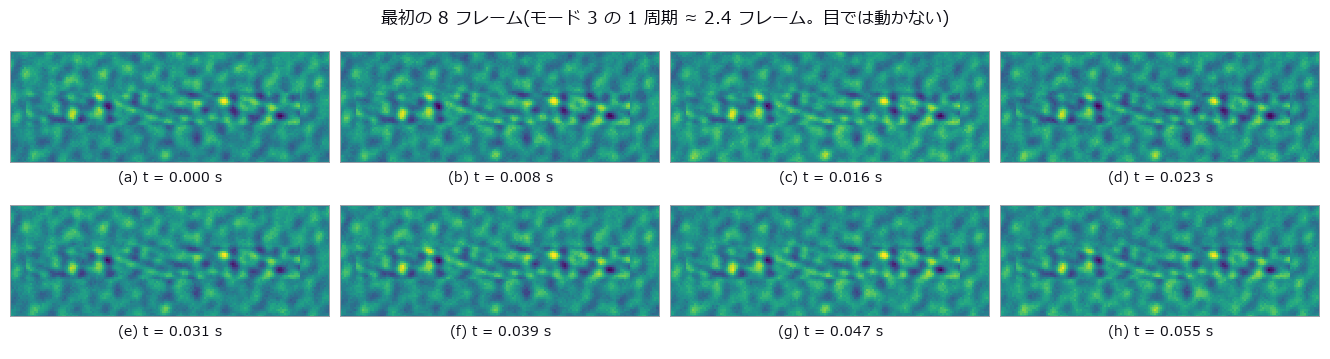
↑ The measurement (figure labels are in Japanese; the numbers are the same)

↑ この回の図

↑ この回の図
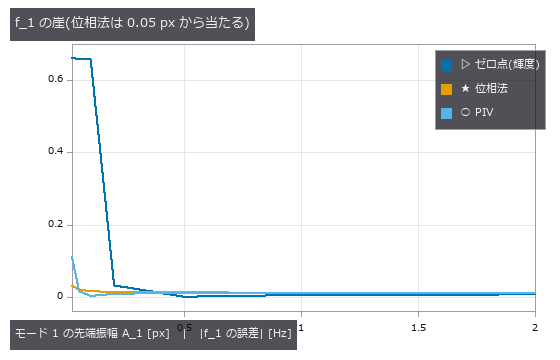
↑ この回の図
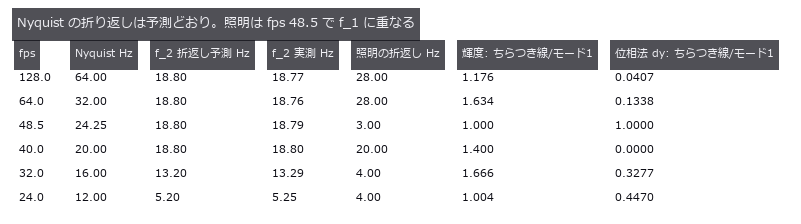
↑ この回の図
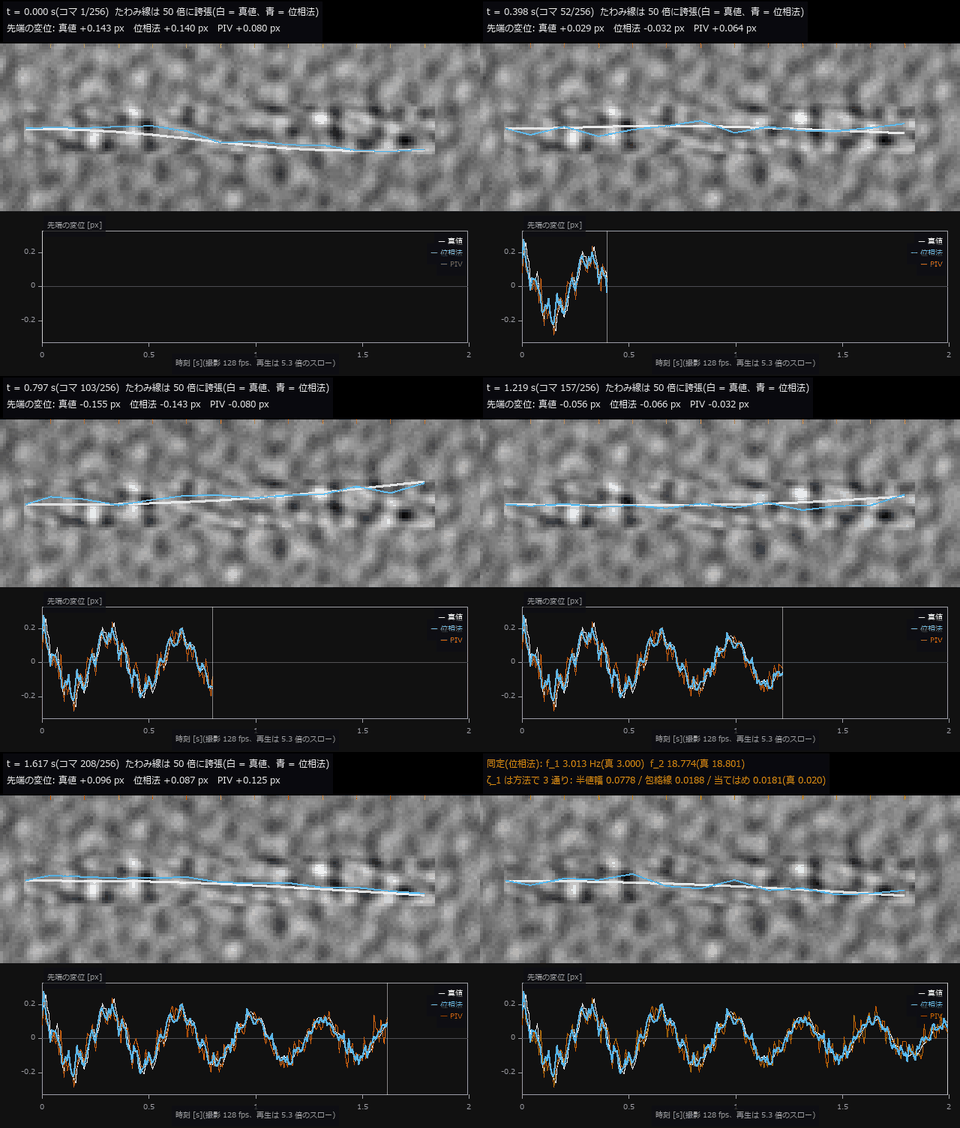
↑ The animation ―― 動画(640 × 502、24 fps、292 コマ): 片持ち梁の自由減衰(A_1 = 0.2 px、雑音・照明ちらつき・手ぶれ・ローリングシャッター入り、撮影 128 fps を 5.3 倍のスローで再生)。画面のままでは梁は動いて見えないので、12 測点のたわみを 50 倍に誇張して重ねた(白 = 真値、青 = 位相法の測定)。下段は先端の変位が時刻とともに伸びる(白 = 真値、青 = 位相法、朱 = PIV)。最後のコマが同定結果: f_1 は 3.013 Hz(真 3.000)と当たるが、同じ時系列から出した ζ_1 は 半値幅 0.0778 / 包絡線 0.0188 / 当てはめ 0.0181(真 0.020)と方法で 3 通りに割れる。
py -3.11 examples/poc_beam_modal_video.py
Source: examples/poc_beam_modal_video.py
This run produced 14 figures in total - see them all
Ops used (notes): axes_frame · axes_transform · data_to_pixel · envelope · phase_displacement · piv_cross_correlate · temporal_bandpass · text_box · ticks
No.2026.060 —— The Cold-Chain Temperature Record — Where You Taped the Logger Is the Verdict
The question is whether one temperature record represents every product in a cold load. Product loggers were moved through a field with wall heat and door openings; 82.4 % of placements missed failing goods. Wall heat creates false passes, whereas short door pulses warm air but not product and reverse the error.
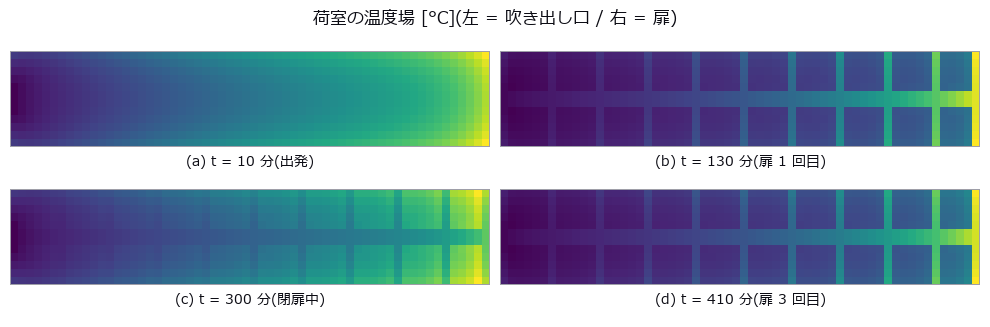
↑ The Cold-Chain Temperature Record — Where You Taped the Logger Is the Verdict ―― Twelve hours of a 12.0 m x 2.4 m reefer hold, built as a single (t, y, x) volume of 720 min x 60 x 12 cells with known closed-form physics: distance from the supply vent, infiltration from each of the four walls, five door-opening pulses, and first-order thermal lag (5 min for air, 64-91 min for product). 108 of 490 product cells (22.0 %) truly fail, yet a single logger taped in the product reports PASS for 82.4 % of the placements. Turning the causes off one at a time separates the failure modes: walls alone give 95.5 % false passes and 0.0 % false alarms, while walls off and doors on drop true failures to 2.0 % but raise false alarms to 3.5 % — and a logger in the product then passes 100 % of the time, because short pulses never enter the product. The cliffs can be predicted on paper: the time-constant cliff measured at 19-138 min matches a two-stage (hold air + logger) model within 18 % relative, and the sampling-interval and 0.5 K quantisation cliffs match their predictions exactly. Converted to “minutes allowed at 12 °C”, the three metrics computed from the same record differ by 4.6x (60 / 276 / 197 min) and disagree on the verdict at 82 of 720 placements (11.4 %).
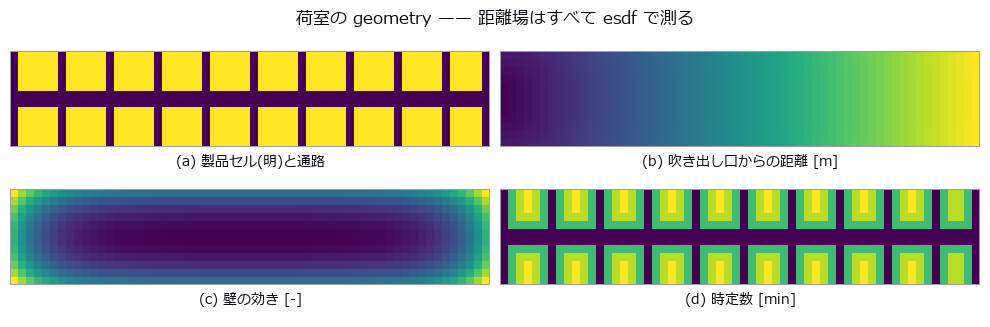
↑ The measurement (figure labels are in Japanese; the numbers are the same)
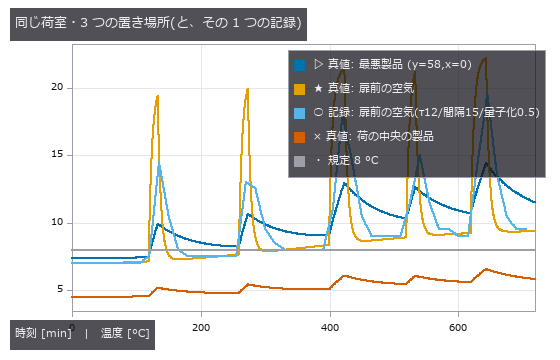
↑ 扉前の空気は跳ねるが製品には届かない。

↑ この回の図
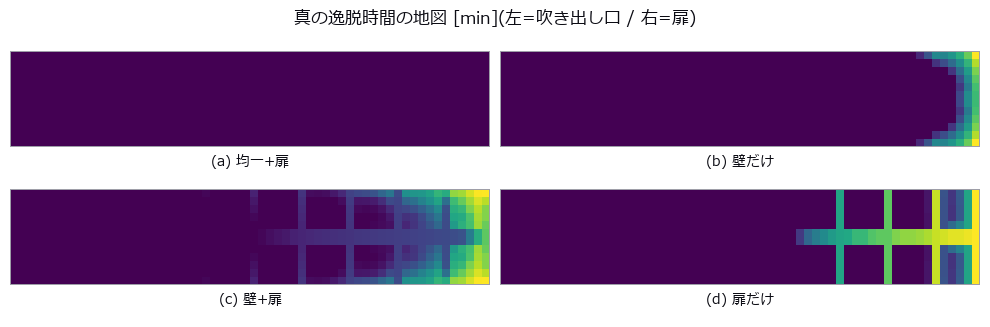
↑ この回の図
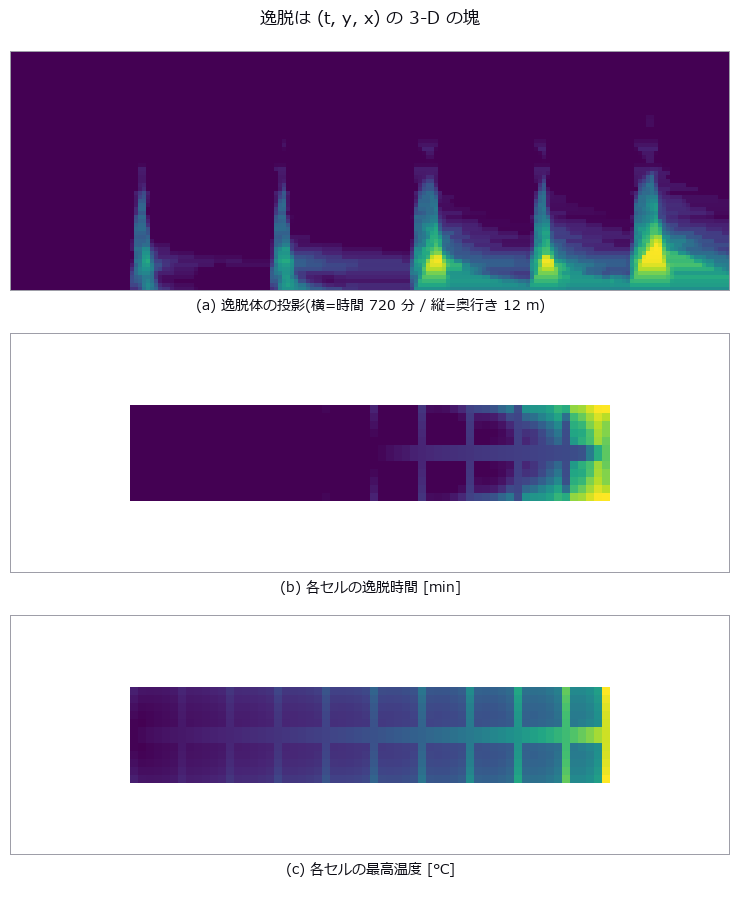
↑ 1 枚目は render_volume_projection を幅方向から掛けた xray 投影(明るいほど幅方向に厚い)。
py -3.11 examples/poc_cold_chain_excursion.py
Source: examples/poc_cold_chain_excursion.py
This run produced 16 figures in total - see them all
Ops used (notes): esdf · integrate_funct_1d · quantize · render_volume_projection · sample_funct_1d · vol_label · vol_label_shape_stats · vol_mip · vol_profile_line · vol_region_props
No.2026.095 —— Measuring the Growth, Not the Width — Rephotographing the Same Wall Changes What the Error Is
A wall at 1 px = 0.15 mm, rephotographed for twelve epochs over three years, with a crack opening at a true 0.040 mm/yr. Thresholding and counting pixels understates the width by 25.0 % yet overstates the growth rate by +153.0 %, and invents +0.0117 mm/yr of growth in a control where the width is frozen (the culprit is blur, isolated by switching one nuisance at a time). Integrating the intensity deficit gives +3.1 % on the rate and +0.0005 mm/yr on the control. The thresholded rate swings from 0.0241 to 0.1038 mm/yr on initial width alone — it depends on whether a one-pixel step happens to fall inside the observation window.
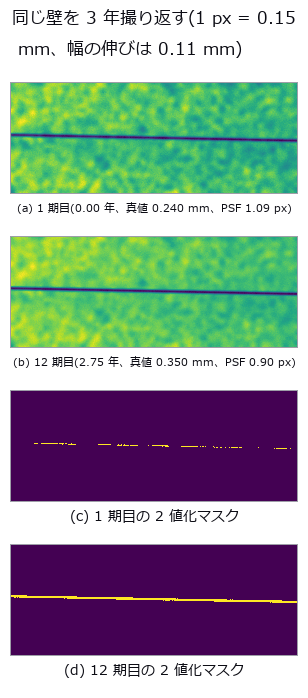
↑ Measuring the Growth, Not the Width — Rephotographing the Same Wall Changes What the Error Is ―― A wall at 1 px = 0.15 mm, rephotographed for twelve epochs over three years, with a crack opening at a true 0.040 mm/yr. Thresholding and counting pixels understates the width by 25.0 % yet overstates the growth rate by +153.0 %, and invents +0.0117 mm/yr of growth in a control where the width is frozen (the culprit is blur, isolated by switching one nuisance at a time). Integrating the intensity deficit gives +3.1 % on the rate and +0.0005 mm/yr on the control. The thresholded rate swings from 0.0241 to 0.1038 mm/yr on initial width alone — it depends on whether a one-pixel step happens to fall inside the observation window.
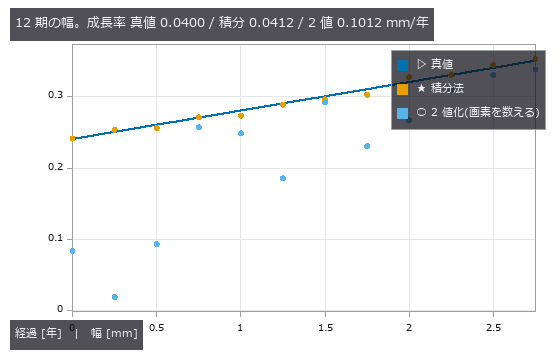
↑ The measurement ―― 2 値化は幅の偏りより期ごとの跳ねが問題。跳ねの正体はぼけと画素位相で、4 節と 3 節で分けて数える。 (figure labels are in Japanese; the numbers are the same)
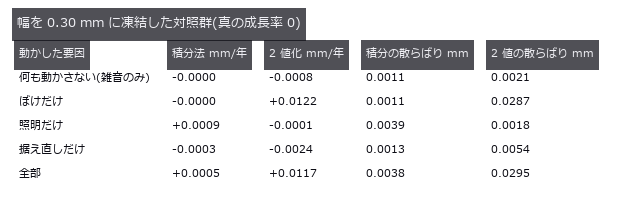
↑ ここに出る傾きはすべて『見かけの成長』。
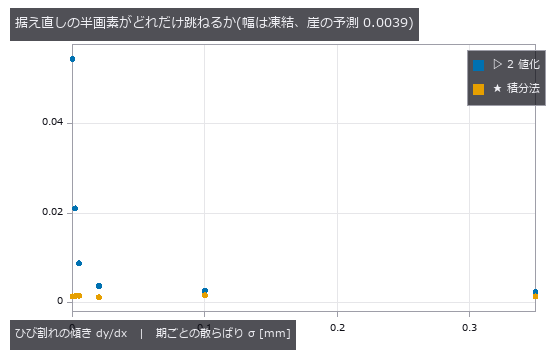
↑ 傾きが 0 に近いほど列方向の画素位相が揃い、2 値化は画面ごと 1 画素単位で跳ぶ。
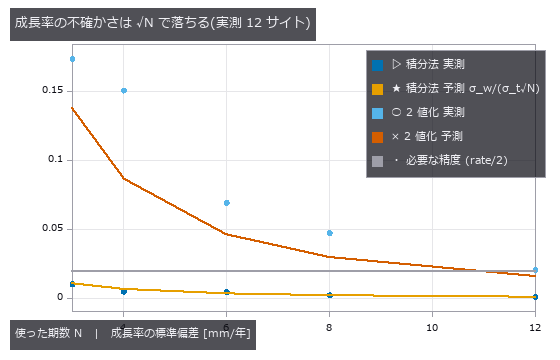
↑ 横線を下回った時点で 0.040 mm/年 を 2σ で言える。
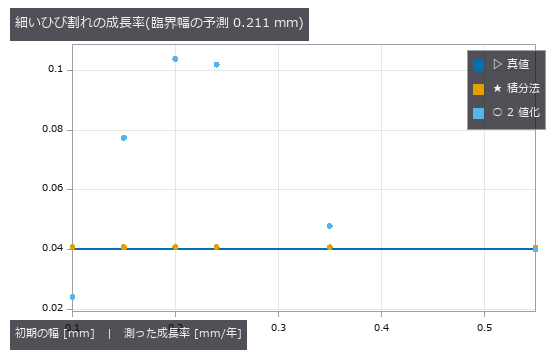
↑ 2 値化は臨界幅より細いと 0(未検出)。
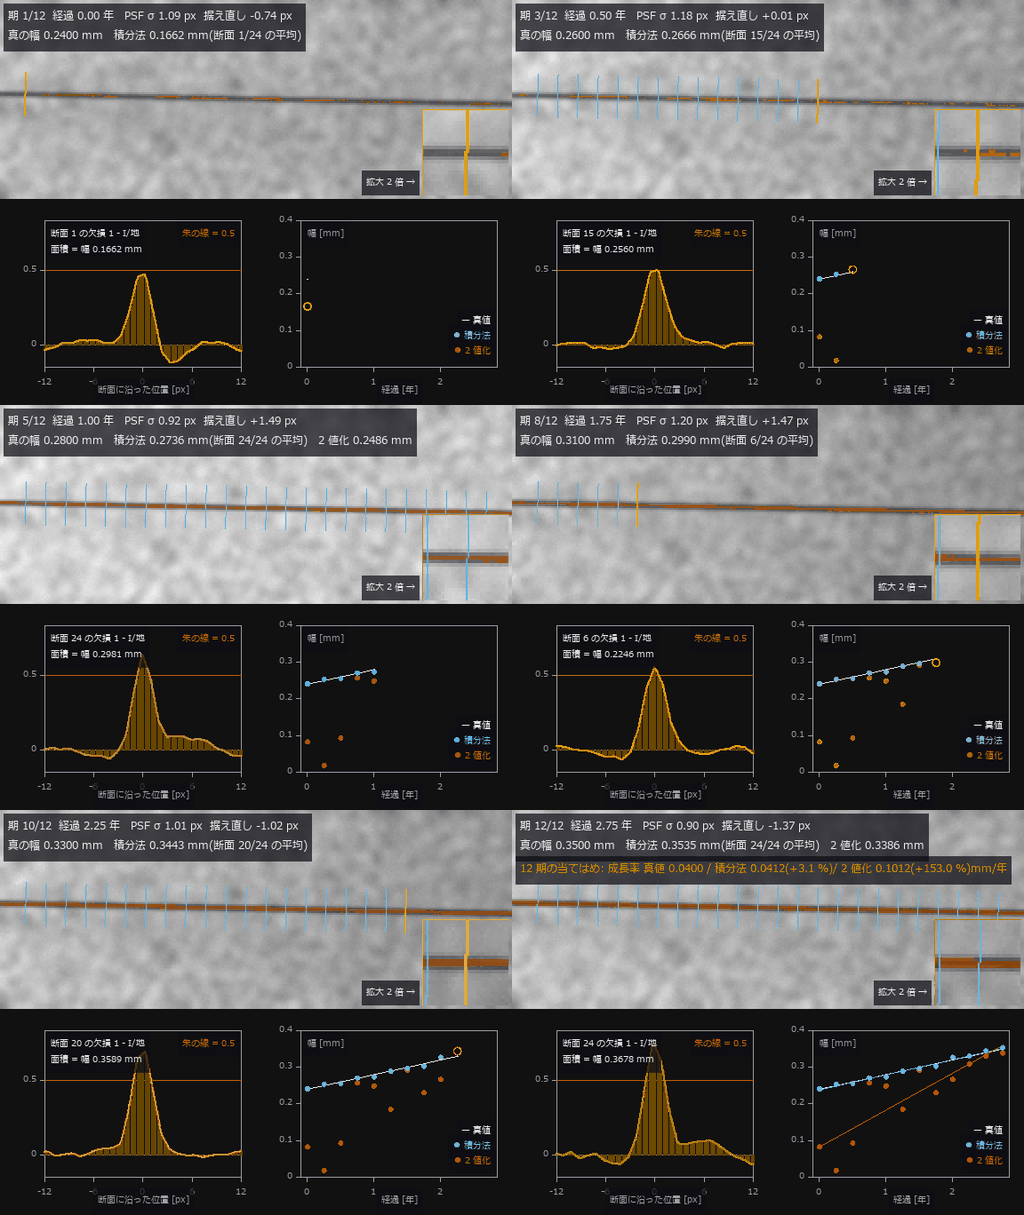
↑ The animation ―― 動画(576 × 456、12 fps、378 コマ): 同じ壁を 3 年 12 期撮り返す。各期で中心線に直交する断面を 24 本、左から順に切り(橙 = いま切っている断面、右下が拡大)、下段左がその断面の輝度欠損 —— その面積が幅そのもの。24 本の平均が積分法の幅(青、測りかけの期は橙の輪で途中平均)、朱のマスクの画素を数えたのが 2 値化(朱)。真の幅は 1 期 0.010 mm ずつ伸びる(0.067 画素)。最後の当てはめで成長率は 真値 0.0400 / 積分法 0.0412 / 2 値化 0.1012 mm/年。2 値化は期ごとに跳ね(0.0185〜0.3386 mm)、跳ねの正体はぼけ(PSF σ 0.75〜1.24 px)と据え直しの画素位相。
py -3.11 examples/poc_crack_width_timeseries.py
Source: examples/poc_crack_width_timeseries.py
This run produced 11 figures in total - see them all
Ops used (notes): axes_frame · axes_transform · data_to_pixel · plot_series · text_box · ticks
No.2026.026 —— Micro-Vibration of a Structure From Video — Does Motion Magnification Help You Measure?
A vibration of known amplitude 0.02 px at 3.7 Hz, synthesised to test whether motion magnification helps measurement. Exact to machine precision up to α = 200. But magnification does not improve measurement precision — multiplying the phase by α multiplies the noise by α. On a cantilever, phase correlation returns 0.15 px, the area average of 0.30 and 0.00 px, a number that exists nowhere.
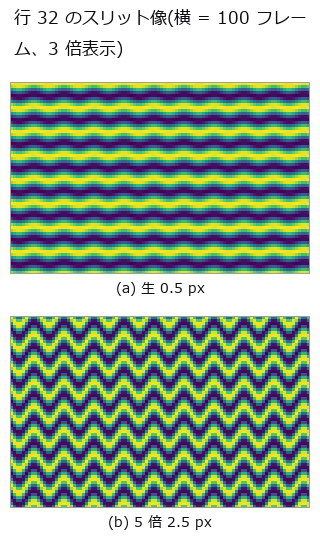
↑ Micro-Vibration of a Structure From Video — Does Motion Magnification Help You Measure? ―― A vibration of known amplitude 0.02 px at 3.7 Hz, synthesised to test whether motion magnification helps measurement. Exact to machine precision up to α = 200. But magnification does not improve measurement precision — multiplying the phase by α multiplies the noise by α. On a cantilever, phase correlation returns 0.15 px, the area average of 0.30 and 0.00 px, a number that exists nowhere.
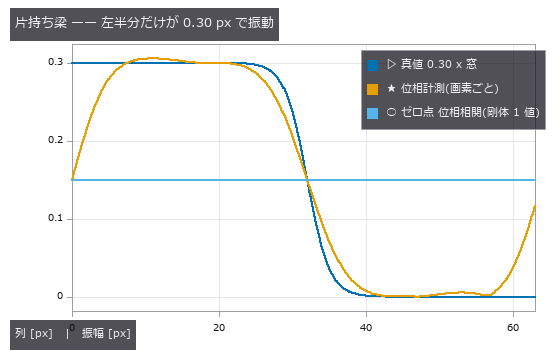
↑ The measurement ―― 剛体を仮定する位相相関が返す 0.150 px は 0.30 と 0.00 の面積平均で、どの列の真値とも違う。 (figure labels are in Japanese; the numbers are the same)
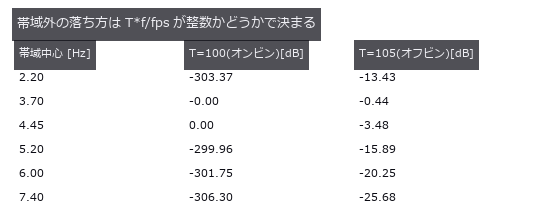
↑ 3.7 Hz を含む帯だけが 0 dB。
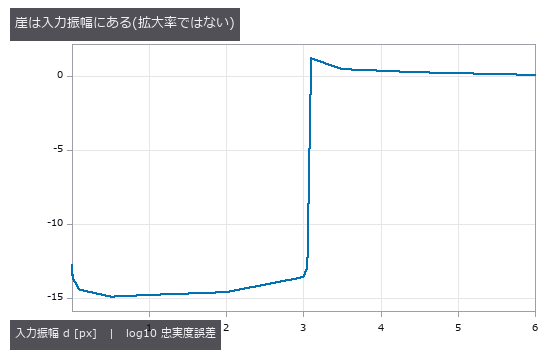
↑ 3.05 px までは機械精度、3.10 px で崩壊。
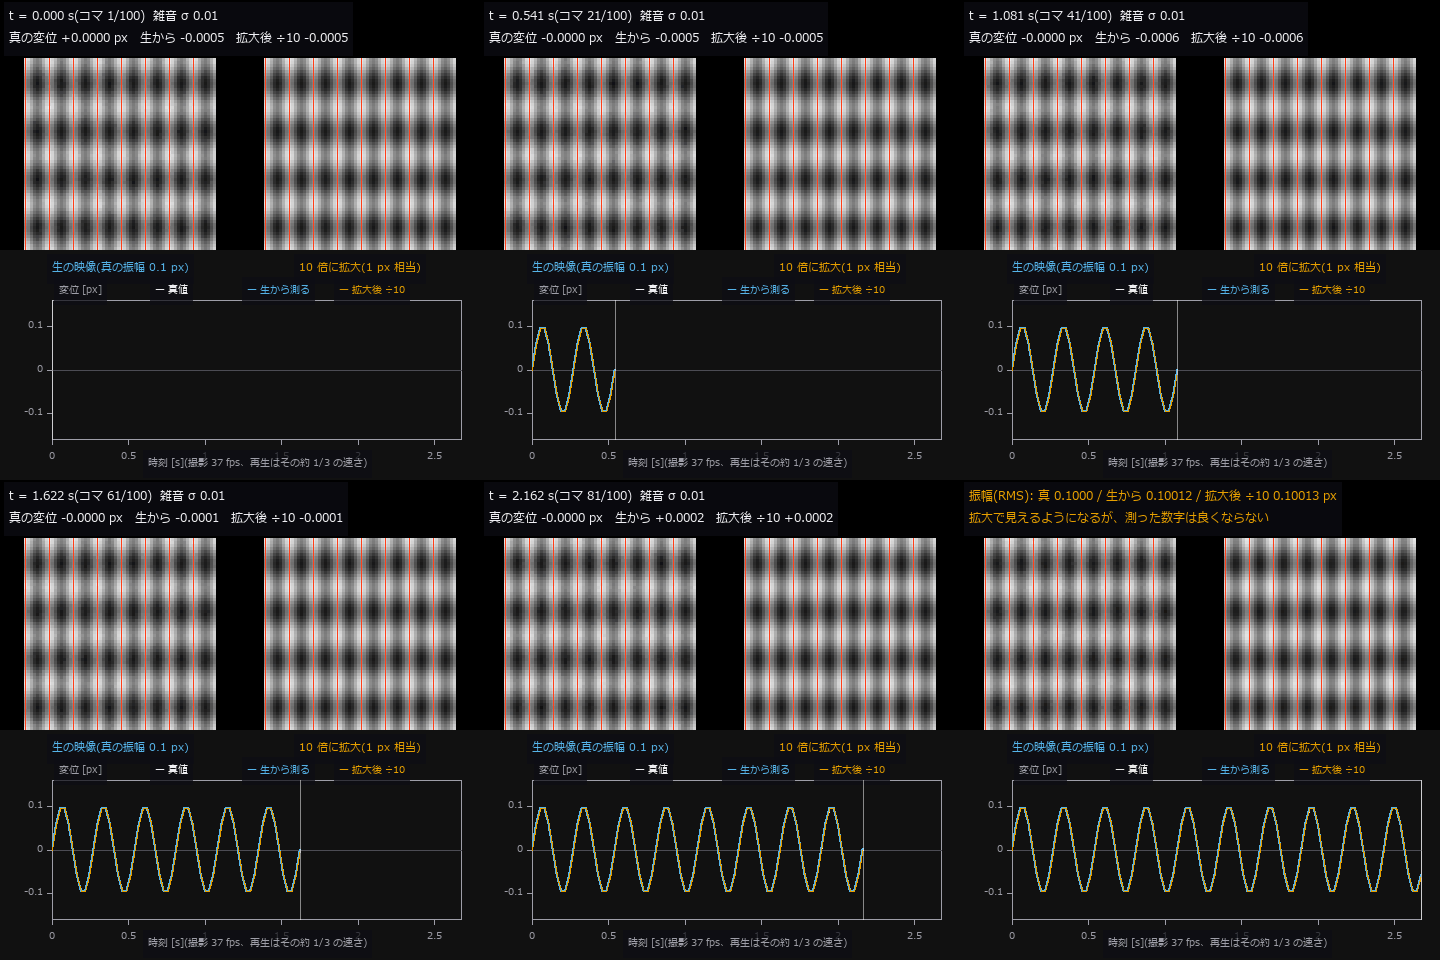
↑ The animation ―― 動画(480 × 480、12 fps、124 コマ): 3.7 Hz・0.1 px で揺れる表面(雑音 σ 0.01)。左が生の映像、右が 10 倍に拡大した映像で、朱の細い縦線は静止時の縞の山。生では揺れが表示 0.3 px で目に見えず、拡大後は 1 px 相当で見える。下段は変位の時系列: 白 = 真値、青 = 生の映像から測った値、橙 = 拡大後に測って 10 で割った値。振幅は 真 0.1000 / 生から 0.10012 / 拡大後 0.10013 px で、拡大しても測定は良くならない(見せるための道具)。
py -3.11 examples/poc_motion_magnification.py
Source: examples/poc_motion_magnification.py
This run produced 5 figures in total - see them all
Ops used (notes): axes_frame · axes_transform · band_snr · data_to_pixel · displacement_series · motion_magnify · phase_displacement · synthesize_translation · temporal_band_power · temporal_bandpass · text_box · ticks
No.2026.030 —— Particle Tracking as a (row, column, time) Volume — Mislinks Come in Two Directions
A video of 400 particles tracked, with the diffusion coefficient D read from the trajectories. Ambiguous mislinks pull D down to 0.925x; mislinks caused by missing targets push it up to 3.429x in the same video — one error rate cannot tell you the direction. What helps is not a one-to-one constraint but a single line imposing a maximum link distance (3.429 → 1.304).
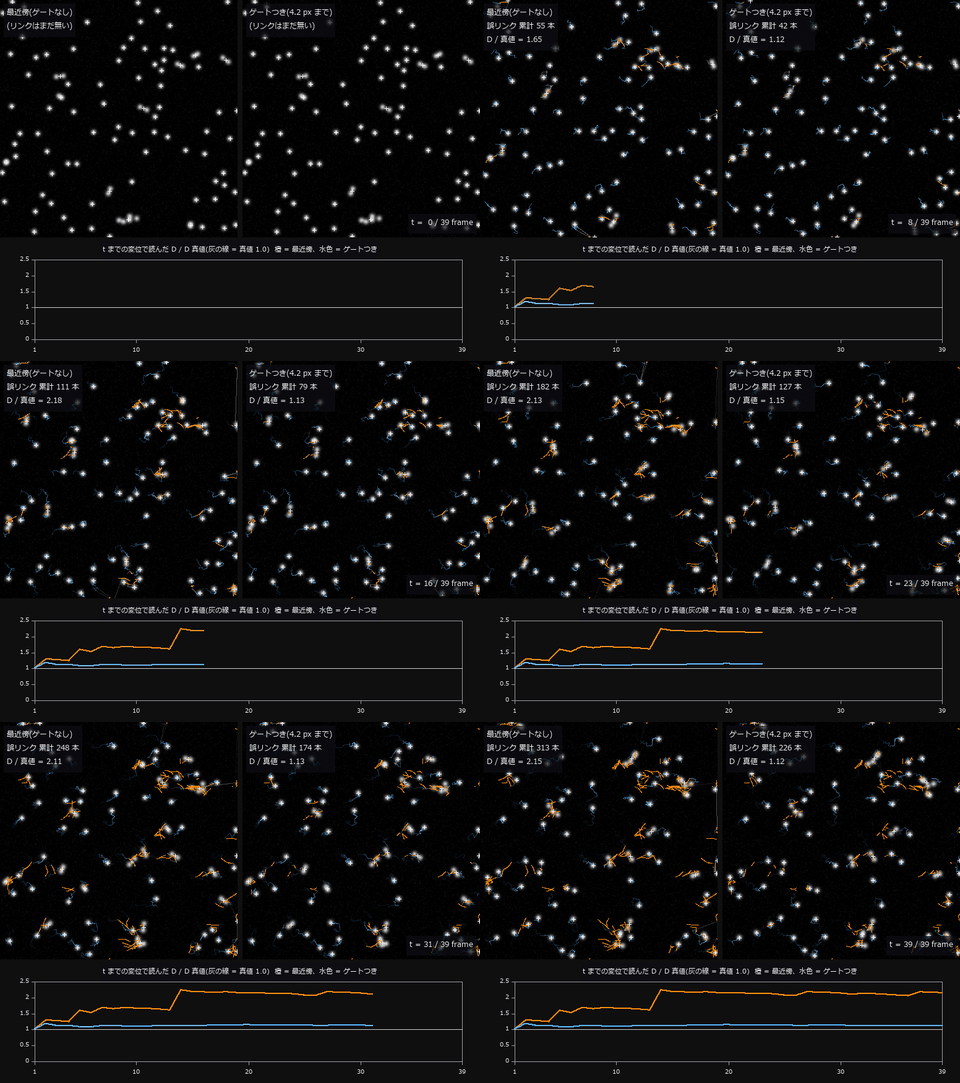
↑ Particle Tracking as a (row, column, time) Volume — Mislinks Come in Two Directions ―― A video of 400 particles tracked, with the diffusion coefficient D read from the trajectories. Ambiguous mislinks pull D down to 0.925x; mislinks caused by missing targets push it up to 3.429x in the same video — one error rate cannot tell you the direction. What helps is not a one-to-one constraint but a single line imposing a maximum link distance (3.429 → 1.304).
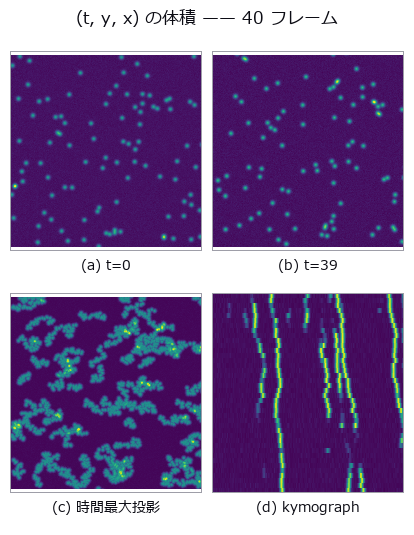
↑ The measurement ―― 時間最大投影では粒子が尾を引く(= 軌跡)。kymograph は行 90-101 の帯を縦(時間)へ積んだもので、筋の傾きがそのまま列方向の速度。縦は 5 倍に拡大。 (figure labels are in Japanese; the numbers are the same)
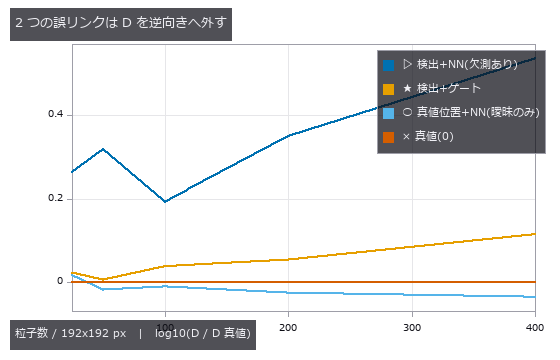
↑ 縦軸は常用対数(0 が真値)。
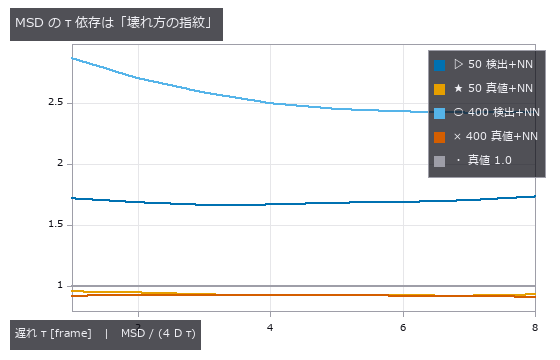
↑ 真値で割った比。
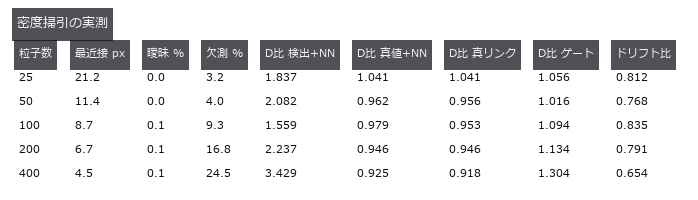
↑ 曖昧と欠測を分けて数えると、D の外れる向きが説明できる。
py -3.11 examples/poc_particle_tracking.py
Source: examples/poc_particle_tracking.py
This run produced 5 figures in total - see them all
Ops used (notes): axes_frame · axes_transform · blob_features · blob_label · plot_series · text_box · ticks · vol_label · vol_local_maxima
No.2026.111 —— Did It Settle, or Did We Just Scan It Again — What Changes When You Cut at the Detection Limit
A 24 x 16 m road surface settling above a tunnel drive, measured from two epochs of point cloud. The nearest-neighbour baseline (C2C) returns a median of 47.74 mm even with zero change — that is just the point spacing — and carries no sign. M3C2 averages -2.43 mm, matching the truth, but only 275 of 551 cores (49.9 %) exceed their level of detection, and those average -4.34 mm: the single averaged number agrees with neither. LoD is a map of the surface, not of the settlement, ranging 0.51 to 3.58 mm across zones. Summing only the significant cores shrinks the volume from 0.8569 to 0.7643 m3, and that shortfall is predictable in advance from the per-core LoD (0.867 predicted versus 0.892 measured).
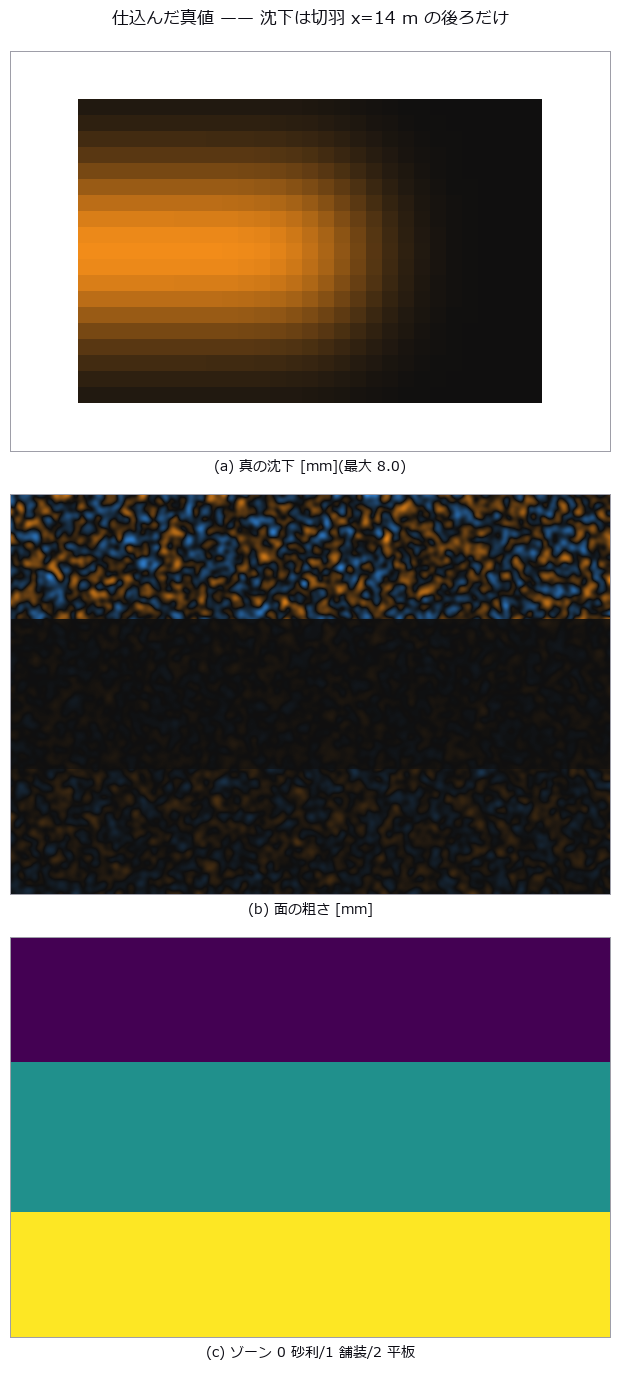
↑ Did It Settle, or Did We Just Scan It Again — What Changes When You Cut at the Detection Limit ―― A 24 x 16 m road surface settling above a tunnel drive, measured from two epochs of point cloud. The nearest-neighbour baseline (C2C) returns a median of 47.74 mm even with zero change — that is just the point spacing — and carries no sign. M3C2 averages -2.43 mm, matching the truth, but only 275 of 551 cores (49.9 %) exceed their level of detection, and those average -4.34 mm: the single averaged number agrees with neither. LoD is a map of the surface, not of the settlement, ranging 0.51 to 3.58 mm across zones. Summing only the significant cores shrinks the volume from 0.8569 to 0.7643 m3, and that shortfall is predictable in advance from the per-core LoD (0.867 predicted versus 0.892 measured).
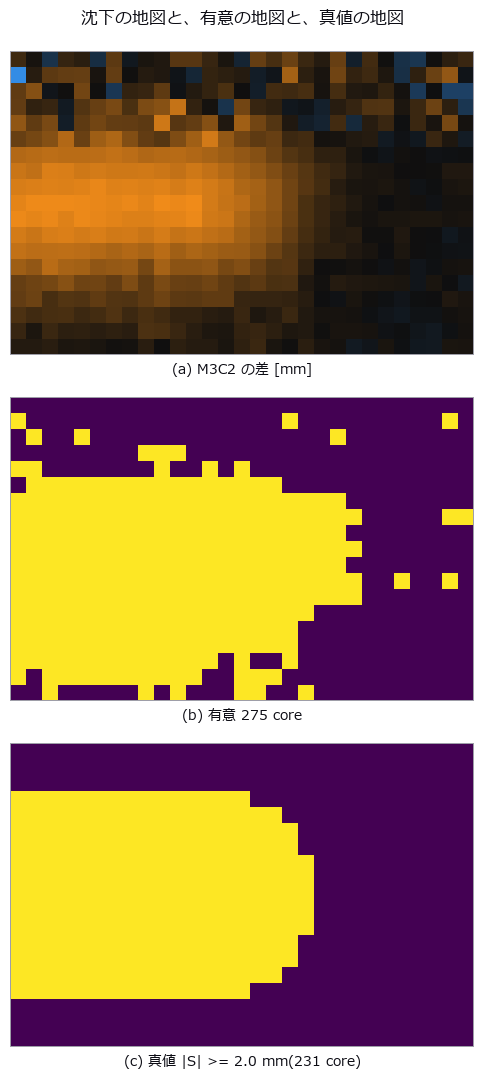
↑ The measurement ―― 有意の地図は真値の地図をよく復元する(TPR 88.7 % / FPR 3.6 %)。ただし縁が痩せる —— そこが 7 節の体積の話。 (figure labels are in Japanese; the numbers are the same)
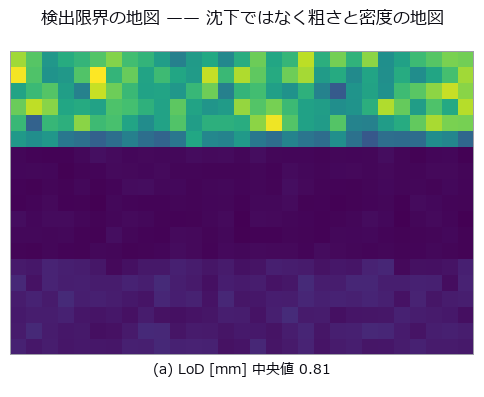
↑ 上の帯(砂利の路肩)は粗さ 15 mm・密度半分なので LoD が跳ね上がる。

↑ 予測は 1.96·σ·sqrt(1/na+1/nb)。
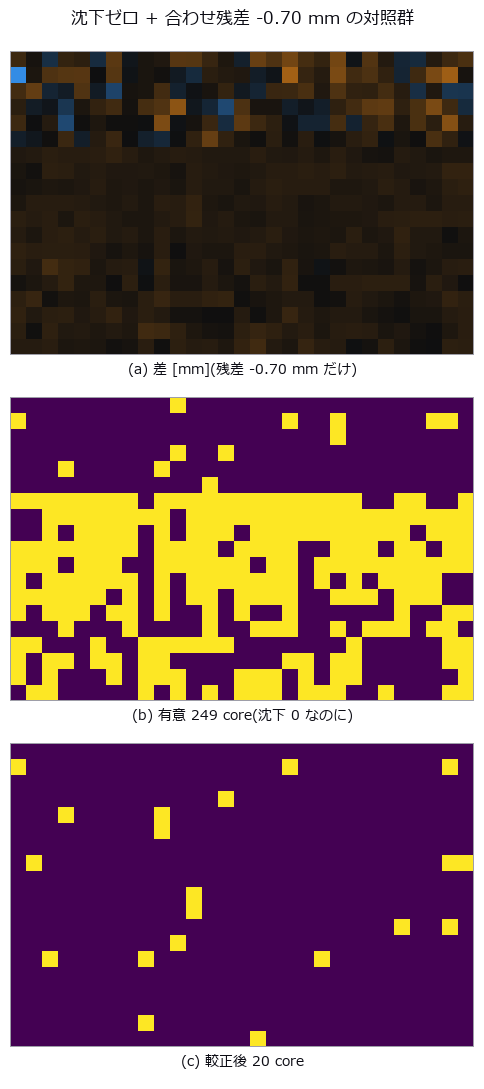
↑ LoD は雑音しか見ていないので、系統誤差はそのまま「有意な沈下」として通る。
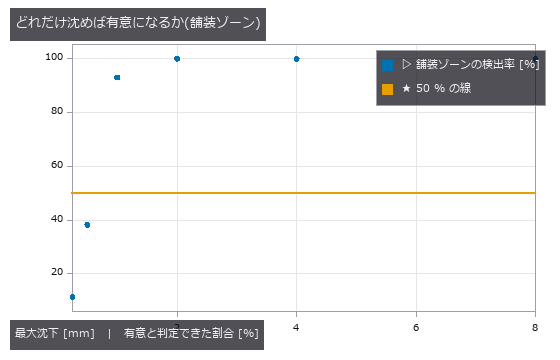
↑ 崖の位置はそのゾーンの LoD で決まる。
py -3.11 examples/poc_settlement_significance.py
Source: examples/poc_settlement_significance.py
This run produced 7 figures in total - see them all
No.2026.041 —— Template Tracking Drifts Quietly Before It Ever Loses the Target
A camera moved by a known similarity transform, exposing the three ways template tracking fails: losing the target, drifting quietly, and being confidently wrong. All 152 of the 152 drifted frames passed the peak threshold calibrated without occlusion and reported ‘found’. The only absolute quantity measurable without ground truth is forward-backward inconsistency.
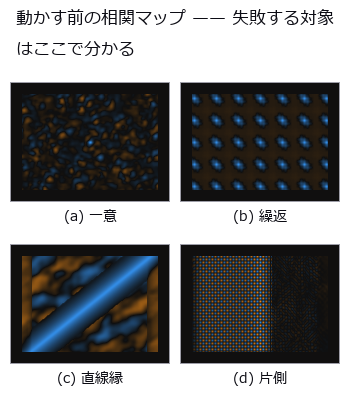
↑ Template Tracking Drifts Quietly Before It Ever Loses the Target ―― A camera moved by a known similarity transform, exposing the three ways template tracking fails: losing the target, drifting quietly, and being confidently wrong. All 152 of the 152 drifted frames passed the peak threshold calibrated without occlusion and reported ‘found’. The only absolute quantity measurable without ground truth is forward-backward inconsistency.
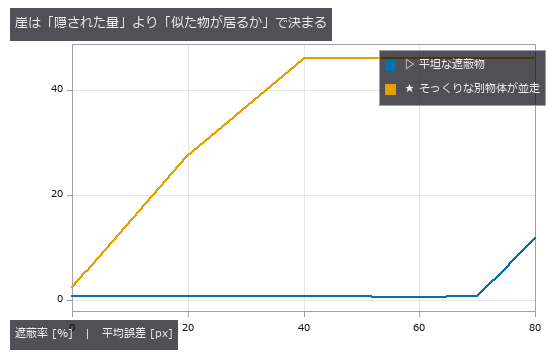
↑ The measurement ―― 同じ遮蔽率でも、そっくりな別物体が視野に居るだけで崖がはるかに手前へ来る。 (figure labels are in Japanese; the numbers are the same)
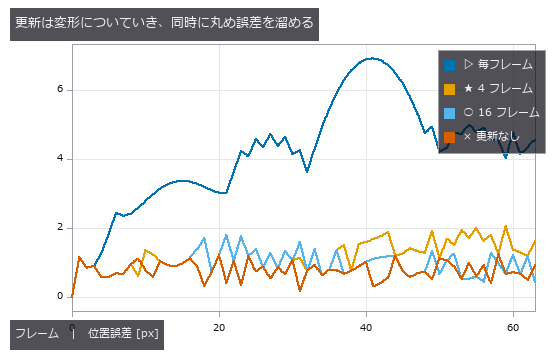
↑ 更新なしは平らなまま。
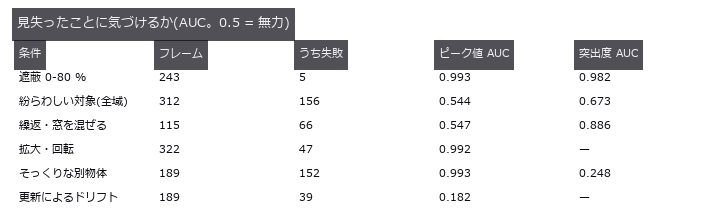
↑ 得意な崖が逆。
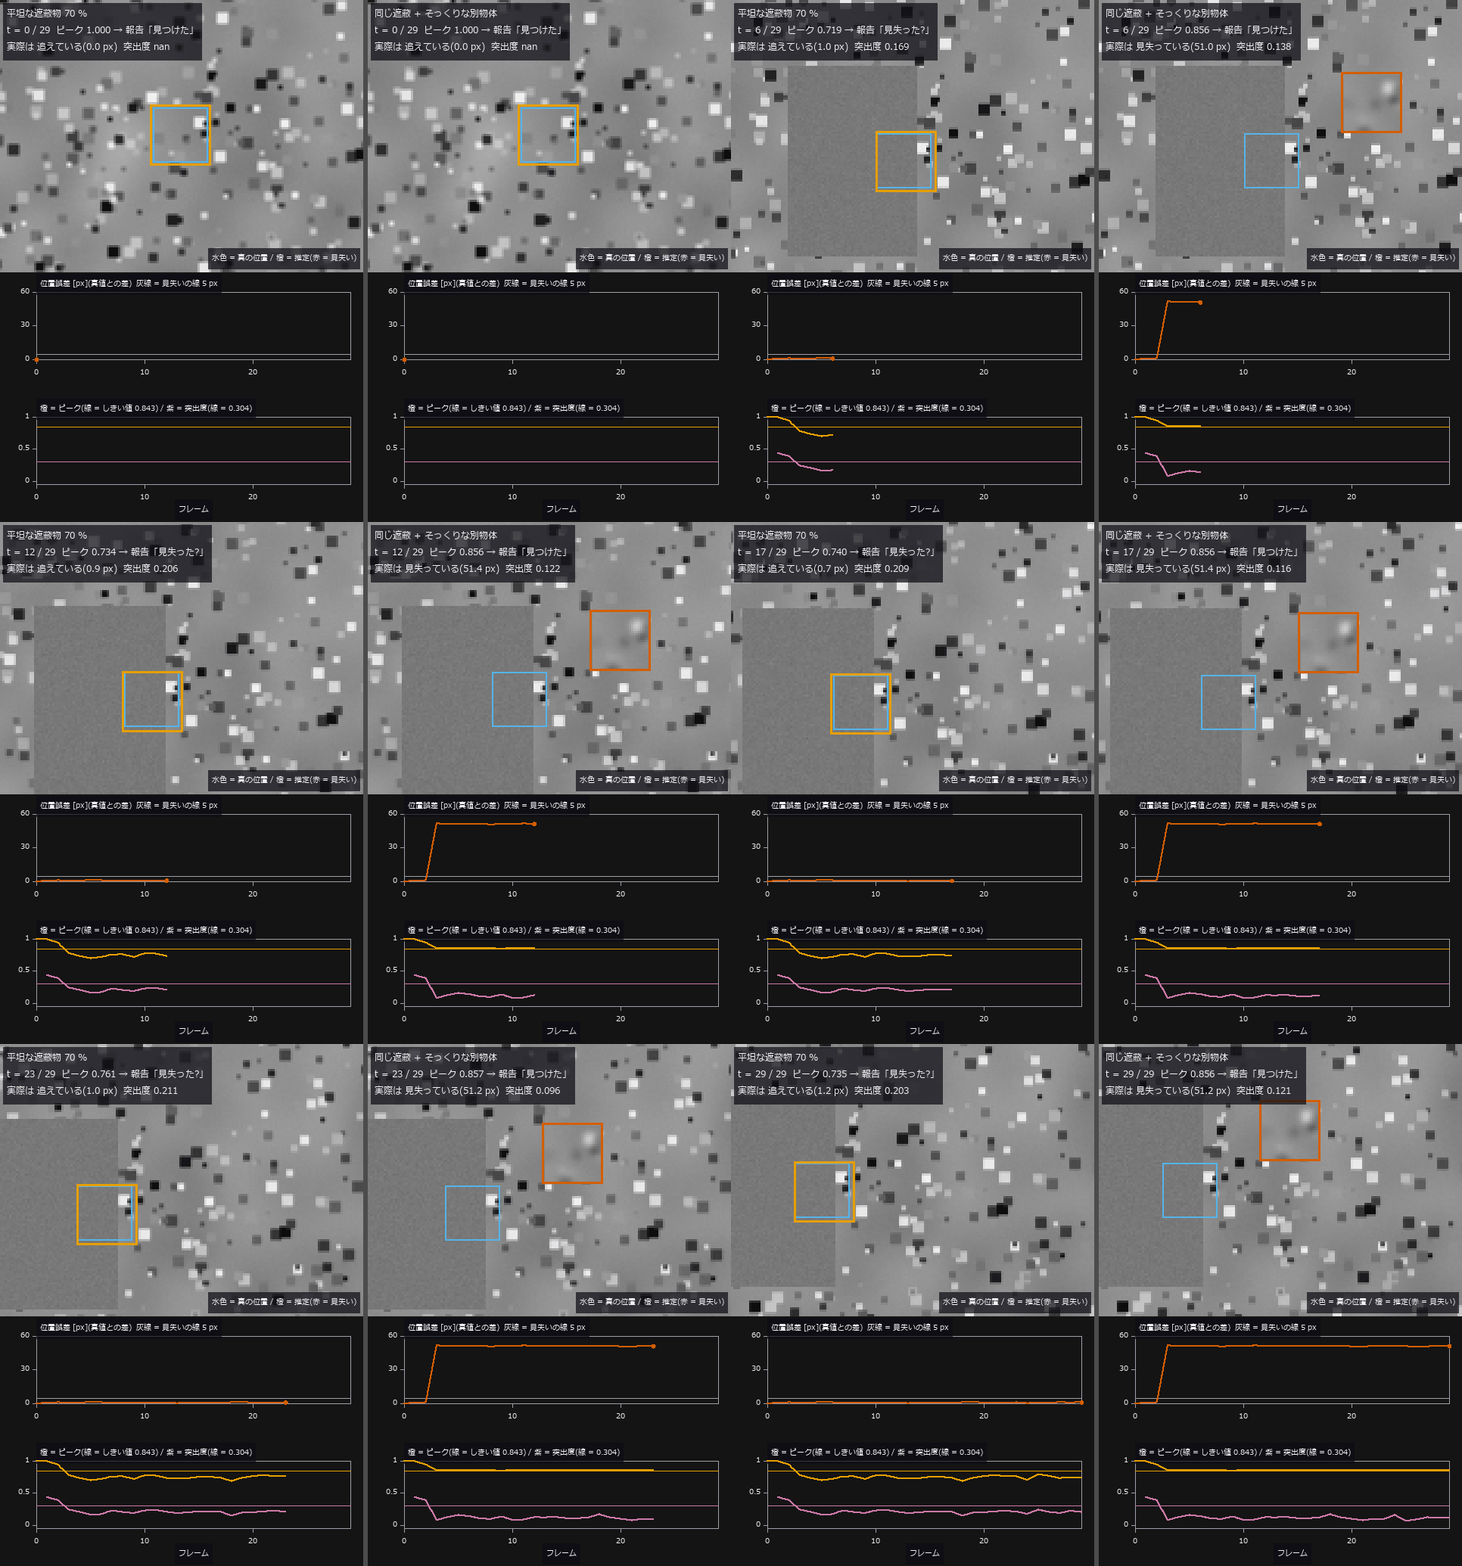
↑ The animation ―― 動画(30 フレーム + 最後で 2 秒止め、5 fps): 同じ 1 枚目のテンプレートを更新なし全域探索で追う(ゼロ点)。3 フレーム目から真の対象の 70 % を左から隠す。左 = 平坦な遮蔽物: ピークは平均 0.745 まで下がってしきい値 0.843 を割る(「見失った?」と正直に言う)が、位置は平均 0.78 px で追えている(見失い 0 / 27)。右 = そっくりな別物体が 51 px 離れて一緒に流れる: 最初の遮蔽フレームで複製に乗り換え、平均誤差 46.13 px、見失い 27 / 27 —— それなのにピークは平均 0.856 でしきい値を超え、27 / 27 フレームで「見つけた」と報告する。下段の紫(突出度)は右で平均 0.111 としきい値 0.304 を割って取り違えを疑うが、追えている左でも平均 0.203 で同じく割る —— 突出度が測っているのは曖昧さで、正しさではない
py -3.11 examples/poc_template_tracking.py
Source: examples/poc_template_tracking.py
This run produced 5 figures in total - see them all
Ops used (notes): axes_frame · axes_transform · ncc_locate · plot_series · reflect · shape_locate · text_box · ticks
No.2026.044 —— A Growth Time-Lapse as Space-Time Connected Components
A video of colonies spreading and merging, read as a (t, y, x) volume with 3-D connected components. Pixel area makes merging look early (-1.16 frames for pair 0-1) while rounding onto the frame grid makes it look late (+0.94); the two oppose, so the sum looks small. The default 26-connectivity of vol_label merged a near miss with a gap of 0.92.
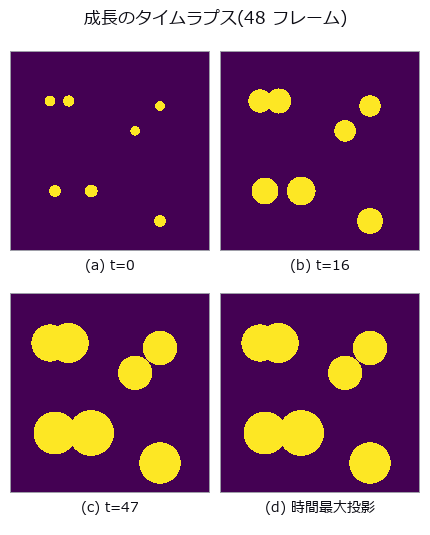
↑ A Growth Time-Lapse as Space-Time Connected Components ―― A video of colonies spreading and merging, read as a (t, y, x) volume with 3-D connected components. Pixel area makes merging look early (-1.16 frames for pair 0-1) while rounding onto the frame grid makes it look late (+0.94); the two oppose, so the sum looks small. The default 26-connectivity of vol_label merged a near miss with a gap of 0.92.
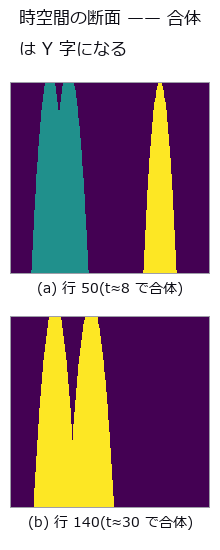
↑ The measurement ―― 縦が時間(下向き、4 倍に拡大)、横が列。2 本の管が合わさる高さがそのまま合体時刻。色は 3-D ラベル。 (figure labels are in Japanese; the numbers are the same)
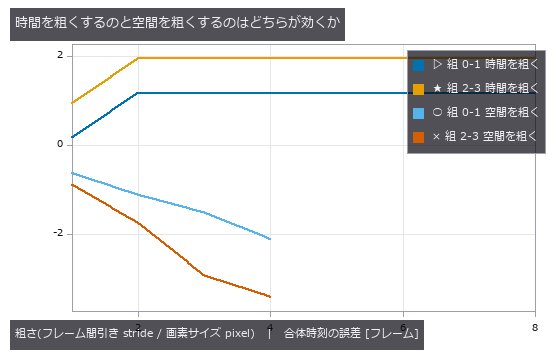
↑ 横軸はどちらも『何倍粗くしたか』。
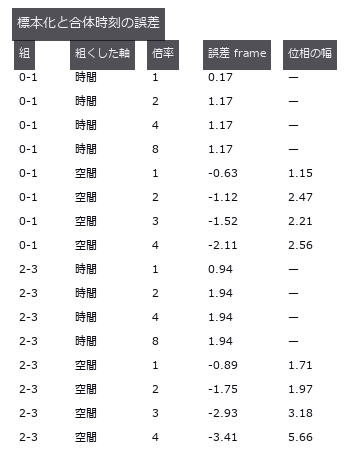
↑ 空間側は格子の位相でこれだけ動く(偏りより大きい)。
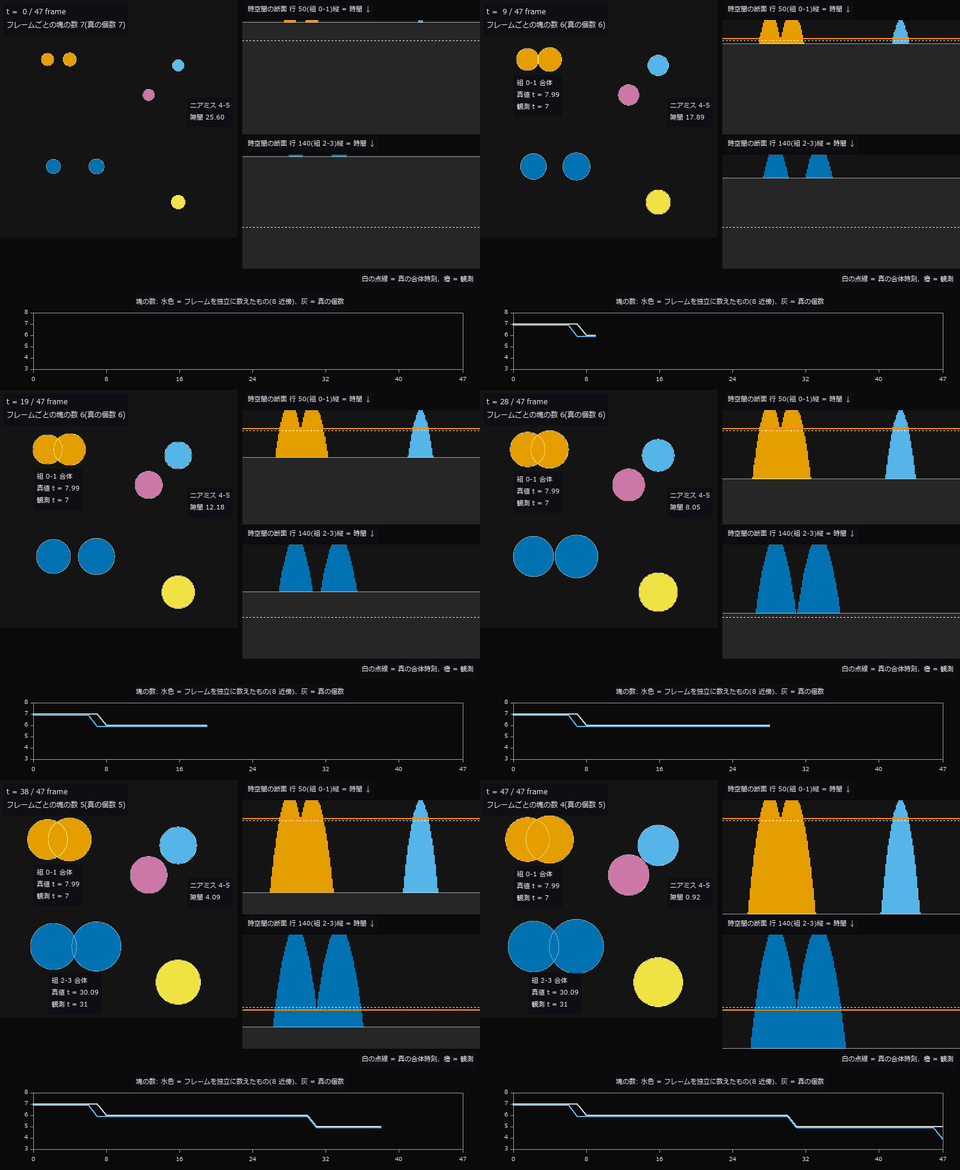
↑ The animation ―― 動画(48 フレーム): 左は二値のフレームを 3-D の家族ラベルで塗ったもの(白の細線 = 真の連続円。色は体積全体で決まる家族なので、合体する 2 個は合体の前から同じ色)。右は合体する 2 組の中心を通る行の時空間断面が時刻とともに現れ、Y 字の分かれ目が合体時刻になる(白の点線 = 閉形式の真値 7.99 / 30.09、橙 = 観測 7 / 31)。下はフレームを独立に数えた塊の数で、減ったのは t = 7, 31, 47。最後の t = 47 の減少はニアミス 4-5(最終フレームでも隙間 0.92)を 8 近傍が繋いだ偽の合体で、真の個数は 5 のまま。
py -3.11 examples/poc_timelapse_growth.py
Source: examples/poc_timelapse_growth.py
This run produced 5 figures in total - see them all
Ops used (notes): axes_frame · axes_transform · blob_label · plot_series · text_box · ticks · vol_label · vol_region_props
No.2026.045 —— Counting in (x, y, t) — Vehicles Passed, Occlusion, and One Constant: L/V
A synthetic traffic video counted per frame, by a virtual loop, and by connected components in a (t, x) slit image. The per-frame maximum reports 7 for 10 vehicles passed — it measures a different quantity. All three failure conditions are written with one constant, vehicle length over speed = L/V (9.0 frames); at a frame interval of 16 the bands fragment and 10 vehicles become 49.
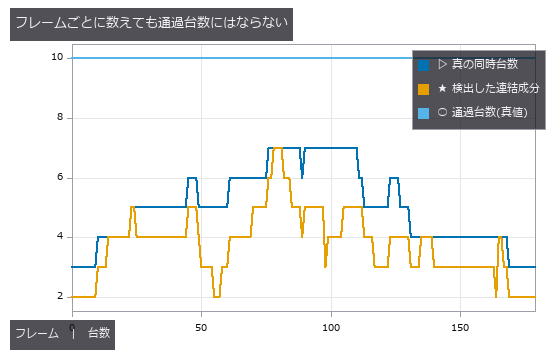
↑ Counting in (x, y, t) — Vehicles Passed, Occlusion, and One Constant: L/V ―― A synthetic traffic video counted per frame, by a virtual loop, and by connected components in a (t, x) slit image. The per-frame maximum reports 7 for 10 vehicles passed — it measures a different quantity. All three failure conditions are written with one constant, vehicle length over speed = L/V (9.0 frames); at a frame interval of 16 the bands fragment and 10 vehicles become 49.
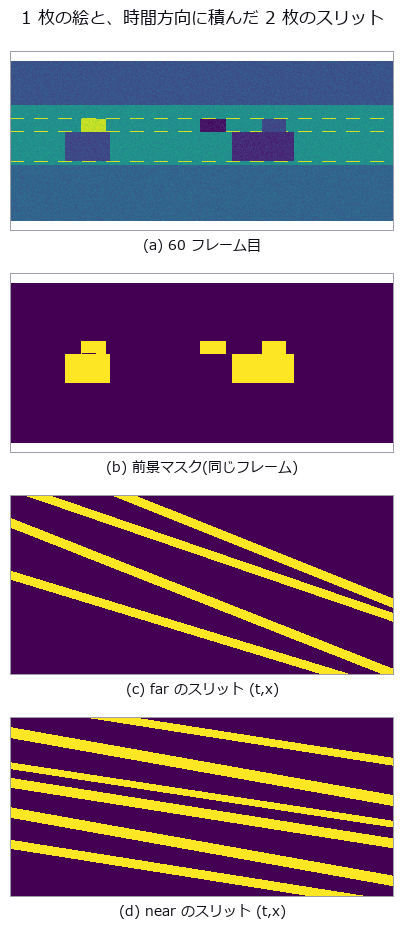
↑ The measurement (figure labels are in Japanese; the numbers are the same)
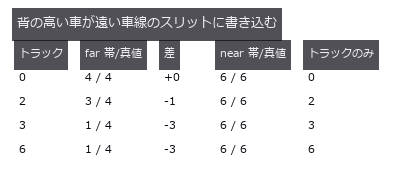
↑ トラックは画像の 50 行から 99 行を占めるので、遠い車線の計数行 63 を横切る。
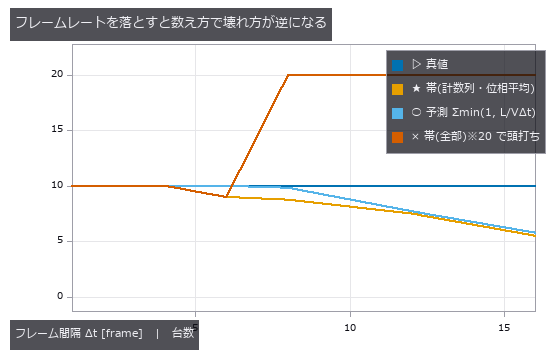
↑ 全部の帯を数えると千切れて過大に(実測は最大 67 だが、他の系列が潰れるので 20 で頭打ちにして描いている)、計数列と交わる帯だけなら見逃しだけ。
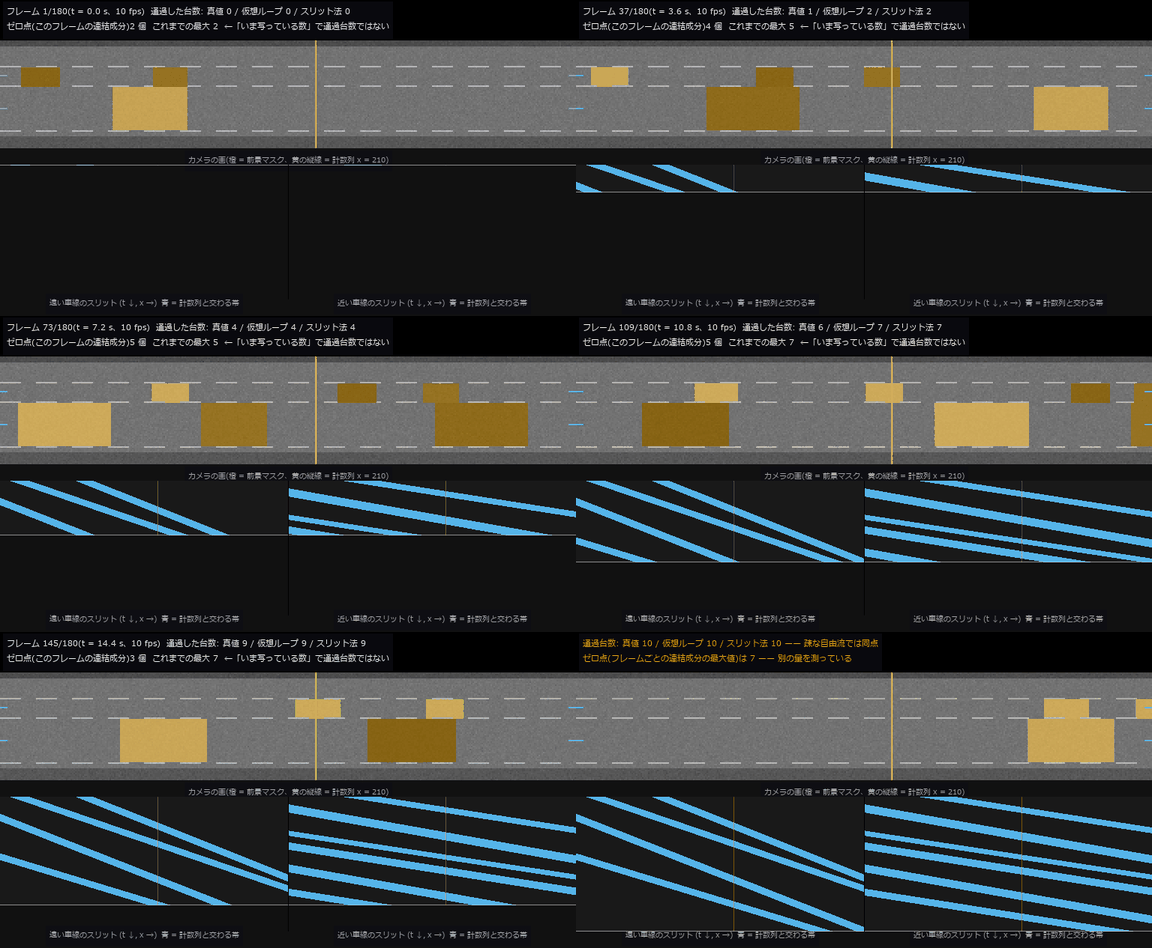
↑ The animation ―― 動画(768 × 422、10 fps、210 コマ = 撮った速さ): 2 車線の道路を 18 秒。上段はカメラの画に前景マスク(橙)と計数列(黄の縦線)を重ねたもの、下段は 2 車線の計数行を時間方向に積んだスリット画像 (t, x) が上から伸びていく —— 車 1 台が斜めの帯 1 本になり、傾きが速度。見出しの数字は時刻までの累積で、最後は 真値 10 / 仮想ループ 10 / スリット法 10 台と同点(途中で真値が遅れて見えるのは、真値を車体の中心で、ループとスリットを車体の先端で数えるため)。フレームごとに連結成分を数えるゼロ点は最大 7 で、「いま写っている数」を数えているだけ。
py -3.11 examples/poc_traffic_counting.py
Source: examples/poc_traffic_counting.py
This run produced 5 figures in total - see them all
Ops used (notes): axes_frame · blob_features · blob_label · data_to_pixel · text_box · threshold · ticks
No.2026.089 —— Where the Warehouse Dwell Came From — Count Waiting Without Its Kind and Everything Is Just Congestion
A synthetic warehouse floor plan with 26 tracked workers and AGVs, in which replenishment waits, queueing, aisle interference, system waits and stockouts were planted with known times and durations, then read as one (t, y, x) volume. Of the naive 321.5 s of “total dwell”, only 198.0 s (61.6 %) is real waiting; the rest is productive work and creep. Removing all queueing or all aisle interference moves that single number by -39.0 s versus -38.0 s, so it cannot say which to fix, while the per-kind counts drop to zero only for the kind that was removed. A stockout moves dwell by -17.0 s but adds 94.6 m of walking, and the three degradation axes each kill a different kind: sampling interval kills the short waits, occlusion kills the waits pressed against racks, and ID merging kills the two kinds defined by a relation between two people.
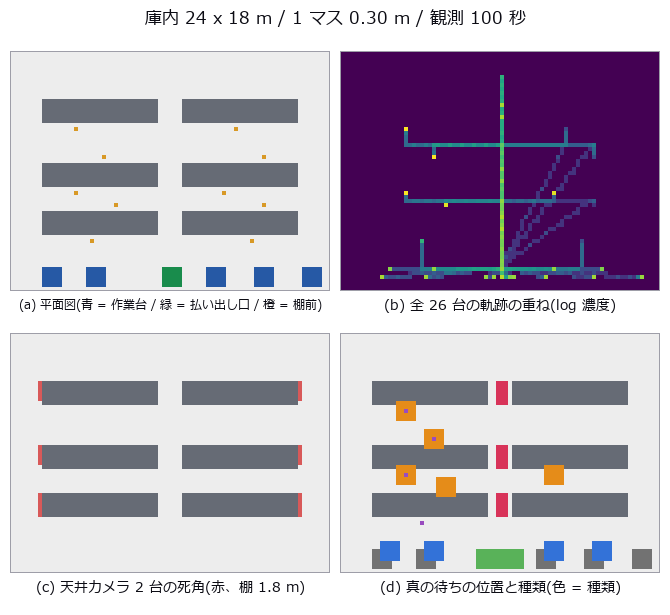
↑ Where the Warehouse Dwell Came From — Count Waiting Without Its Kind and Everything Is Just Congestion ―― A synthetic warehouse floor plan with 26 tracked workers and AGVs, in which replenishment waits, queueing, aisle interference, system waits and stockouts were planted with known times and durations, then read as one (t, y, x) volume. Of the naive 321.5 s of “total dwell”, only 198.0 s (61.6 %) is real waiting; the rest is productive work and creep. Removing all queueing or all aisle interference moves that single number by -39.0 s versus -38.0 s, so it cannot say which to fix, while the per-kind counts drop to zero only for the kind that was removed. A stockout moves dwell by -17.0 s but adds 94.6 m of walking, and the three degradation axes each kill a different kind: sampling interval kills the short waits, occlusion kills the waits pressed against racks, and ID merging kills the two kinds defined by a relation between two people.
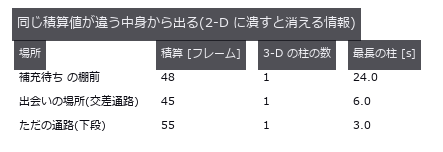
↑ The measurement ―― ヒートマップは場所を当てるが、「1 人が長く待った」と「何人も短く止まった」を分けない。 (figure labels are in Japanese; the numbers are the same)

↑ ゼロ点はこの表を 1 つの数字に畳む。
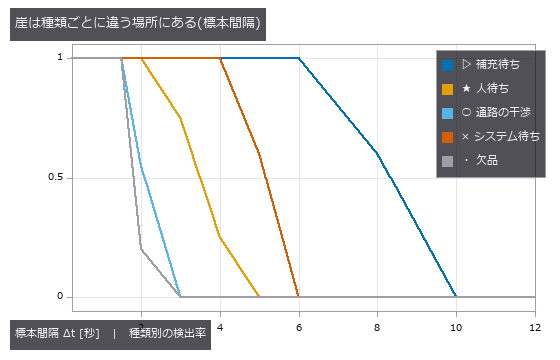
↑ 短い待ち(通路の干渉・欠品)から先に消える。
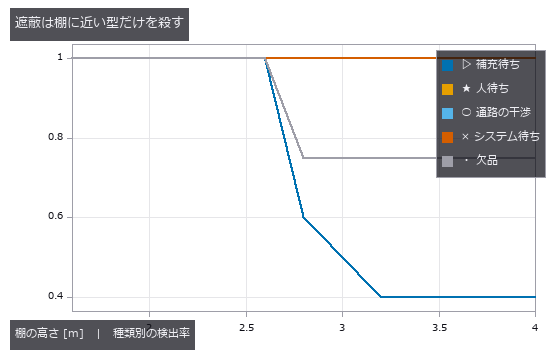
↑ 天井カメラ 2 台。
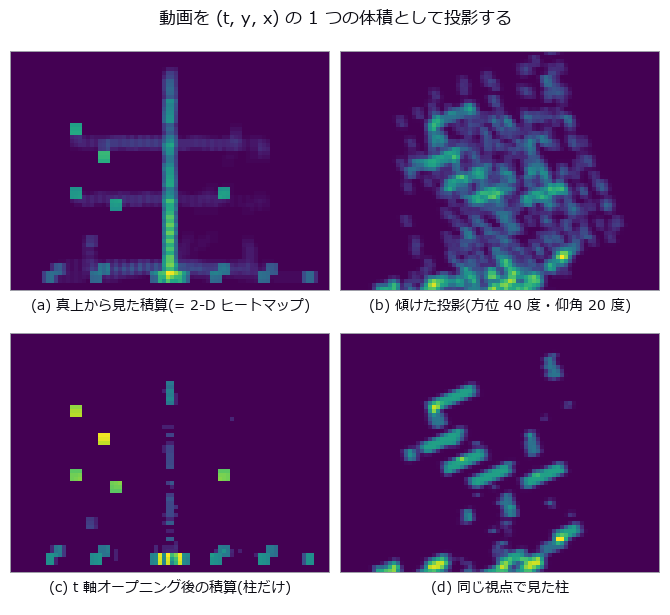
↑ 上段は通路が明るい(人が通っただけ)。
py -3.11 examples/poc_warehouse_flow.py
Source: examples/poc_warehouse_flow.py
This run produced 12 figures in total - see them all
Ops used (notes): esdf · face_areas · mesh_volume · occupancy_grid · render_volume_projection · vol_dilate · vol_erode · vol_label · vol_opening_ball · vol_region_props
No.2026.053 —— The Arrival-Time Surface as an Isosurface in (x, y, t)
The arrival-time surface of wavefronts spreading from point sources, extracted as an isosurface of the (x, y, t) volume. The null (first frame above threshold) is biased by Δt/2, which more frames cannot remove; linear sub-frame interpolation is 27x better (0.0209 ms). Parabolic interpolation loses to linear, and linear is at its best (a 3.8x margin) when the threshold sits at the Gaussian’s inflection point θ = 0.6065.
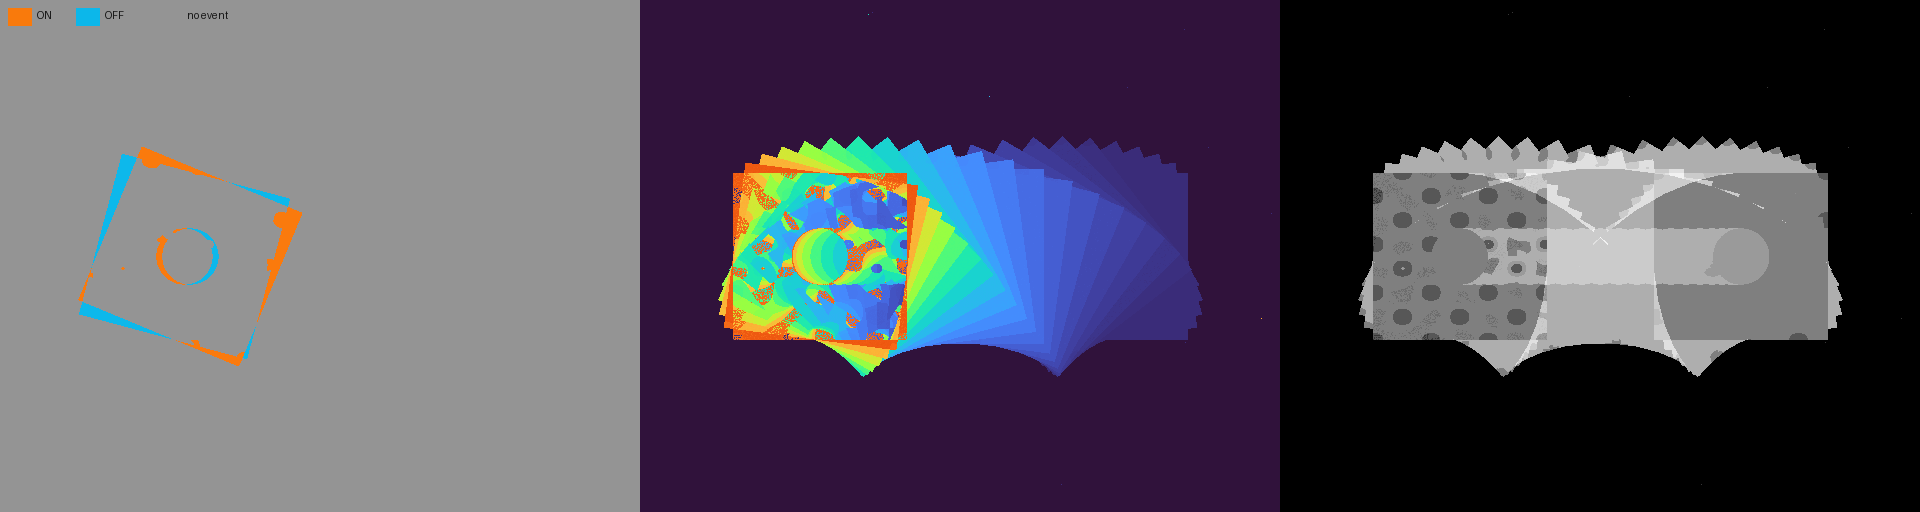
↑ The Arrival-Time Surface as an Isosurface in (x, y, t) ―― The left panel of the lead image shows only the last 1 ms at a display time of 3 ms (5.9 px of travel): sparse moving-edge ON events are orange, OFF events cyan, and no-event pixels grey. The middle panel is the time surface and the right panel keeps the whole-clip count. The arrival video has 171 frames at 624 x 586 and 20 fps.
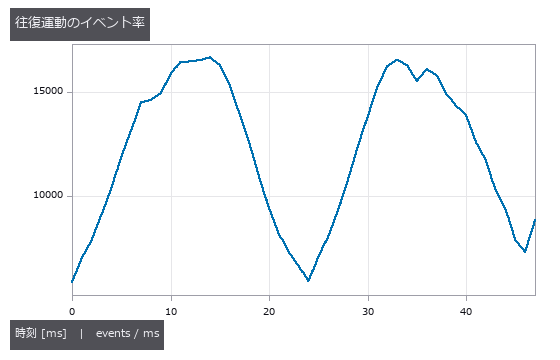
↑ The measurement ―― 方向反転では速度が下がりイベント率も下がる。静止背景はイベントを出さない。 (figure labels are in Japanese; the numbers are the same)
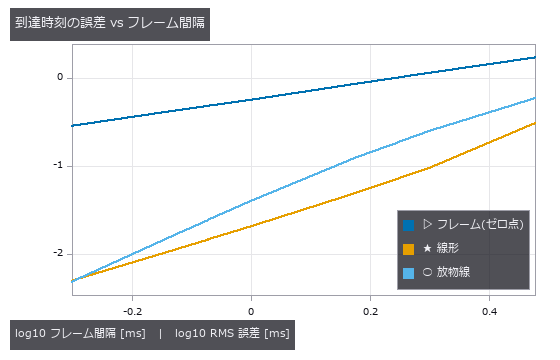
↑ 両対数。
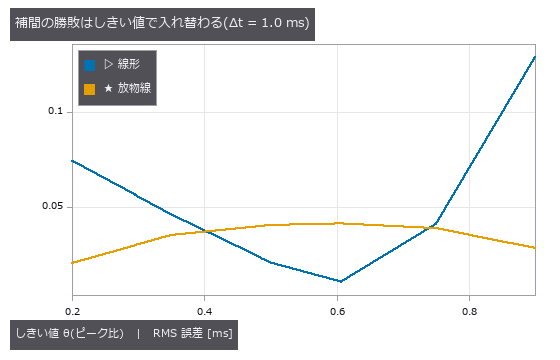
↑ 変曲点 θ=0.6065 では線形が 3.8 倍勝ち、θ=0.2 では放物線が 3.6 倍勝つ。

↑ 各帯の中央値。
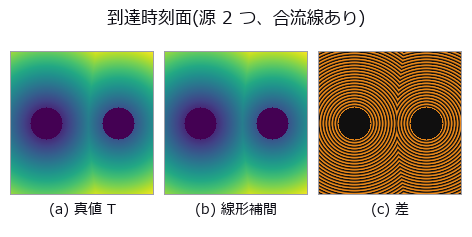
↑ 差は上下 99 % 分位(±0.0327 ms)で切った。
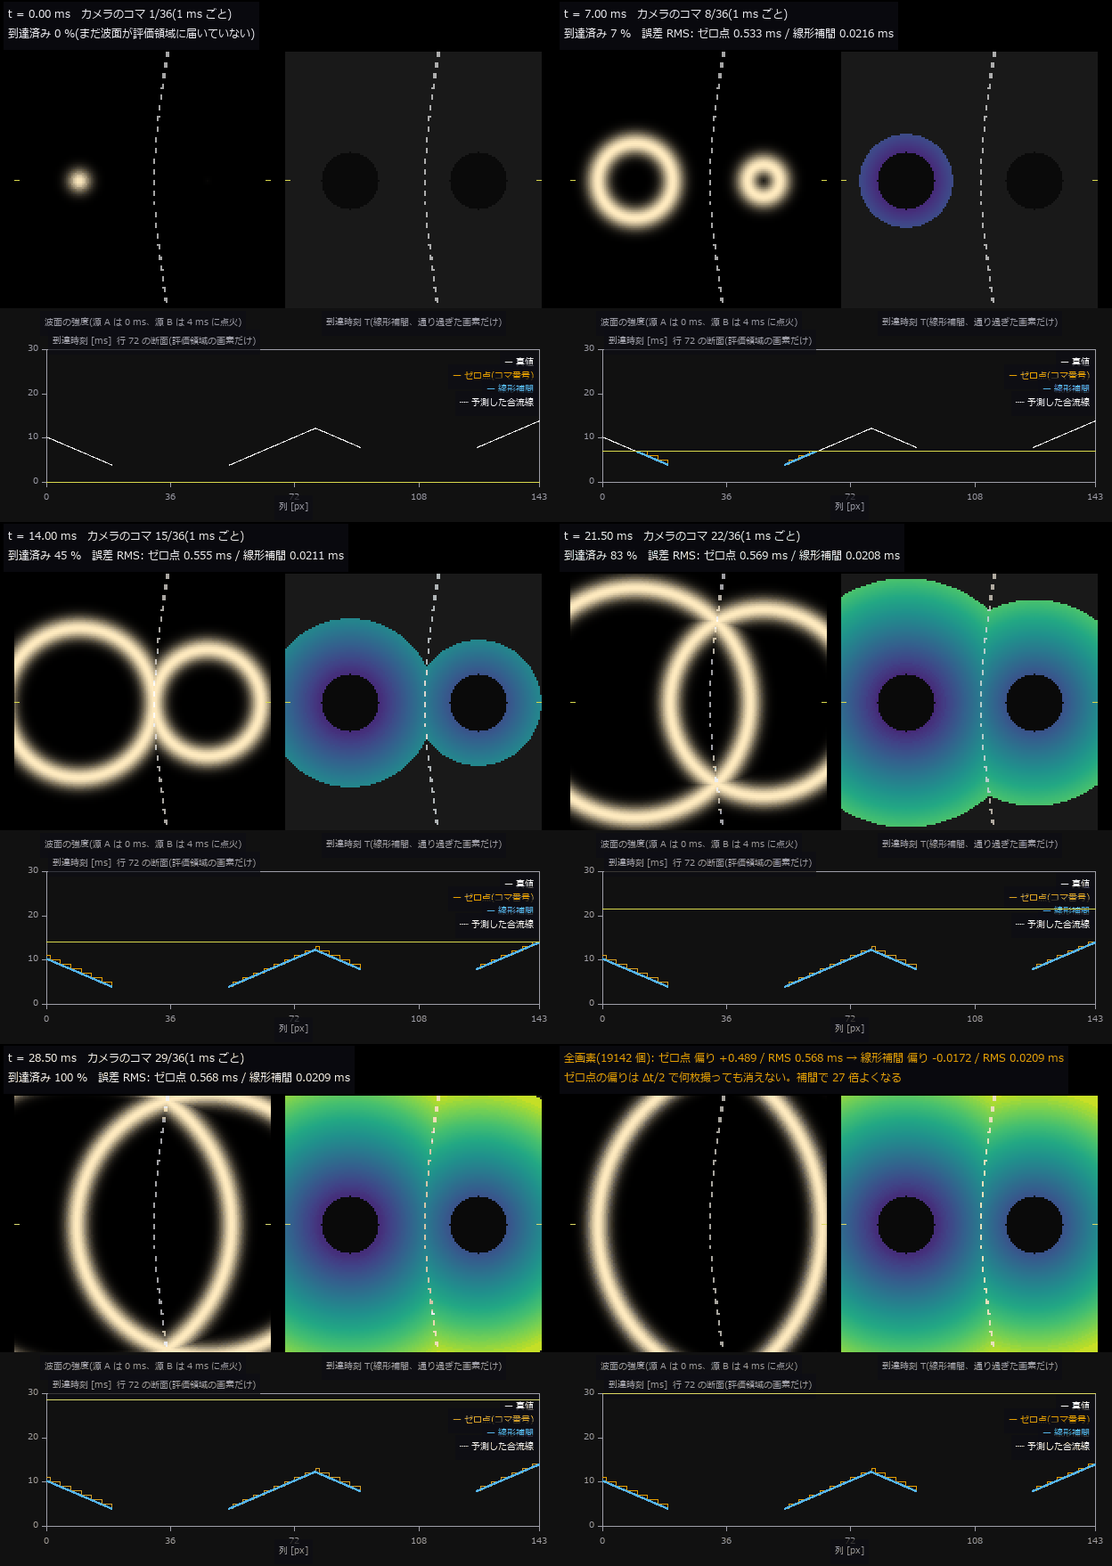
↑ The animation ―― 動画(624 × 586、20 fps、171 コマ): 2 つの点源から波面が広がる(源 B は 4 ms 遅れて点火)。左が波面の強度、右は線形補間で出した到達時刻を、波面が通り過ぎた画素から順に塗ったもの —— 動画 (t, y, x) を1 つの体積とみなしたときの等値面が、こうして 1 枚の面になる。点線は撮る前に閉形式で予測した合流線。下段は行 72 の断面で、白 = 真値、橙 = ゼロ点(初めてしきい値を超えたコマの時刻、1 ms の階段)、青 = 線形補間。最後に全画素の誤差: ゼロ点 RMS 0.568 ms(偏り +0.489)、線形補間 RMS 0.0209 ms(27 倍)。
py -3.11 examples/poc_xyt_event_surface.py
Source: examples/poc_xyt_event_surface.py
This run produced 7 figures in total - see them all
Ops used (notes): axes_frame · axes_transform · data_to_pixel · text_box · ticks · vertex_normals · vol_edge_probe
No.2026.127 —— A Clip as a Space-Time Cube — What Passed Where, and When, in One Solid
Video Summagator (Nguyen, Niu and Liu, ACM CHI 2012) turns a clip into an (x, y, t) cube, renders the static background faintly and moving objects densely, and lets you cut and rotate the cube to jump to a scene. The new family videocube re-implements it in 6 ops (numpy + scipy only, no new types): frame-difference magnitude as opacity (video_spacetime_cube), front-to-back alpha compositing from any viewpoint with trails coloured by time (blue = start, red = end; vol_render_transfer), cuts (video_cube_cut: x-t slit scans), orbits (video_cube_orbit), keyframes (video_summary_keyframes) and animated GIF export (video_write_gif, the reusable exit). On a synthetic surveillance clip with three objects of known row, onset and speed, the onset read from the first row of each slit-scan streak and the speed read from its slope match the truth exactly (±0 frames; +2.00 / −1.50 / +1.00 px/frame), and the keyframes catch all three onsets (a random choice of 4 frames catches 0.21 on average). The same operators applied to a z-stack of fly-brain EM sections (CREMI sample A, 32 sections, raw data never committed) turn membranes into depth-coloured tubes with neurites running through the stack. In Studio, Tools ▸ Video cube runs it interactively (drag to orbit, slide the cut plane, click the slit scan to jump to that frame, open .npy / GIF / video / .hdf stacks, Save GIF).
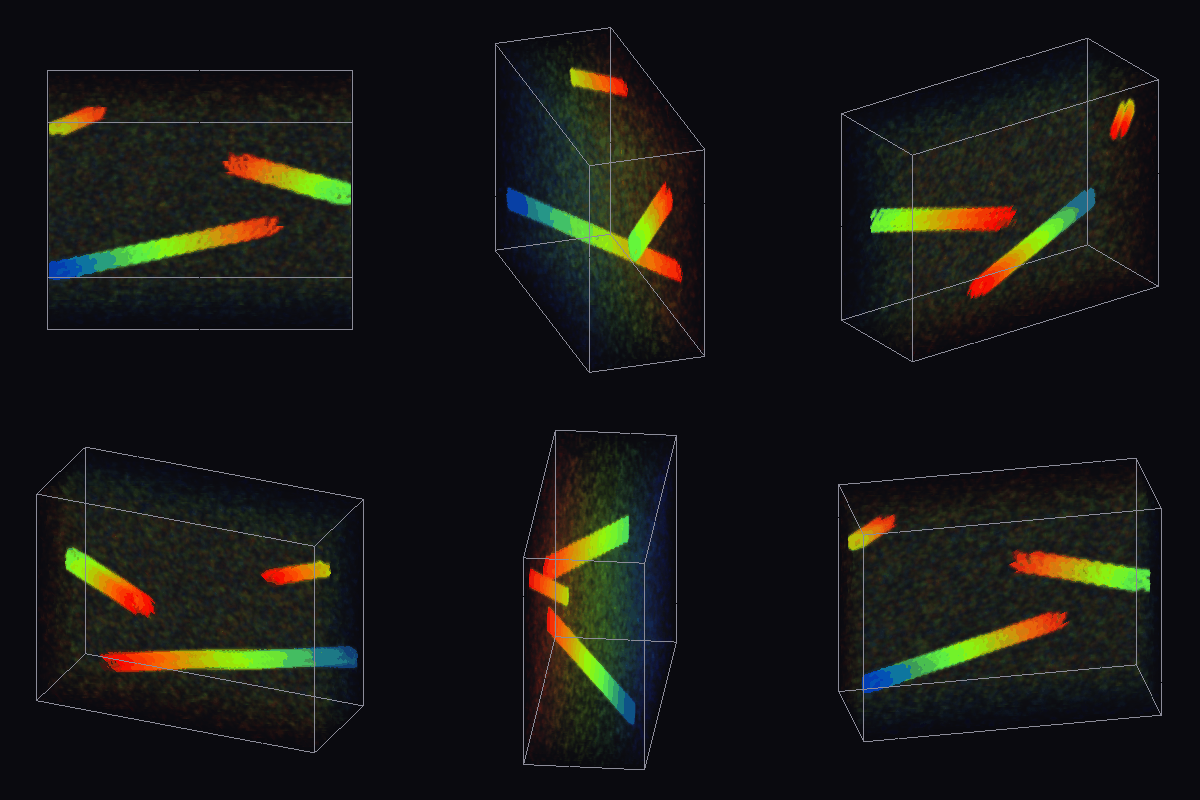
↑ A Clip as a Space-Time Cube — What Passed Where, and When, in One Solid ―― Video Summagator (Nguyen, Niu and Liu, ACM CHI 2012) turns a clip into an (x, y, t) cube, renders the static background faintly and moving objects densely, and lets you cut and rotate the cube to jump to a scene. The new family videocube re-implements it in 6 ops (numpy + scipy only, no new types): frame-difference magnitude as opacity (video_spacetime_cube), front-to-back alpha compositing from any viewpoint with trails coloured by time (blue = start, red = end; vol_render_transfer), cuts (video_cube_cut: x-t slit scans), orbits (video_cube_orbit), keyframes (video_summary_keyframes) and animated GIF export (video_write_gif, the reusable exit). On a synthetic surveillance clip with three objects of known row, onset and speed, the onset read from the first row of each slit-scan streak and the speed read from its slope match the truth exactly (±0 frames; +2.00 / −1.50 / +1.00 px/frame), and the keyframes catch all three onsets (a random choice of 4 frames catches 0.21 on average). The same operators applied to a z-stack of fly-brain EM sections (CREMI sample A, 32 sections, raw data never committed) turn membranes into depth-coloured tubes with neurites running through the stack. In Studio, Tools ▸ Video cube runs it interactively (drag to orbit, slide the cut plane, click the slit scan to jump to that frame, open .npy / GIF / video / .hdf stacks, Save GIF).
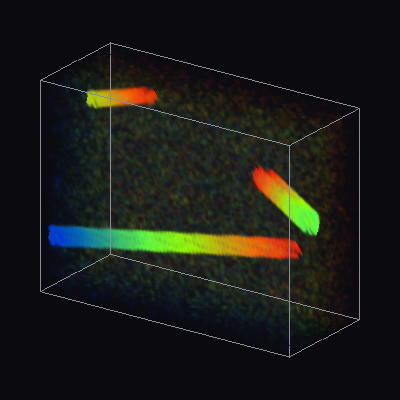
↑ The measurement ―― the clip as a space-time cube (time = depth to the right): moving objects leave trails coloured by time (blue = start, red = end); the static background is a faint grey (figure labels are in Japanese; the numbers are the same)

↑ x-t slit scans of the three rows: a streak’s first row is the onset, its slope is the speed (yellow line = injected onset)
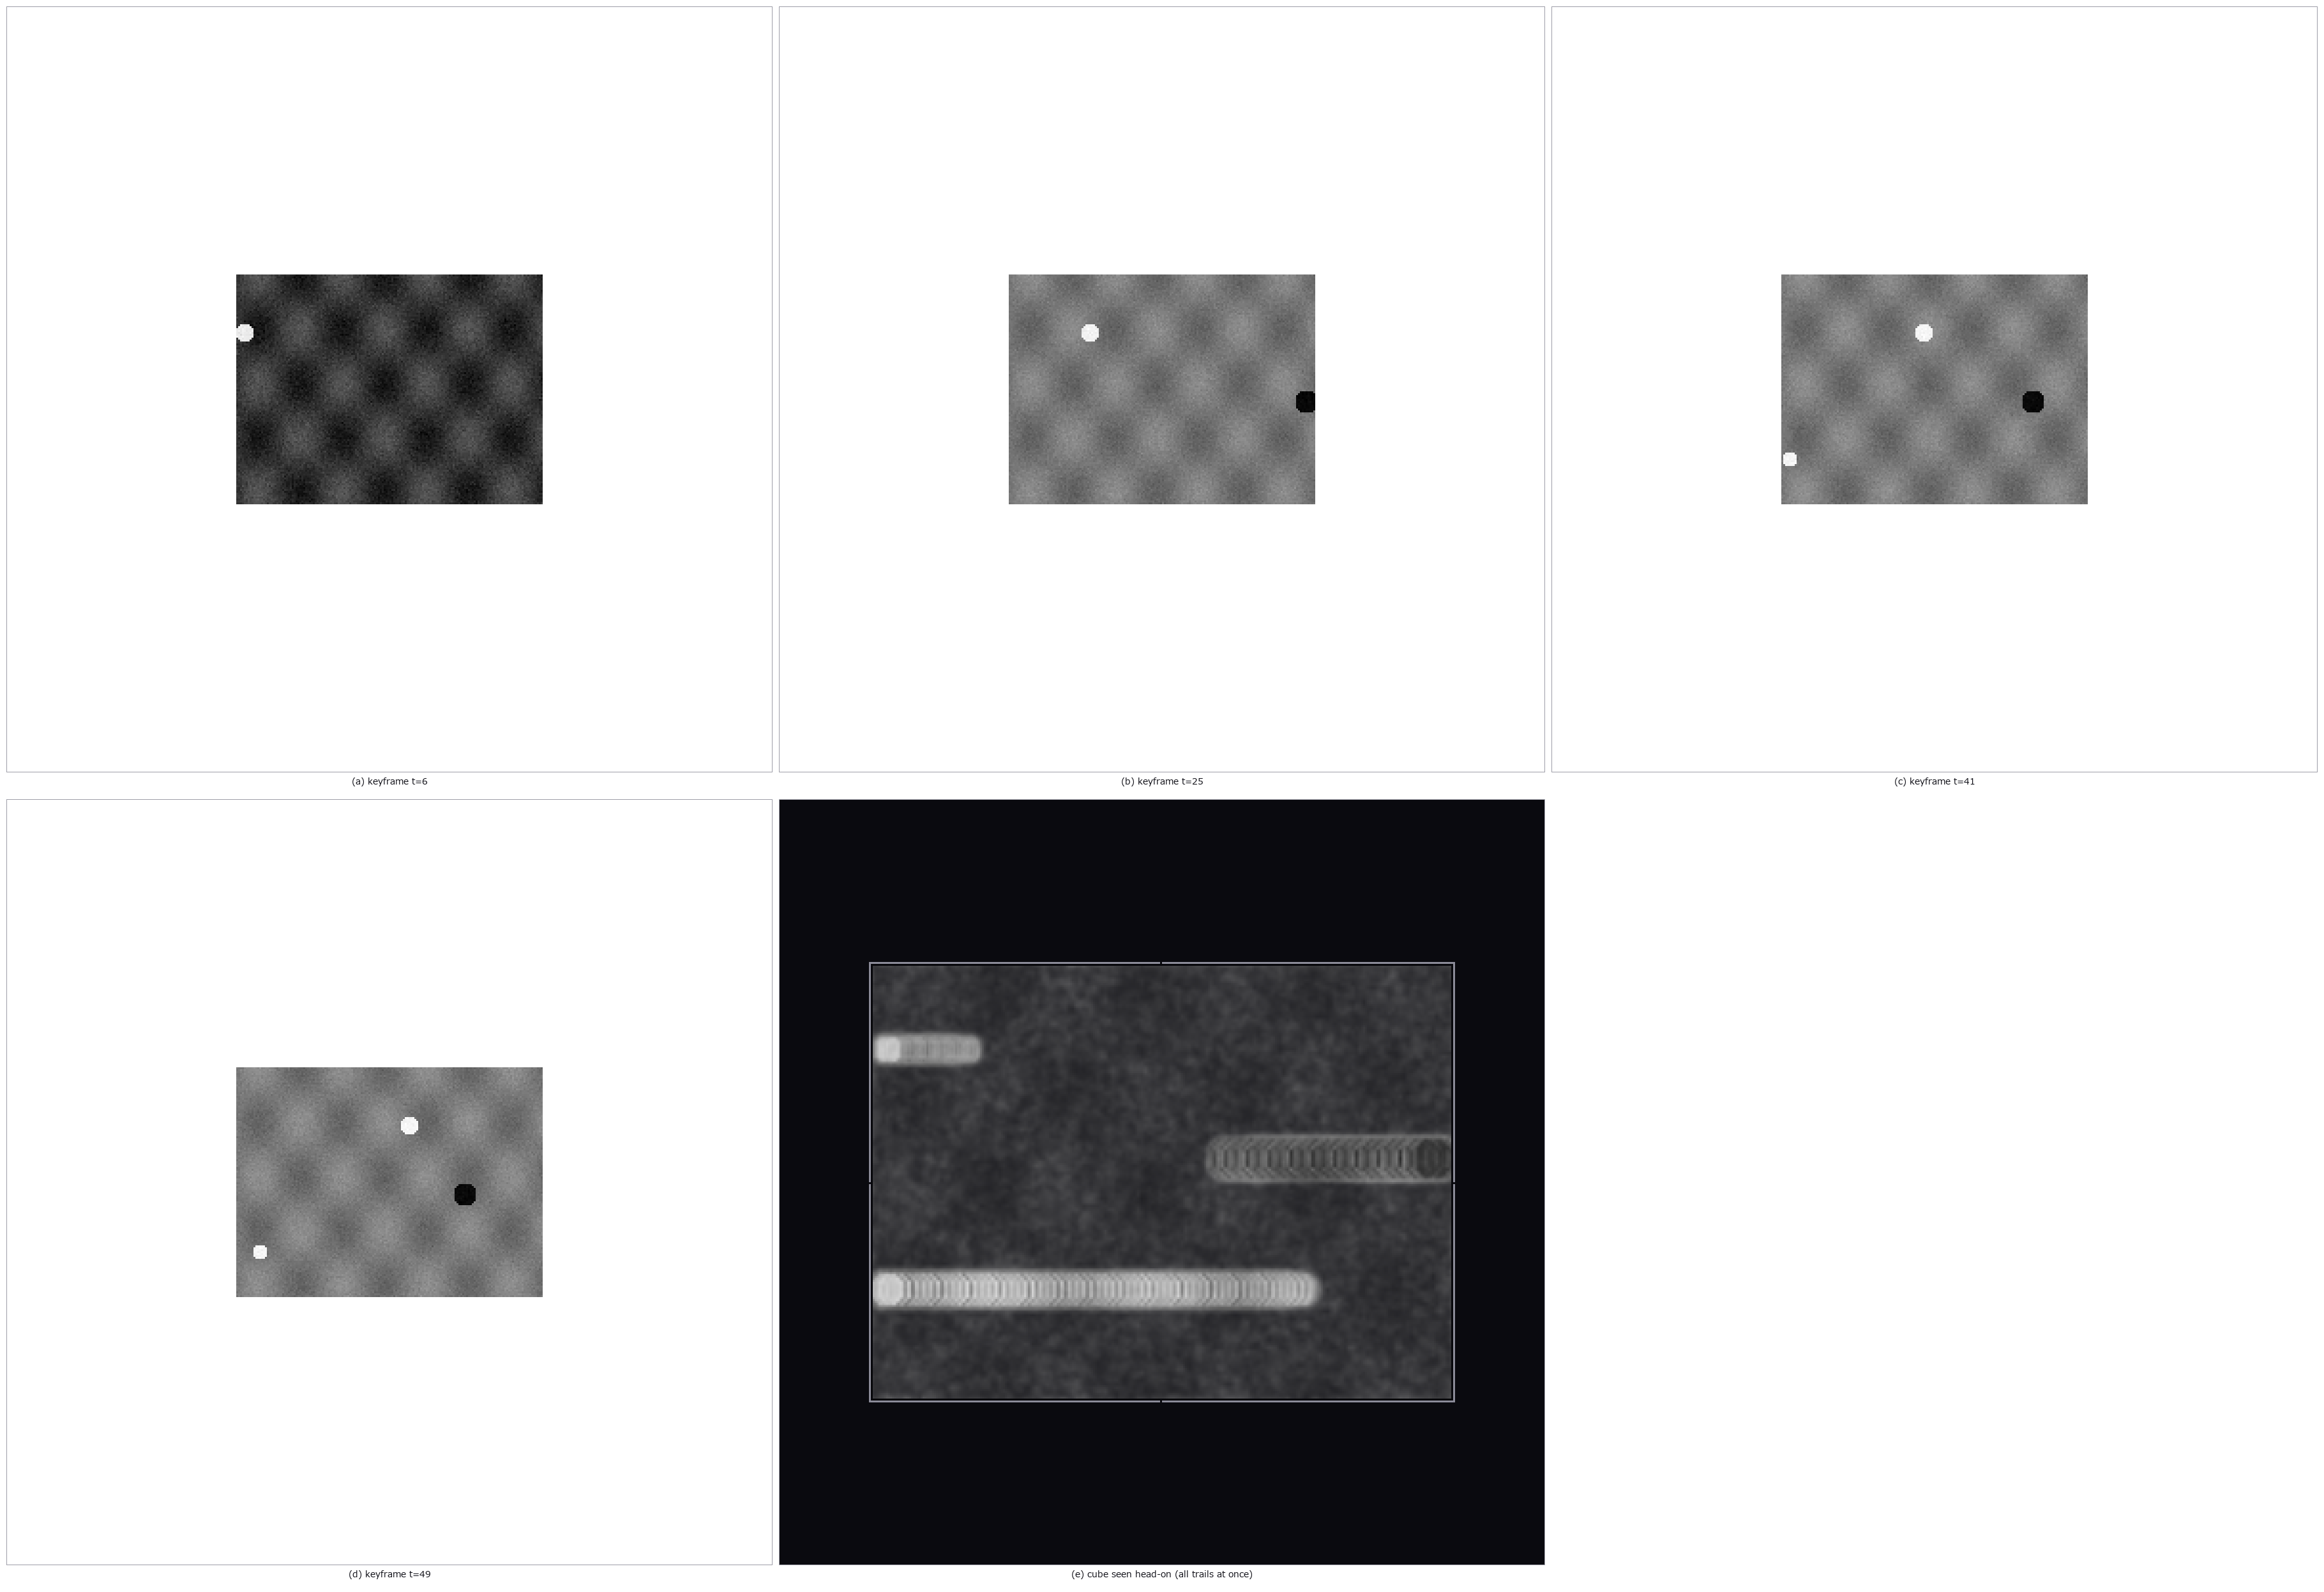
↑ video_summary_keyframes picks the frames right after each object appears; the head-on cube is the whole clip in one image
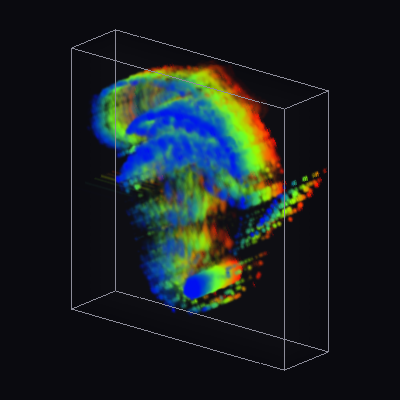
↑ a real clip from this repo (a turntable GIF, 40 frames of 160x160): a rotating object becomes a helix in the space-time cube
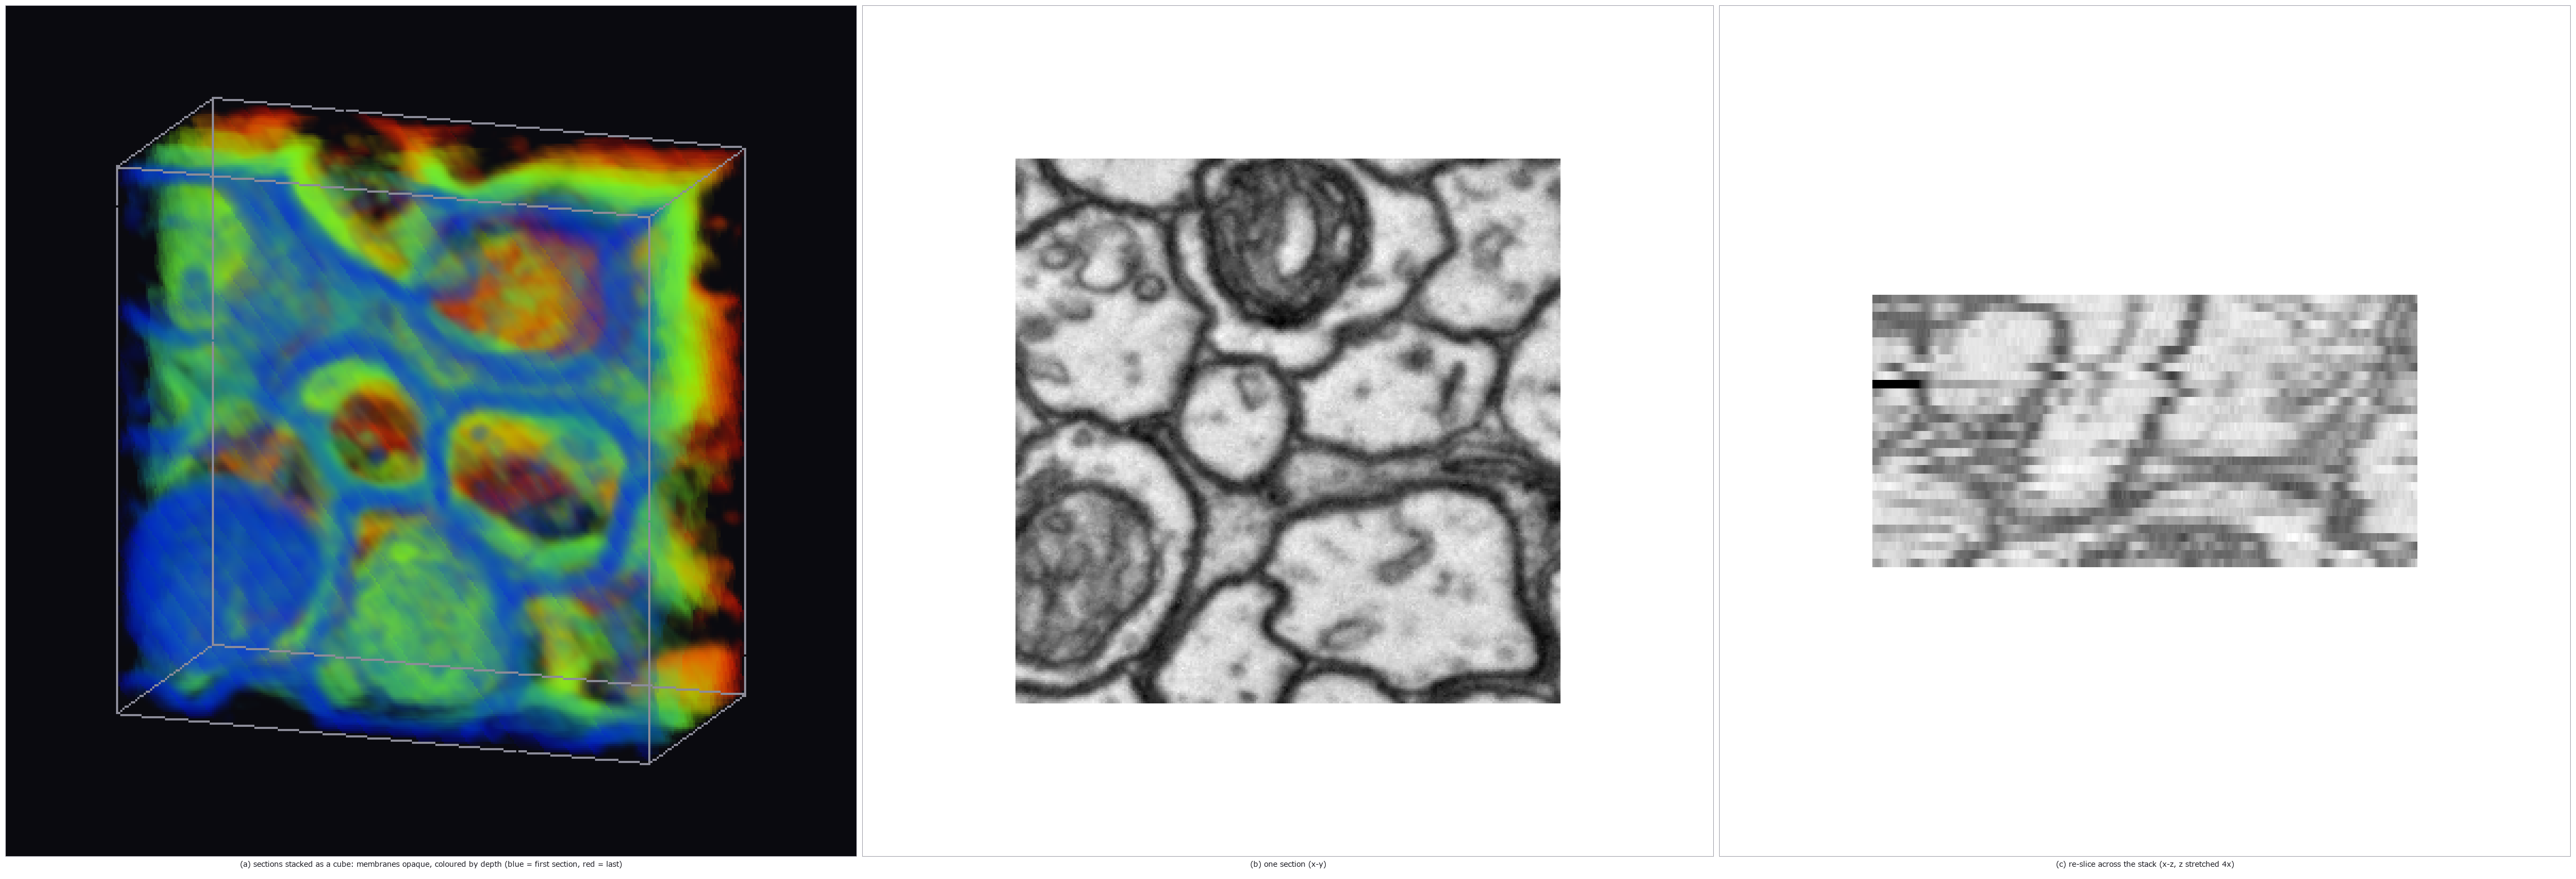
↑ the same cube operators on a z-stack of EM sections (CREMI sample A, 32 sections of 256^2 (adult Drosophila FAFB)): membranes become tubes running thr…
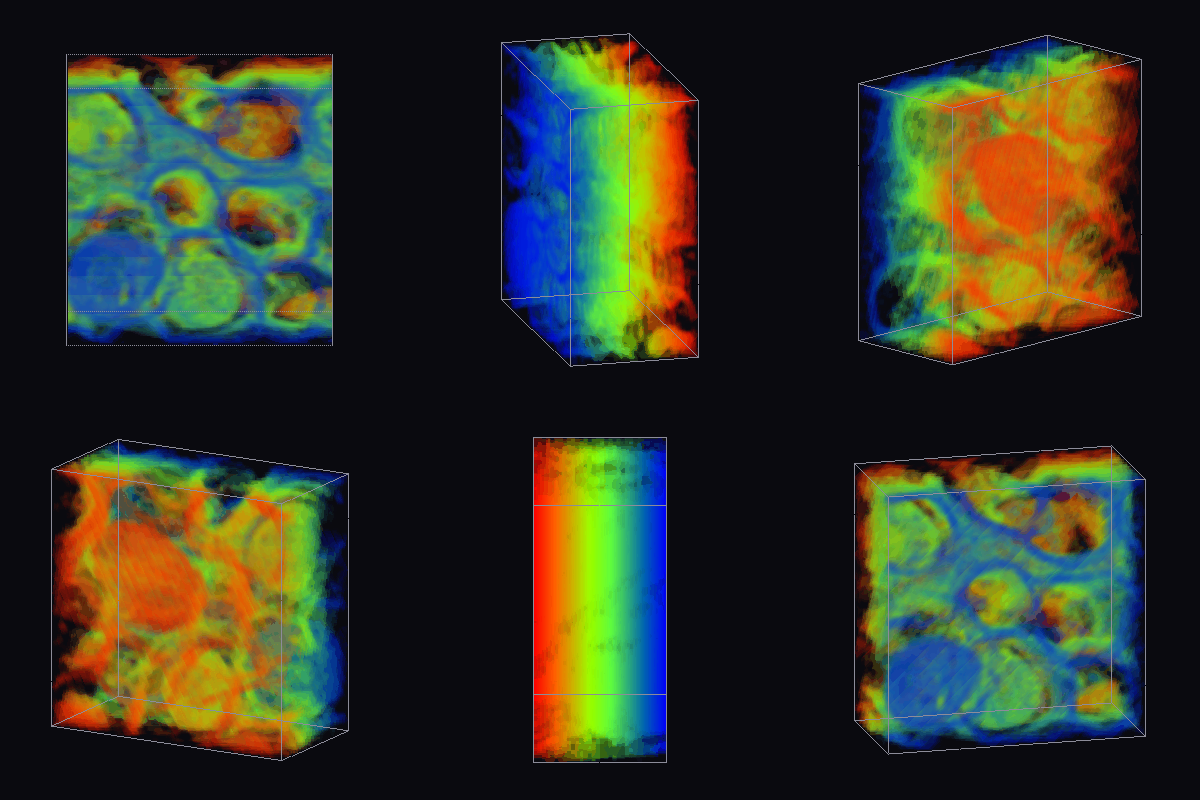
↑ The animation ―― the EM stack rotating: neurites are the tubes, coloured by depth; the same operator that rotated the surveillance clip
py -3.11 examples/poc_video_cube.py
Source: examples/poc_video_cube.py
This run produced 7 figures in total - see them all
Ops used (notes): intensity · video_cube_cut · video_cube_orbit · video_spacetime_cube · video_summary_keyframes · video_write_gif · vol_render_transfer
No.2026.128 —— Living Tissue in 3D+t Without a Generator — Magnify, Flow, Interpolate, Height, All Against Truth
A video generator invents plausible motion. The new family live4d (14 ops, numpy + scipy only, one new word: volseq = a volume series (T, Z, Y, X)) invents nothing; instead it offers four ways to make real motion visible, each pinned to numbers on synthetic series with known truth. (1) Magnify: a shell whose radius beats by 0.1 voxel (invisible) is magnified x8 by volseq_magnify_motion (a 3-D version of Wu et al.’s linear Eulerian magnification); the radius amplitude read back is 7.89 x and the period is unchanged. (2) Flow: the displacement field of two blobs separating at a known ±0.75 voxel/frame (vol_flow_3d, 3-D Lucas–Kanade) reads +0.776 / −0.776 where there is gradient, and the pathlines (volseq_pathline_render) become one solid coloured by time. (3) Interpolate: a series made at twice the rate, halved and refilled by volseq_interpolate_flow, matches the removed frames with RMSE 0.0016 when the motion per step is twice the blob size (a linear blend: 0.0207) — while below about 0.8 sigma per step the blend is as good and the warp’s resampling costs a little (plotted honestly). (4) Height: from a focus-sweep series (a moving bump) focus_sweep_height_video recovers the height field with RMSE 0.31 planes. Live cells in 3D+t from the Cell Tracking Challenge (Fluo-N3DH-CHO, raw data never committed) run through the same path.
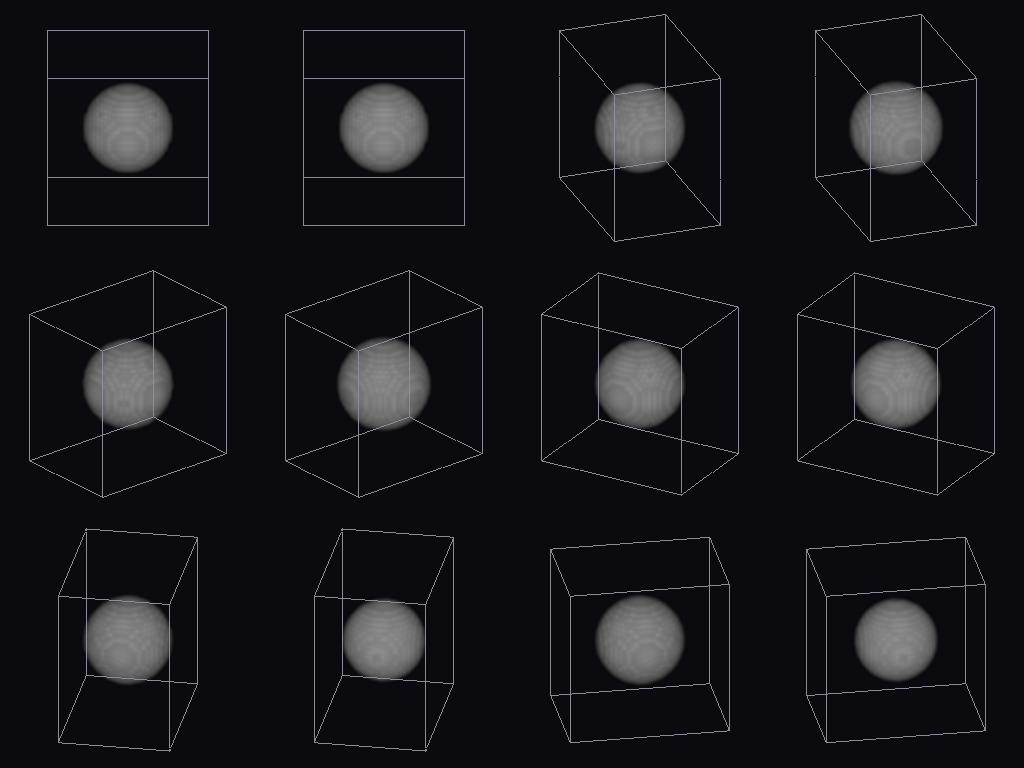
↑ Living Tissue in 3D+t Without a Generator — Magnify, Flow, Interpolate, Height, All Against Truth ―― A video generator invents plausible motion. The new family live4d (14 ops, numpy + scipy only, one new word: volseq = a volume series (T, Z, Y, X)) invents nothing; instead it offers four ways to make real motion visible, each pinned to numbers on synthetic series with known truth. (1) Magnify: a shell whose radius beats by 0.1 voxel (invisible) is magnified x8 by volseq_magnify_motion (a 3-D version of Wu et al.’s linear Eulerian magnification); the radius amplitude read back is 7.89 x and the period is unchanged. (2) Flow: the displacement field of two blobs separating at a known ±0.75 voxel/frame (vol_flow_3d, 3-D Lucas–Kanade) reads +0.776 / −0.776 where there is gradient, and the pathlines (volseq_pathline_render) become one solid coloured by time. (3) Interpolate: a series made at twice the rate, halved and refilled by volseq_interpolate_flow, matches the removed frames with RMSE 0.0016 when the motion per step is twice the blob size (a linear blend: 0.0207) — while below about 0.8 sigma per step the blend is as good and the warp’s resampling costs a little (plotted honestly). (4) Height: from a focus-sweep series (a moving bump) focus_sweep_height_video recovers the height field with RMSE 0.31 planes. Live cells in 3D+t from the Cell Tracking Challenge (Fluo-N3DH-CHO, raw data never committed) run through the same path.
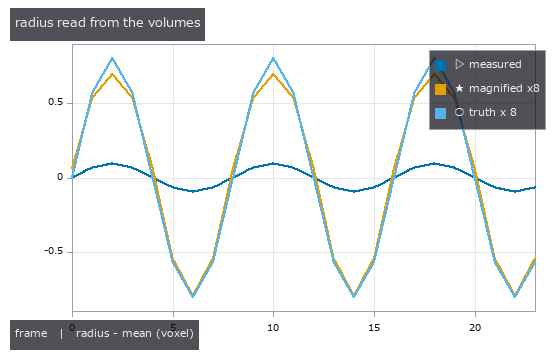
↑ The measurement ―― radius of the shell read from each volume: the measured beat (0.10 voxel) is below one voxel; after magnification it follows alpha x truth (figure labels are in Japanese; the numbers are the same)
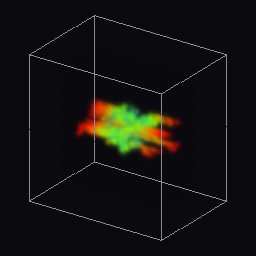
↑ pathlines of particles carried by the 3-D flow of the dividing blob, coloured by time (blue = start, red = end); the faint grey is the first volume

↑ a frame removed from a 2x-rate series (motion 5 voxel = 2 sigma per step) re-created two ways (max projections): the linear blend shows two ghosts per…
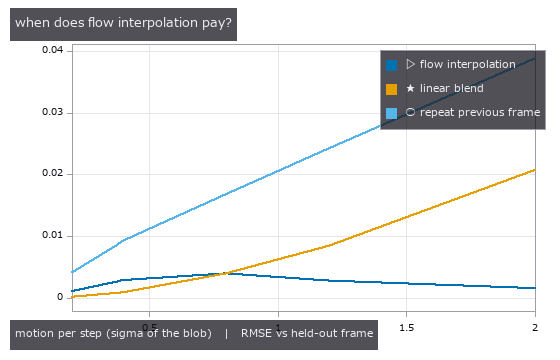
↑ error of the re-created frames against the removed ones, as the motion per step grows: below about one blob width a linear blend is as good (the warp’…
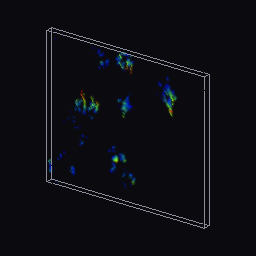
↑ Fluo-N3DH-CHO/01 (12 volumes of (5, 111, 128), y/x 1/4): pathlines of the 3-D flow between consecutive volumes, coloured by time
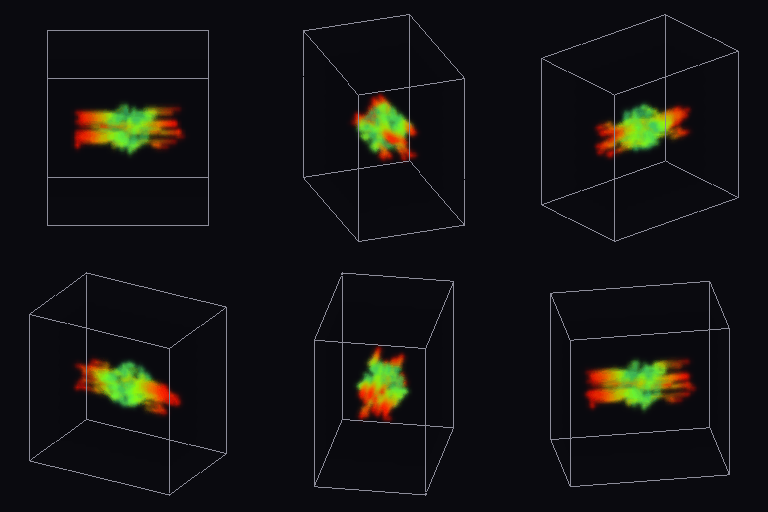
↑ The animation ―― the same pathlines orbited: two straight bundles leaving the split point at +/-0.75 voxel/frame

↑ The animation ―― height field recovered from a focus sweep series (a moving bump, 11 planes), shaded and coloured by height (blue = low, red = high); RMSE 0.31 planes
↑ The animation ―― Fluo-N3DH-CHO/01 (12 volumes of (5, 111, 128), y/x 1/4): the live volumes orbited while time advances (intensity as opacity)
py -3.11 examples/poc_live4d.py
Source: examples/poc_live4d.py
This run produced 10 figures in total - see them all
Ops used (notes): blend · focus_sweep_height_video · focus_sweep_surface_video · vol_flow_3d · volseq_interpolate_flow · volseq_magnify_motion · volseq_pathline_orbit · volseq_pathline_render · volseq_render_orbit · volseq_synth_beating · volseq_synth_dividing
No.2026.206 —— Transcribing a Diabolo Model from the Paper and Checking It, then Reading Axis, Spin and Tension from Synthetic Video — Eq. (1b) as Printed Is Dimensionally Wrong and Gives NaN at the Real Dimensions; Closed Forms, an Exact String and MuJoCo as the Truth
| The physics-simulation × Fullseye series. The primary source is the LaTeX source of an analytic diabolo model for robot learning (von Drigalski et al., ICRA 2021, arXiv:2011.09068; the state-transition conditions exist only in a figure, which was read as an image). The public implementation (BSD-3) was read for comparison only; no code was copied. The model is a point mass + an auxiliary spheroid formed by the string + gravity; one step = forward Euler → project back if outside the spheroid → spin by eq. (2) ω_t = ω_{t−1} + μ Δ_string. Learning-free, all rules. New module diabolo, 16 ops plus 1 mujoco facade. ★Where the paper as printed does not hold (found by transcribing it and putting gates on it): (1) eq. (1b) b = √(a² − | x_L − x_R | /2) subtracts a length from a squared length; at the paper’s real dimensions (string 1.45 m, stick gap 1.10 m) the radicand is negative = NaN. Fixed with the ellipse identity a² = b² + c² (at 0.3 m the printed form gives 0.613 m, the correct value is 0.709 m). (2) LOOSE → ON with s < c_F as drawn overlaps the ON → LOOSE band and flips every step → read as s ≤ c_L. (3) Eq. (2) telescopes and is step-independent (16.57 → 16.59 rad/s for 2 → 1 ms steps), whereas the public implementation’s spin rule scales inversely with the step (ratio 2.02); with μ = 1/r, eq. (2) equals rolling without slipping. (4) The public implementation’s normal is not the gradient and is off by up to 12.2° — here the nearest point and the true normal are used, as in the text. Ground truth comes from outside on three fronts. (1) Closed forms: the focal identity d_L + d_R = l (7.5e-16), the forward-Euler drift g t dt/2 in flight, pendulum periods 2π√(b/g) = 1.379 s sideways and 2π√(a²/(bg)) = 2.116 s lengthwise, the static tension m g a/(2b), and the catch time of parabola × spheroid × the plane through the sticks (closed form 0.7214 s, paper model 0.7230 s). (2) An exact string model (our addition): the unilateral constraint d_L + d_R ≤ l of an inextensible string by RATTLE, with an energy spread of 5.3e-6, a power balance of 1.1e-4 and the tension multiplier matching the closed form to 3.6e-11. (3) A second implementation = MuJoCo spatial tendons (–full): within 0.62 / 1.15 / 3.10 mm of the exact string for linear acceleration / swing / throw (excluding 0.3 s after the catch — MuJoCo’s soft constraint bounces 40 mm), static tension 3.5e-7. Vision is learning-free (ray-traced synthetic video): the axis and centre come from fitting the exact perspective polygon moments of two circles — the near cup rim and the bottom plate — to the mask moments (42 poses, 0–38° from the line of sight × 6 azimuths: max 0.295°, median 0.059°, centre 0.7 mm); at 45° the bottom plate is hidden by the wall and a 2.80 px residual raises the alarm. Spin comes from the phase of markers on the inner surface plus the width of the motion-blur arc to pick the branch (120 fps, 2 ms exposure: 10–110 rev/s within 0.81 %; phase alone folds 70 / 90 / 110 rev/s, beyond the 60 rev/s Nyquist, to −50 / −30 / −10 = the wagon-wheel illusion). Tension comes from the V of stick-tip markers and the axle (0.46 % from the closed form). Tracking a throw (3 m away, 41 frames) gives a centre RMS of 8.9 mm and a median axis error of 1.71°, and the state machine run on the tracked positions agrees 100 % with the true states. Figures: a GIF of the throw with the axis read from the image, the true axis, the state and a 3× inset; the sag (fixed vs printed equation, the NaN boundary); tension (closed form, exact string, image, MuJoCo); heights and differences of the three models; the step dependence of the spin rules; with –full: a GIF of the spin illusion (phase only vs branch picked by the blur arc), a table of axis errors (tilt × azimuth) and a table of where it breaks. 18 gates (default, 3.1 s) plus 7 with –full (42 s). Honestly: the outside truths are the paper’s equations, closed forms and MuJoCo only; nothing is matched against real footage or public data (errors in the equations were found, but whether the model fits a real diabolo is not checked). The μ and damping of eq. (2) and the attitude (tilt and precession) are in neither the paper nor the model; the axis read from the image is the pose given at render time, not a result of the dynamics. Rendering is idealised (flat colours, Lambert shading, plain background), and the axis estimate needs the inside of the near cup to be visible (up to 38°). The string is a point; wrapping on the axle, string mass and stretch are not modelled. Traps we hit: the throw-tracking centre error was printed in metres labelled as mm (100× better than at close range was the giveaway), threshold-based marker detection dropped to zero above 30 rev/s under motion blur, and the exact model and MuJoCo were first built as a bead threaded on the string, which bounced at the apex. |
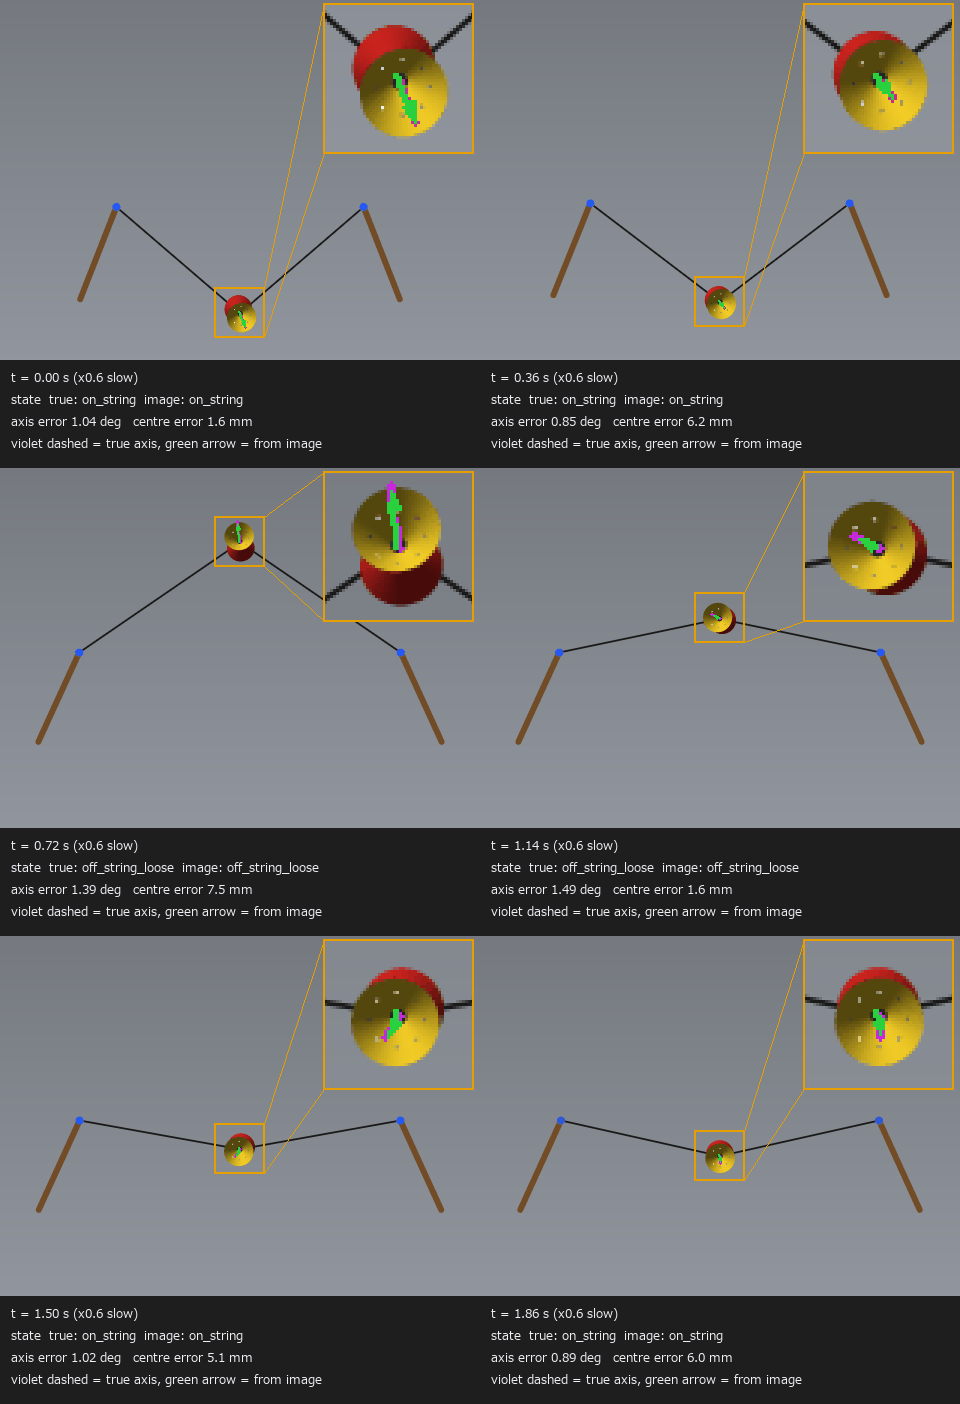
| *↑ Transcribing a Diabolo Model from the Paper and Checking It, then Reading Axis, Spin and Tension from Synthetic Video — Eq. (1b) as Printed Is Dimensionally Wrong and Gives NaN at the Real Dimensions; Closed Forms, an Exact String and MuJoCo as the Truth ―― The physics-simulation × Fullseye series. The primary source is the LaTeX source of an analytic diabolo model for robot learning (von Drigalski et al., ICRA 2021, arXiv:2011.09068; the state-transition conditions exist only in a figure, which was read as an image). The public implementation (BSD-3) was read for comparison only; no code was copied. The model is a point mass + an auxiliary spheroid formed by the string + gravity; one step = forward Euler → project back if outside the spheroid → spin by eq. (2) ω_t = ω_{t−1} + μ Δ_string. Learning-free, all rules. New module diabolo, 16 ops plus 1 mujoco facade. ★Where the paper as printed does not hold (found by transcribing it and putting gates on it): (1) eq. (1b) b = √(a² − | x_L − x_R | /2) subtracts a length from a squared length; at the paper’s real dimensions (string 1.45 m, stick gap 1.10 m) the radicand is negative = NaN. Fixed with the ellipse identity a² = b² + c² (at 0.3 m the printed form gives 0.613 m, the correct value is 0.709 m). (2) LOOSE → ON with s < c_F as drawn overlaps the ON → LOOSE band and flips every step → read as s ≤ c_L. (3) Eq. (2) telescopes and is step-independent (16.57 → 16.59 rad/s for 2 → 1 ms steps), whereas the public implementation’s spin rule scales inversely with the step (ratio 2.02); with μ = 1/r, eq. (2) equals rolling without slipping. (4) The public implementation’s normal is not the gradient and is off by up to 12.2° — here the nearest point and the true normal are used, as in the text. Ground truth comes from outside on three fronts. (1) Closed forms: the focal identity d_L + d_R = l (7.5e-16), the forward-Euler drift g t dt/2 in flight, pendulum periods 2π√(b/g) = 1.379 s sideways and 2π√(a²/(bg)) = 2.116 s lengthwise, the static tension m g a/(2b), and the catch time of parabola × spheroid × the plane through the sticks (closed form 0.7214 s, paper model 0.7230 s). (2) An exact string model (our addition): the unilateral constraint d_L + d_R ≤ l of an inextensible string by RATTLE, with an energy spread of 5.3e-6, a power balance of 1.1e-4 and the tension multiplier matching the closed form to 3.6e-11. (3) A second implementation = MuJoCo spatial tendons (–full): within 0.62 / 1.15 / 3.10 mm of the exact string for linear acceleration / swing / throw (excluding 0.3 s after the catch — MuJoCo’s soft constraint bounces 40 mm), static tension 3.5e-7. Vision is learning-free (ray-traced synthetic video): the axis and centre come from fitting the exact perspective polygon moments of two circles — the near cup rim and the bottom plate — to the mask moments (42 poses, 0–38° from the line of sight × 6 azimuths: max 0.295°, median 0.059°, centre 0.7 mm); at 45° the bottom plate is hidden by the wall and a 2.80 px residual raises the alarm. Spin comes from the phase of markers on the inner surface plus the width of the motion-blur arc to pick the branch (120 fps, 2 ms exposure: 10–110 rev/s within 0.81 %; phase alone folds 70 / 90 / 110 rev/s, beyond the 60 rev/s Nyquist, to −50 / −30 / −10 = the wagon-wheel illusion). Tension comes from the V of stick-tip markers and the axle (0.46 % from the closed form). Tracking a throw (3 m away, 41 frames) gives a centre RMS of 8.9 mm and a median axis error of 1.71°, and the state machine run on the tracked positions agrees 100 % with the true states. Figures: a GIF of the throw with the axis read from the image, the true axis, the state and a 3× inset; the sag (fixed vs printed equation, the NaN boundary); tension (closed form, exact string, image, MuJoCo); heights and differences of the three models; the step dependence of the spin rules; with –full: a GIF of the spin illusion (phase only vs branch picked by the blur arc), a table of axis errors (tilt × azimuth) and a table of where it breaks. 18 gates (default, 3.1 s) plus 7 with –full (42 s). Honestly: the outside truths are the paper’s equations, closed forms and MuJoCo only; nothing is matched against real footage or public data (errors in the equations were found, but whether the model fits a real diabolo is not checked). The μ and damping of eq. (2) and the attitude (tilt and precession) are in neither the paper nor the model; the axis read from the image is the pose given at render time, not a result of the dynamics. Rendering is idealised (flat colours, Lambert shading, plain background), and the axis estimate needs the inside of the near cup to be visible (up to 38°). The string is a point; wrapping on the axle, string mass and stretch are not modelled. Traps we hit: the throw-tracking centre error was printed in metres labelled as mm (100× better than at close range was the giveaway), threshold-based marker detection dropped to zero above 30 rev/s under motion blur, and the exact model and MuJoCo were first built as a bead threaded on the string, which bounced at the apex.* |

↑ The measurement ―― 式 (1b) の原文 √(a² − d/2) は長さと長さの 2 乗の差で次元が合わず、d > 2a² = 1.051 m で NaN(論文の実機の間隔 1.10 m は NaN の側)。直した √(a² − c²)(楕円の恒等式)が実線。 (figure labels are in Japanese; the numbers are the same)

↑ 閉形式 T = m g a/(2b)(破線)に、厳密な糸の模型の乗数と、合成映像の棒の先と軸の V 字から読んだ張力(最大 0.46 % 差)を重ねる。

↑ 同じ棒の動き(0.30〜0.50 s で開いて持ち上げ、張りつめたまま受ける)での高さ。

↑ 式 (2) は望遠鏡和なので刻み 1 ms と 0.5 ms の線が重なる。

↑ 視線からの傾き × 像の上の方位で、画像だけから読んだ軸と描いた時の軸の角(縁の半径 ≈ 48 px)。
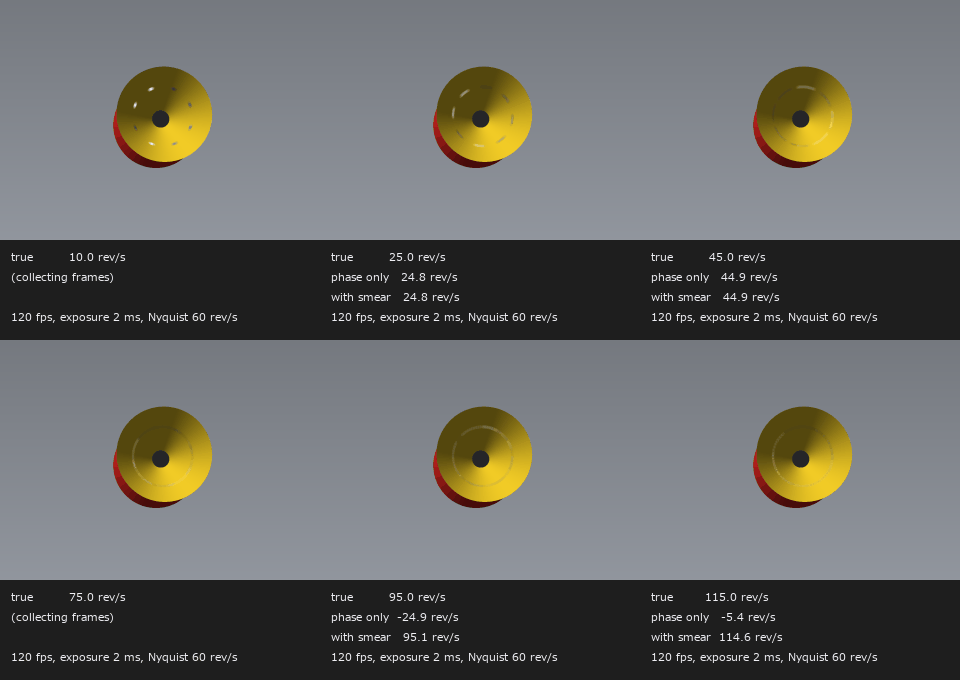
↑ The animation ―― 回転を上げると 120 fps の像ではマーカーが止まり、逆に回って見える(車輪の錯視)。位相だけの読みはナイキスト 60 rev/s で折り返し、回転ぶれの弧の幅で枝を選んだ読みは真値に付いていく(320 × 240、等倍)。
py -3.11 examples/poc_diabolo_model_and_vision.py
Source: examples/poc_diabolo_model_and_vision.py
This run produced 9 figures in total - see them all
Ops used (notes): arrow · diabolo_axis_from_image · diabolo_camera · diabolo_dynamics_step · diabolo_marker_phase · diabolo_params · diabolo_render · diabolo_scene_mjcf · diabolo_simulate · diabolo_spheroid · diabolo_spin_from_markers · diabolo_state_sequence · diabolo_throw_catch_truth · diabolo_track · measure_text · spheroid_closest · string_tension_from_sag · string_tension_static · text_box · zoom_inset
No.2026.213 —— A Swarm That Flows Like a Fluid Senses an Invisible Obstacle from the Disturbance of Its Velocity Field Alone — Reading the Impact Point and the Obstacle Outline by Tracking and PIV (particle image velocimetry) on Overhead Video, from Upstream Before Contact, and Saying Nothing When There Is No Obstacle
| Move the robots of a swarm as SPH (smoothed-particle hydrodynamics) particles and the slowdown of the individuals that hit an obstacle travels upstream as a crowding pressure; around a cylinder the swarm then flows approximately as a potential flow (a weakly compressible swarm with a strong pull back to the free stream is a Darcy flow — a derivation). The new module swarmflow (12 ops) measures the velocity field from overhead video, either by detecting and tracking individuals (blob2d) or by cross-correlation PIV (pivops), and reads the impact point (the stagnation point) and the obstacle’s centre and radius from how the flow falls short of the free stream. The references are closed forms: potential flow around a cylinder (surface speed off 2U | sin θ | by 2e-7), the normalisation ∫W dV = 1 of the SPH cubic-spline kernel (within 1e-12 in 1, 2 and 3 dimensions), and Ritter’s dam-break solution. On the closed-form field the 2-D fit is exact, and linearising 1/√d along the centre line gives the centre to 0.30 % of R and the radius to +0.09 % (taking the speed at the upstream edge as U gives −16 % — the cylinder’s deficit only decays as 1/r², so U is divided back out by the closed form, iteratively). From particle video, PIV gives a velocity rms of 2.1 % of U and a radius of −0.6 %; tracking gives 3.3 % and +0.3 %. On noise only, a vortex or a source, the explained fraction is 0.002–0.080 and nothing is claimed; with an obstacle it is at least 0.761 (threshold 0.5). PIV on a lattice-like swarm grows correlation peaks at the neighbouring lattice positions: 25 % rms unchecked, 2.9 % with a peak ratio of 1.1 and a median test. In a simulated swarm of 1,692 individuals the velocity measured from video matches the individuals’ true velocity to 1.4 % rms, and a fit to the upstream side only (before contact) gives the centre to 4.5 % of R and the radius to −10 %; with no obstacle it claims nothing (0.017). Honestly: a swarm is not an exact potential flow — an empty wake stretches behind the obstacle, the surface speed reaches about 1.3U rather than 2U, and the radius comes out 10 % small. The overhead video does show the hole at the obstacle; the estimate does not use it and reads the velocities alone (the value is knowing before contact). Circular obstacles only, with the free stream along +x. |

| *↑ A Swarm That Flows Like a Fluid Senses an Invisible Obstacle from the Disturbance of Its Velocity Field Alone — Reading the Impact Point and the Obstacle Outline by Tracking and PIV (particle image velocimetry) on Overhead Video, from Upstream Before Contact, and Saying Nothing When There Is No Obstacle ―― Move the robots of a swarm as SPH (smoothed-particle hydrodynamics) particles and the slowdown of the individuals that hit an obstacle travels upstream as a crowding pressure; around a cylinder the swarm then flows approximately as a potential flow (a weakly compressible swarm with a strong pull back to the free stream is a Darcy flow — a derivation). The new module swarmflow (12 ops) measures the velocity field from overhead video, either by detecting and tracking individuals (blob2d) or by cross-correlation PIV (pivops), and reads the impact point (the stagnation point) and the obstacle’s centre and radius from how the flow falls short of the free stream. The references are closed forms: potential flow around a cylinder (surface speed off 2U | sin θ | by 2e-7), the normalisation ∫W dV = 1 of the SPH cubic-spline kernel (within 1e-12 in 1, 2 and 3 dimensions), and Ritter’s dam-break solution. On the closed-form field the 2-D fit is exact, and linearising 1/√d along the centre line gives the centre to 0.30 % of R and the radius to +0.09 % (taking the speed at the upstream edge as U gives −16 % — the cylinder’s deficit only decays as 1/r², so U is divided back out by the closed form, iteratively). From particle video, PIV gives a velocity rms of 2.1 % of U and a radius of −0.6 %; tracking gives 3.3 % and +0.3 %. On noise only, a vortex or a source, the explained fraction is 0.002–0.080 and nothing is claimed; with an obstacle it is at least 0.761 (threshold 0.5). PIV on a lattice-like swarm grows correlation peaks at the neighbouring lattice positions: 25 % rms unchecked, 2.9 % with a peak ratio of 1.1 and a median test. In a simulated swarm of 1,692 individuals the velocity measured from video matches the individuals’ true velocity to 1.4 % rms, and a fit to the upstream side only (before contact) gives the centre to 4.5 % of R and the radius to −10 %; with no obstacle it claims nothing (0.017). Honestly: a swarm is not an exact potential flow — an empty wake stretches behind the obstacle, the surface speed reaches about 1.3U rather than 2U, and the radius comes out 10 % small. The overhead video does show the hole at the obstacle; the estimate does not use it and reads the velocities alone (the value is knowing before contact). Circular obstacles only, with the free stream along +x.* |
Terms: PIV — A flow-measurement method that estimates a velocity field from the displacement of particle patterns between images separated by a short time.
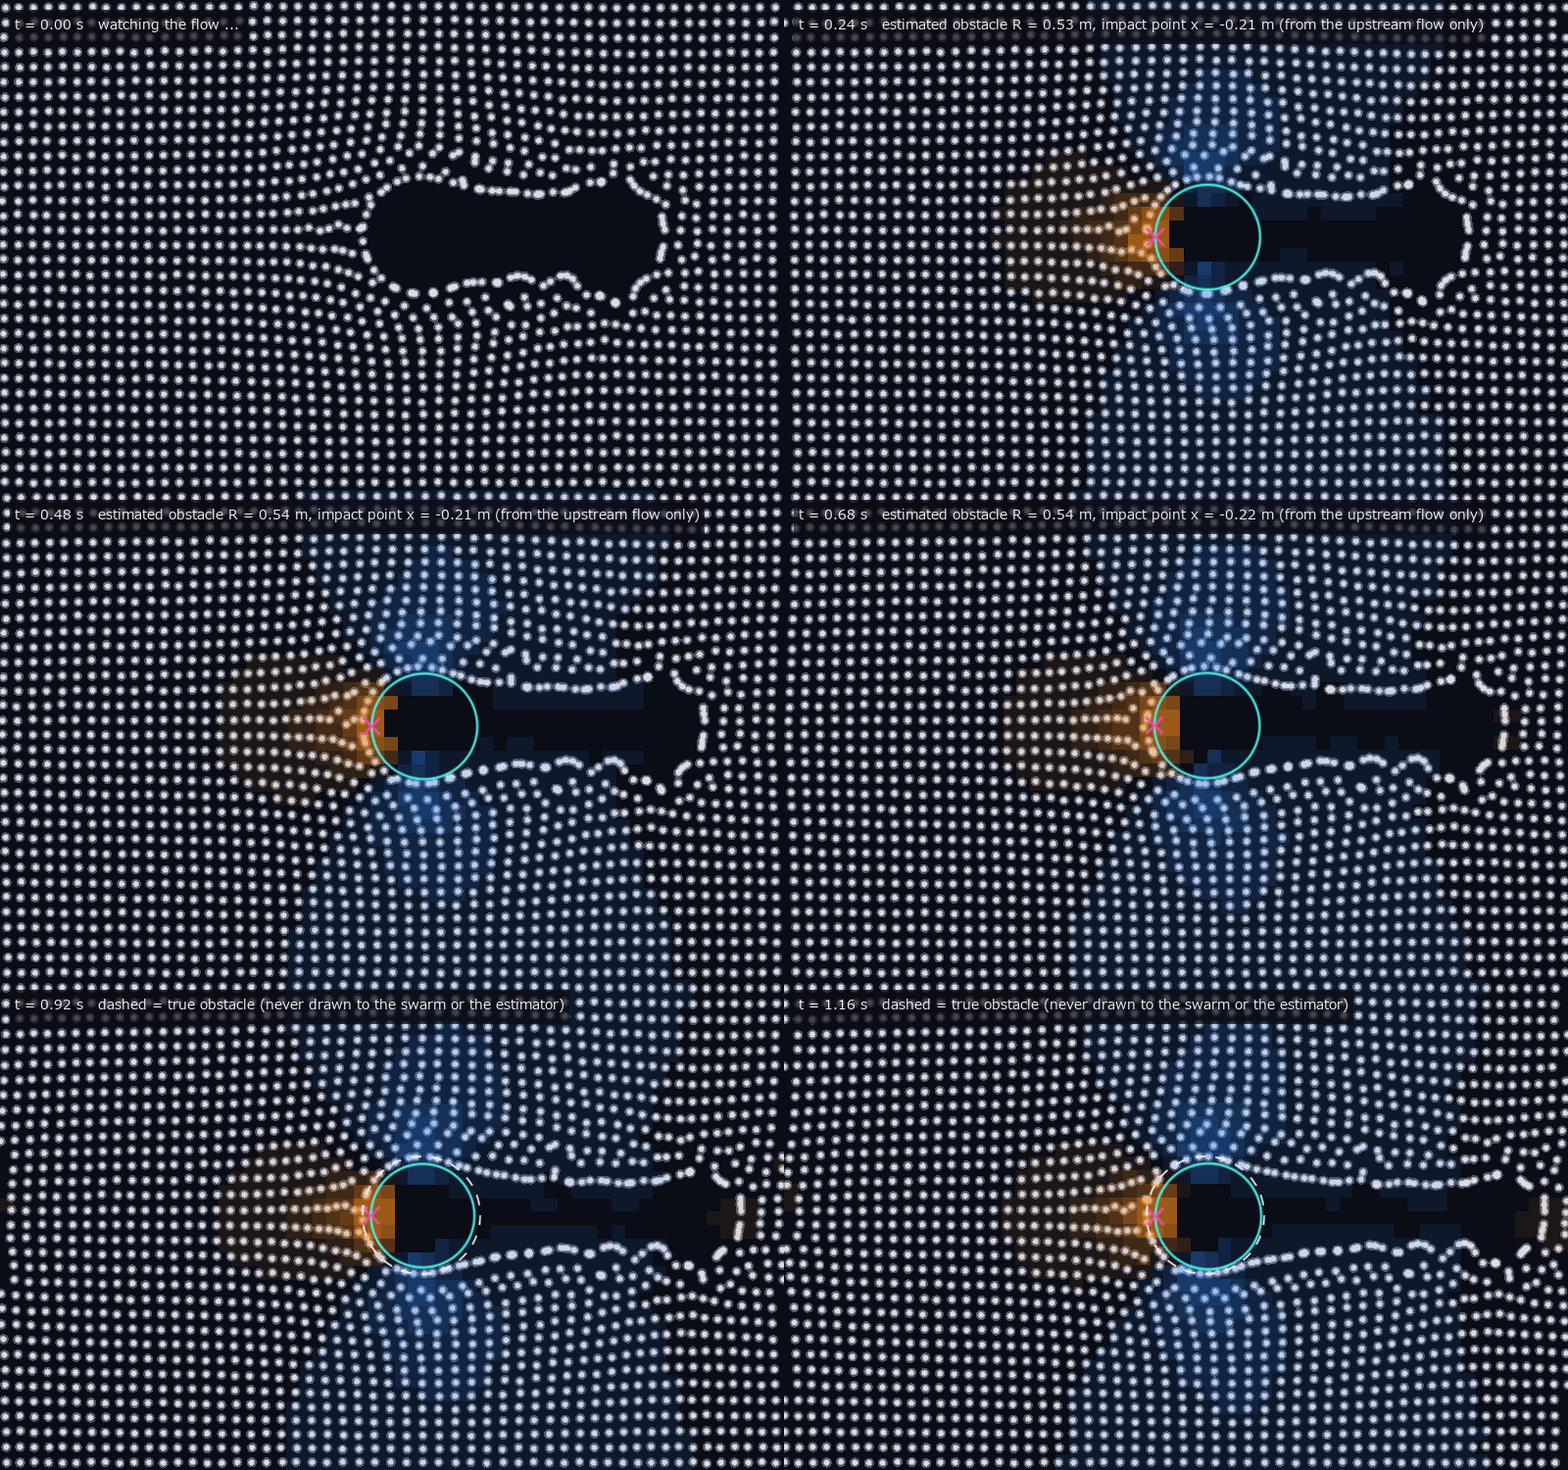
↑ The measurement ―― 群れ(白い点、1692 個体)が左から右へ流れる。障害物は描いていない —— 群れには当たる壁として効くだけ。直近 10 コマの個体の追跡から速度場を作り、自由流より遅い所を橙、速い所を青で塗る。上流だけの当てはめで推定した障害物の輪郭(水色の輪)と衝突点(桃色の×)が浮かび上がる。最後の 8 コマで真の障害物を白の破線で重ねる(半径は 1 割ほど小さめに出る —— 群れの流れは厳密なポテンシャル流ではないため)。 (figure labels are in Japanese; the numbers are the same)

↑ 中心線の上の欠損 d = R²/(x − x_c)² は 1/√d にすると直線になり(傾き −1/R)、1/√d = 1 の所がよどみ点(衝突点)。

↑ 個体を減らすと間隔 s が広がる。

↑ ゲートを開けた群れの広がりの模型(1 次元 SPH の浅水、400 粒子)。
py -3.11 examples/poc_swarm_obstacle_from_flow.py
Source: examples/poc_swarm_obstacle_from_flow.py
This run produced 5 figures in total - see them all
Ops used (notes): blob_label · obstacle_fit_doublet · piv_cross_correlate · potential_flow_cylinder · ritter_dam_break · sph_dam_break_1d · sph_kernel · stagnation_from_centerline · swarm_field_from_piv · swarm_field_from_tracks · swarm_render_overhead · swarm_simulate · text_box · velocity_deficit_map
No.2026.170 —— Measuring a Table-Tennis Ball the Way the Pioneers Did — Multi-Camera Tracking, Triangulation, Trajectory Prediction, Bounce and Spin, Scored by Theorems on a Table with Ground Truth
| Robot table tennis has had the same visual stance since 1988: find the ball in several cameras, triangulate it into a 3-D point, look ahead with an equation of motion that includes drag and Magnus lift, predict across the bounce and, if you can, measure spin from the markings. This exhibit builds that whole chain from numpy ops and scores it against a truth the world itself holds (ball centre, pose, contact time and angular velocity are formulas fixed at generation). First the theorems of mechanics: with drag and Magnus set to zero the RK4 flight matches the closed-form parabola to 1e-12, and the least-squares parabola returns g = 9.81 to 4.0e-15. Over 500 random impacts (e ∈ [0.3, 1], μ ∈ [0, 0.6]) the angular momentum about the contact point is conserved to a relative 4.9e-16 at worst, 136 impacts reach rolling and 364 keep sliding. Dropped from 30.5 cm with e = 0.90 the apexes are 24.7, 20.0, 16.2 and 13.1 cm, within 3.0e-07 of the closed form e^{2k}h₀; the first bounce of 24.7 cm sits inside the ITTF 24–26 cm rule, both the apex list and the contact intervals give back e = 0.900000, and the total time to rest, 4.736 s, sits beside the closed-form 4.738 s. Then a 40 mm ball with 14 markings is placed on an ITTF table and a topspin shot (ω = 240 rad/s) is filmed at 100 fps for 0.6 s by two cameras plus one close-up (rendering 61 frames × 2 cameras took 22.0 s). The true contact is at t = 0.3094 s, point (0.507, 0.052), v [5.15, −0.28, −2.65] → [5.01, −0.17, 2.39], ω [0, 240, 0] → [8.5, 250.6, 0] (grip). Chromaticity detection finds the ball in 122 / 122 frames with a centre error of 0.152 px at the median, 0.299 px at the 90th percentile and 2.094 px at worst (image radius ≈ 4.3 px). DLT triangulation is 3.8e-15 m from the truth’s own projections and, from the detections, 1.61 mm at the median, 4.25 mm at the 90th percentile and 23.56 mm at worst (median reprojection rms 0.094 px). The constant-acceleration Kalman filter is exact for a parabola, so its innovation on the parabolic truth is at most 8.2e-09 m (2.3e-03 m on the drag-plus-Magnus truth, which lies outside the model), and its velocity from the detections is off by 0.074 m/s at the median ( | v | ≈ 5.9 m/s). The local minimum of z lands at t = 0.31, 0.6 ms from the truth. Fitting the initial state by a 6-parameter Gauss–Newton to the 15 frames (0.15 s) before the bounce (the true trajectory comes back to 3.2e-13) and predicting across the bounce puts the landing point 0.4 cm off (0.5 ms in time) when the true spin is known, 20.2 cm off when spin is ignored, and 6.6 cm off with a parabola even given the true spin — the difference is the Magnus term. On the close-up camera at the bounce (1000 fps, strobe) 19 / 19 frame pairs pair at least two markings, and the Kabsch rotation gives a median angular velocity of [1.7, 256.6, −2.1] rad/s against the truth [8.5, 250.6, 0] ( | ω | 2394 rpm), a relative error of 3.7 %. The coefficient of restitution from equation-of-motion fits to 12 frames on each side gives v_z −2.637 → 2.403, e = 0.9114 (truth 0.90). Honestly: a parabolic fit gives 0.9398, 4.4 % off, because it absorbs drag and Magnus into g; the ball detection runs on synthetic footage with a known colour and no real lighting, blur or background; and the aerodynamic coefficients are textbook values with the truth built from the same formula (this is not a test of aerodynamics). 10 gates, 42.0 s. Finally two freely moving rackets (15 × 16 cm blades, ≤ 6 m/s) rally against each other: a feeder that returns near its previous target keeps the rally to the 12-hit cap, while an attacker aiming fast at the far corners ends it after 9 hits (a rewind mechanism previews each shot with the true physics and retries a miss; the attacker still misses after 99 rewinds). Gaussian noise on the perceived position leaves the rally length unchanged up to 5 cm (the blade’s margin) and cuts it to 2 hits at 10 cm — the rally length scores perception, prediction and control as one number. |
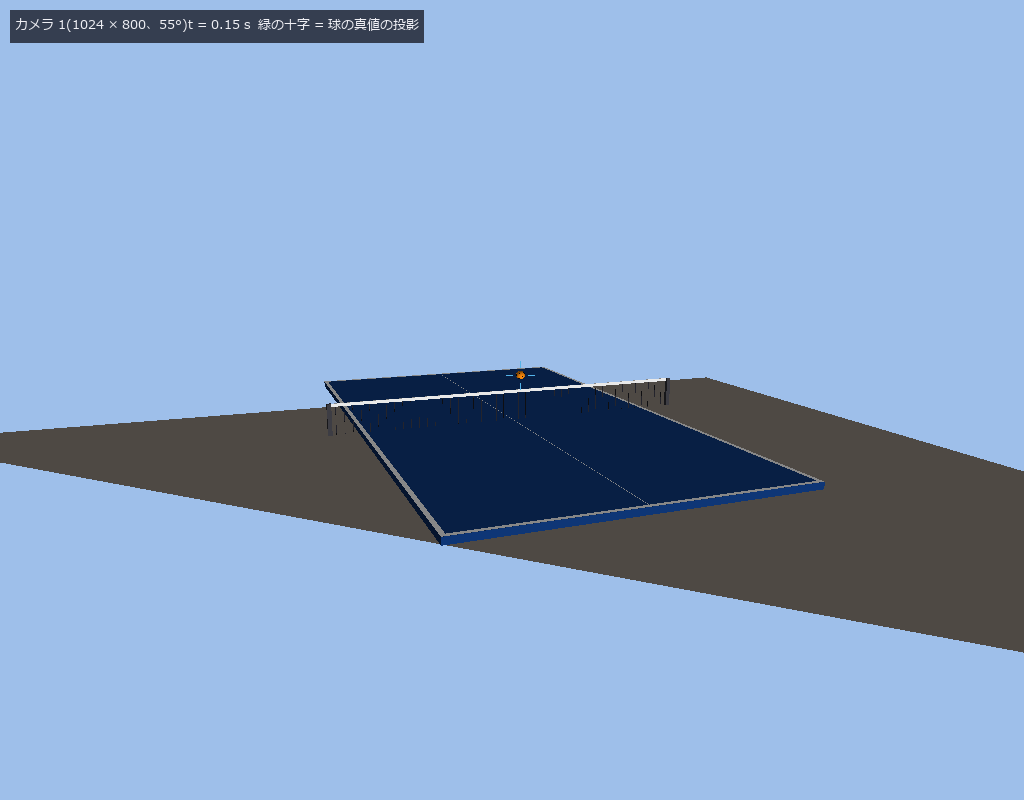
| *↑ Measuring a Table-Tennis Ball the Way the Pioneers Did — Multi-Camera Tracking, Triangulation, Trajectory Prediction, Bounce and Spin, Scored by Theorems on a Table with Ground Truth ―― Robot table tennis has had the same visual stance since 1988: find the ball in several cameras, triangulate it into a 3-D point, look ahead with an equation of motion that includes drag and Magnus lift, predict across the bounce and, if you can, measure spin from the markings. This exhibit builds that whole chain from numpy ops and scores it against a truth the world itself holds (ball centre, pose, contact time and angular velocity are formulas fixed at generation). First the theorems of mechanics: with drag and Magnus set to zero the RK4 flight matches the closed-form parabola to 1e-12, and the least-squares parabola returns g = 9.81 to 4.0e-15. Over 500 random impacts (e ∈ [0.3, 1], μ ∈ [0, 0.6]) the angular momentum about the contact point is conserved to a relative 4.9e-16 at worst, 136 impacts reach rolling and 364 keep sliding. Dropped from 30.5 cm with e = 0.90 the apexes are 24.7, 20.0, 16.2 and 13.1 cm, within 3.0e-07 of the closed form e^{2k}h₀; the first bounce of 24.7 cm sits inside the ITTF 24–26 cm rule, both the apex list and the contact intervals give back e = 0.900000, and the total time to rest, 4.736 s, sits beside the closed-form 4.738 s. Then a 40 mm ball with 14 markings is placed on an ITTF table and a topspin shot (ω = 240 rad/s) is filmed at 100 fps for 0.6 s by two cameras plus one close-up (rendering 61 frames × 2 cameras took 22.0 s). The true contact is at t = 0.3094 s, point (0.507, 0.052), v [5.15, −0.28, −2.65] → [5.01, −0.17, 2.39], ω [0, 240, 0] → [8.5, 250.6, 0] (grip). Chromaticity detection finds the ball in 122 / 122 frames with a centre error of 0.152 px at the median, 0.299 px at the 90th percentile and 2.094 px at worst (image radius ≈ 4.3 px). DLT triangulation is 3.8e-15 m from the truth’s own projections and, from the detections, 1.61 mm at the median, 4.25 mm at the 90th percentile and 23.56 mm at worst (median reprojection rms 0.094 px). The constant-acceleration Kalman filter is exact for a parabola, so its innovation on the parabolic truth is at most 8.2e-09 m (2.3e-03 m on the drag-plus-Magnus truth, which lies outside the model), and its velocity from the detections is off by 0.074 m/s at the median ( | v | ≈ 5.9 m/s). The local minimum of z lands at t = 0.31, 0.6 ms from the truth. Fitting the initial state by a 6-parameter Gauss–Newton to the 15 frames (0.15 s) before the bounce (the true trajectory comes back to 3.2e-13) and predicting across the bounce puts the landing point 0.4 cm off (0.5 ms in time) when the true spin is known, 20.2 cm off when spin is ignored, and 6.6 cm off with a parabola even given the true spin — the difference is the Magnus term. On the close-up camera at the bounce (1000 fps, strobe) 19 / 19 frame pairs pair at least two markings, and the Kabsch rotation gives a median angular velocity of [1.7, 256.6, −2.1] rad/s against the truth [8.5, 250.6, 0] ( | ω | 2394 rpm), a relative error of 3.7 %. The coefficient of restitution from equation-of-motion fits to 12 frames on each side gives v_z −2.637 → 2.403, e = 0.9114 (truth 0.90). Honestly: a parabolic fit gives 0.9398, 4.4 % off, because it absorbs drag and Magnus into g; the ball detection runs on synthetic footage with a known colour and no real lighting, blur or background; and the aerodynamic coefficients are textbook values with the truth built from the same formula (this is not a test of aerodynamics). 10 gates, 42.0 s. Finally two freely moving rackets (15 × 16 cm blades, ≤ 6 m/s) rally against each other: a feeder that returns near its previous target keeps the rally to the 12-hit cap, while an attacker aiming fast at the far corners ends it after 9 hits (a rewind mechanism previews each shot with the true physics and retries a miss; the attacker still misses after 99 rewinds). Gaussian noise on the perceived position leaves the rally length unchanged up to 5 cm (the blade’s margin) and cuts it to 2 hits at 10 cm — the rally length scores perception, prediction and control as one number.* |
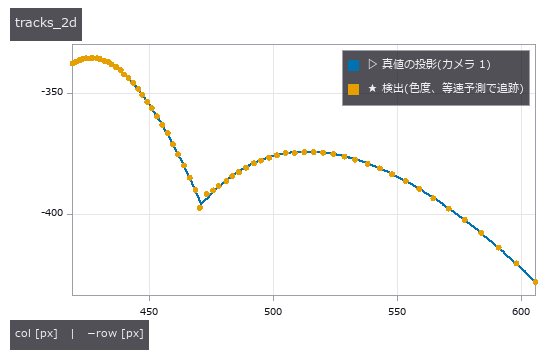
↑ The measurement ―― カメラ 1 の像での球の軌跡: 真値の投影(線)と検出(点)。中心の誤差の中央値 0.15 px。 (figure labels are in Japanese; the numbers are the same)
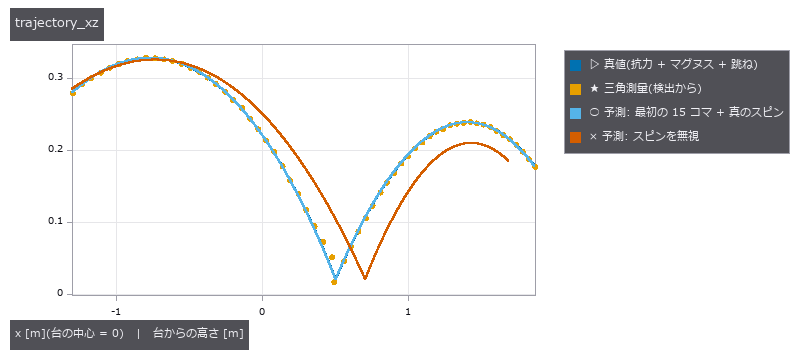
↑ x–z 面の軌跡。
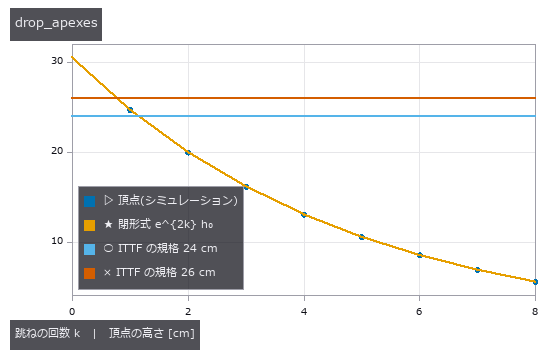
↑ 30.5 cm から落とした球(e = 0.90)の頂点: 閉形式 e^{2k}h₀ と 1e-6 で一致し、最初の跳ね 24.7 cm は ITTF の規格 24〜26 cm の中。
↑ 跳ね際の近接カメラ(1000 fps、256 × 256、20°)の 4 コマ。
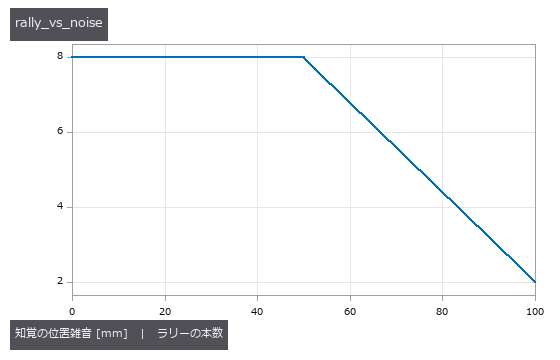
↑ 知覚(球の位置)にガウス雑音を足したときのラリーの本数(送り合い、上限 8 本): 0 mm → 8 本、50 mm → 8 本、100 mm → 2 本。
↑ The animation ―― 追跡カメラ 1(2 × 2 平均で 512 × 400)、100 fps を 1/10 速で。橙の十字は検出、緑は Kalman の状態の投影、赤は跳ねる前の 15 コマから予測した着地点。球は 2291 rpm のトップスピンで、台で 1 度跳ねる(e = 0.90)。
↑ The animation ―― 自由に動く 2 本のラケット(板 15 × 16 cm、速さ ≤ 6 m/s、加速度 ≤ 60 m/s²)の送り合い(前回に近い少しずらした位置へ返す)、最初の 3 秒を 1/5 速で。相手コートに 1 度跳ねた球を面 x = ±1.55 m で迎え撃ち、狙った点へ運動方程式で返す。この設定では上限 12 本まで続く。攻める側(遠い隅を速く)が入ると 9 本で終わる(out)。
py -3.11 examples/poc_ball_bounce.py
Source: examples/poc_ball_bounce.py
This run produced 8 figures in total - see them all
Ops used (notes): add_ball · apex_sequence · ball_detect · ball_mesh · ball_params · ball_set_pose · ball_track · ball_truth · bounce · bounce_detect · bounce_total_time · camera_rig · contact_angular_momentum · crosshair · fit_parabola · flight_fit · flight_ode · flight_simulate · flight_state_at · flight_vacuum · impact_params · kalman_ca · marker_direction · racket_params … (+12)
No.2026.171 —— Kendama the Way the Pioneers Did It — A True-to-Shape Kendama Filmed by Two Cameras, the Ball’s Flight Predicted from Images Alone and Caught in the Big, Small and Base Cups
Robots have played kendama for thirty years (via-points from a human demonstration in 1996, DMPs plus reinforcement learning for ball-in-a-cup in 2009, the 2020 split into offline swing-up and online catching). This exhibit rebuilds that stance from numpy ops. Shape: from the Japan Kendama Association’s published values (60 mm ball, 70 mm across the cups, 180 mm assembled) and a user-supplied description of the JKA 16-2 model (160 mm ken, cups of 42 / 38 / 35 mm, string from the cross-piece hole; primary source not checked), the ken (spike, neck, shaft through the cross piece, stepped and ringed grip, base cup) and the cross piece (flaring like trumpets into the big and small cups) are built as solids of revolution, plus a ball with a 17 mm hole; every dimension measured from the vertices matches to 1e-9, and with the spike pushed to the bottom of the hole the assembly is 180 mm long (the 40 mm hole depth is derived as 160 + 60 − 180). Theorems: the AGM returns K(0.5) = 1.685750354812596 to 1e-12; the period 4√(L/g)K(sin θ₀/2) is recovered to 3.0e-4 by the string (effective length 0.42 m) and 8.9e-11 by a rod; tension matches its closed form to 0.26 %; the slack angle is 125.04° (closed form 125.26°); the projection’s dissipation is first order in dt (ratio 9.7); the snap loss equals ½mv_r² to 0.2 %. The closed loop acts on images only: two cameras (480 × 360, 100 fps) render the world, the ball is found by chromaticity and triangulated (median error 0.51 mm), slack is declared when the ball is 5 mm closer to the cross-piece hole than the string length for two frames in a row (truth 0.077 s, images 0.100 s), and a gravity-known parabola (6 unknowns) fitted to the frames after that gives the landing point. The true (p, v) is used only to render the world. The controller’s stages are explicit: lift straight up (4.9 g, the ken dodges 10 cm towards the string hole) → wait for slack → wait until the ball’s underside clears the kendama → carry the cup horizontally under the ball → lower it at touchdown. Only gravity and string tension move the ball; if the kendama touches it the trial fails (a lift without the dodge hits the cross piece at 0.260 s). The same plan with only the trick’s pose switched gives, over 20 trials, big cup truth 1.00 / images 1.00 (lateral 2.40 mm), small cup 1.00 / 1.00, base cup 0.95 / 0.95, candle (truth) 0.95; lowering at touchdown cuts the mean relative speed from 0.91 to 0.61 m/s (big cup). The landing-point error falls with the number of post-slack frames, 10.51 mm (3 frames) → 0.98 mm (44). Pixel noise of 0 / 0.5 / 1 / 2 / 8 / 16 px gives 1.00 / 1.00 / 1.00 / 1.00 / 0.90 / 0.40 — flat up to 2 px because the 21 mm cup rim absorbs it, while the lateral offset grows 2.40 → 4.12 → 12.05 mm. The recommended model (49 mm big cup) also scores 1.00. For a stationary ball the hole direction from two views is off by 1.8° at the median and 4.7° at worst. The world was also turned into 3D Gaussian Splatting before recognition (gsplatnp: Gaussians attached to the world’s faces, rendered by EWA projection, front-to-back alpha compositing and Mip-Splatting’s opacity compensation; the Gaussians are built from the true shape rather than learned from photos, and reconstruction imperfections are imitated with spacing and error knobs): on 3DGS images at 4 mm spacing the closed loop caught 1 + 2 trials out of 1 + 2 (median triangulation error 0.30 mm); spacing from 2 to 64 mm leaves ball detection at 1.00 (the curvature cap keeps at least 146 Gaussians on the ball), while position error (0.25 at 20 mm) and colour error (0.00 at 0.3) break it. At 480 × 360 the ball’s hole is smeared away by the 3DGS blur (1 of 40 poses, mesh 14); at twice the resolution and 2 mm spacing it is read in 16 (median error 2.3°), at 4 mm in none — reading the hole needs pixels on the ball and Gaussians inside the hole. The hole is built as a 40 mm deep cavity, not a disc on the surface (as a disc it vanished under the ball’s own Gaussians in 3DGS). Consecutive tricks were added too (the user: “after a catch, carry on from that state and catch in another cup”, “10 successes is enough”): the ball is tossed from the cup it sits in (accelerate the cup up and stop it harder than g, and the ball leaves; the apex matches v²/2g to 2e-6 m), the kendama is turned in flight (wrist ≤ 30 rad/s, assumed) to bring the next cup under the landing point, and a hand controller that targets position and velocity matches the ball’s speed at the catch (a position-only controller catches nothing with a 20 cm apex). On images alone, moshikame (big ↔ base cup) and the three-cup sequence (big → small → base) both run 10 in a row (grade 5 on the association’s moshikame table), relative speed at touchdown 0.41–0.48 m/s, every flight start found from images. Honestly: without noise, 100 in a row is the same cycle repeated; with 2 px of pixel noise moshikame breaks after 3 and the three cups after 6. Honestly: synthetic footage with ground truth, not real video; ball rotation is not simulated (it keeps its last pose once slack); a catch is a geometric test at the moment the ball touches the rim (lateral ≤ rim radius, relative speed ≤ 1 m/s as an assumed threshold, descending) with no bounce or rolling; the 15° tilt of the cup grip, cup depths and the 75 g ball are assumptions. In flight the hole faces down and is almost never seen by both eye-level cameras (0 of 54 frames). Why the candle is harder than the base cup cannot be expressed by a rigid, translating hand. 16 gates, 171.0 s.
↑ Kendama the Way the Pioneers Did It — A True-to-Shape Kendama Filmed by Two Cameras, the Ball’s Flight Predicted from Images Alone and Caught in the Big, Small and Base Cups ―― Robots have played kendama for thirty years (via-points from a human demonstration in 1996, DMPs plus reinforcement learning for ball-in-a-cup in 2009, the 2020 split into offline swing-up and online catching). This exhibit rebuilds that stance from numpy ops. Shape: from the Japan Kendama Association’s published values (60 mm ball, 70 mm across the cups, 180 mm assembled) and a user-supplied description of the JKA 16-2 model (160 mm ken, cups of 42 / 38 / 35 mm, string from the cross-piece hole; primary source not checked), the ken (spike, neck, shaft through the cross piece, stepped and ringed grip, base cup) and the cross piece (flaring like trumpets into the big and small cups) are built as solids of revolution, plus a ball with a 17 mm hole; every dimension measured from the vertices matches to 1e-9, and with the spike pushed to the bottom of the hole the assembly is 180 mm long (the 40 mm hole depth is derived as 160 + 60 − 180). Theorems: the AGM returns K(0.5) = 1.685750354812596 to 1e-12; the period 4√(L/g)K(sin θ₀/2) is recovered to 3.0e-4 by the string (effective length 0.42 m) and 8.9e-11 by a rod; tension matches its closed form to 0.26 %; the slack angle is 125.04° (closed form 125.26°); the projection’s dissipation is first order in dt (ratio 9.7); the snap loss equals ½mv_r² to 0.2 %. The closed loop acts on images only: two cameras (480 × 360, 100 fps) render the world, the ball is found by chromaticity and triangulated (median error 0.51 mm), slack is declared when the ball is 5 mm closer to the cross-piece hole than the string length for two frames in a row (truth 0.077 s, images 0.100 s), and a gravity-known parabola (6 unknowns) fitted to the frames after that gives the landing point. The true (p, v) is used only to render the world. The controller’s stages are explicit: lift straight up (4.9 g, the ken dodges 10 cm towards the string hole) → wait for slack → wait until the ball’s underside clears the kendama → carry the cup horizontally under the ball → lower it at touchdown. Only gravity and string tension move the ball; if the kendama touches it the trial fails (a lift without the dodge hits the cross piece at 0.260 s). The same plan with only the trick’s pose switched gives, over 20 trials, big cup truth 1.00 / images 1.00 (lateral 2.40 mm), small cup 1.00 / 1.00, base cup 0.95 / 0.95, candle (truth) 0.95; lowering at touchdown cuts the mean relative speed from 0.91 to 0.61 m/s (big cup). The landing-point error falls with the number of post-slack frames, 10.51 mm (3 frames) → 0.98 mm (44). Pixel noise of 0 / 0.5 / 1 / 2 / 8 / 16 px gives 1.00 / 1.00 / 1.00 / 1.00 / 0.90 / 0.40 — flat up to 2 px because the 21 mm cup rim absorbs it, while the lateral offset grows 2.40 → 4.12 → 12.05 mm. The recommended model (49 mm big cup) also scores 1.00. For a stationary ball the hole direction from two views is off by 1.8° at the median and 4.7° at worst. The world was also turned into 3D Gaussian Splatting before recognition (gsplatnp: Gaussians attached to the world’s faces, rendered by EWA projection, front-to-back alpha compositing and Mip-Splatting’s opacity compensation; the Gaussians are built from the true shape rather than learned from photos, and reconstruction imperfections are imitated with spacing and error knobs): on 3DGS images at 4 mm spacing the closed loop caught 1 + 2 trials out of 1 + 2 (median triangulation error 0.30 mm); spacing from 2 to 64 mm leaves ball detection at 1.00 (the curvature cap keeps at least 146 Gaussians on the ball), while position error (0.25 at 20 mm) and colour error (0.00 at 0.3) break it. At 480 × 360 the ball’s hole is smeared away by the 3DGS blur (1 of 40 poses, mesh 14); at twice the resolution and 2 mm spacing it is read in 16 (median error 2.3°), at 4 mm in none — reading the hole needs pixels on the ball and Gaussians inside the hole. The hole is built as a 40 mm deep cavity, not a disc on the surface (as a disc it vanished under the ball’s own Gaussians in 3DGS). Consecutive tricks were added too (the user: “after a catch, carry on from that state and catch in another cup”, “10 successes is enough”): the ball is tossed from the cup it sits in (accelerate the cup up and stop it harder than g, and the ball leaves; the apex matches v²/2g to 2e-6 m), the kendama is turned in flight (wrist ≤ 30 rad/s, assumed) to bring the next cup under the landing point, and a hand controller that targets position and velocity matches the ball’s speed at the catch (a position-only controller catches nothing with a 20 cm apex). On images alone, moshikame (big ↔ base cup) and the three-cup sequence (big → small → base) both run 10 in a row (grade 5 on the association’s moshikame table), relative speed at touchdown 0.41–0.48 m/s, every flight start found from images. Honestly: without noise, 100 in a row is the same cycle repeated; with 2 px of pixel noise moshikame breaks after 3 and the three cups after 6. Honestly: synthetic footage with ground truth, not real video; ball rotation is not simulated (it keeps its last pose once slack); a catch is a geometric test at the moment the ball touches the rim (lateral ≤ rim radius, relative speed ≤ 1 m/s as an assumed threshold, descending) with no bounce or rolling; the 15° tilt of the cup grip, cup depths and the 75 g ball are assumptions. In flight the hole faces down and is almost never seen by both eye-level cameras (0 of 54 frames). Why the candle is harder than the base cup cannot be expressed by a rigid, translating hand. 16 gates, 171.0 s.
↑ The measurement ―― 近接カメラ(図のためだけ、けん玉から 0.36 m)で見た 4 技の持ち方の姿勢(けんと皿胴は 1 つの剛体、持つ所だけが違う)。けん(けん先 → 細い首 → 皿胴を貫く胴 → 段と輪のある握り → 中皿)、皿胴の両端がラッパのように開いた大皿(赤)・小皿(紫)、中皿(青)、直径 17 mm・深さ 40 mm の穴(くぼみ)のある玉、皿胴の糸穴から出る糸。寸法は JKA 16-2 型(けん 160 mm、横幅 70 mm、皿 42 / 38 / 35 mm)。玉の位置と向きは見せるために置いたもの。 (figure labels are in Japanese; the numbers are the same)
↑ 真下から 150° 相当の速さ(3.92 m/s)で打ち出した玉のひも(有効長 0.42 m)の張力。
↑ y–z 面(手元を逃がす向き)。
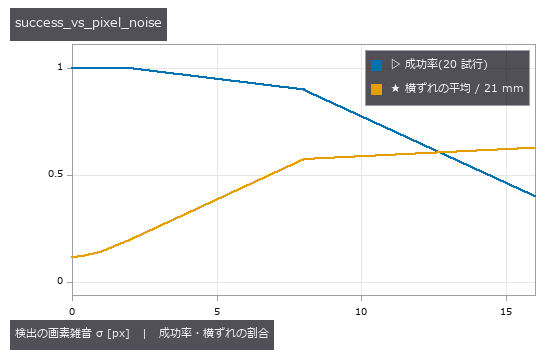
↑ 画像だけの閉ループの成功率(大皿、各 20 試行): 0 px → 1.00、0.5 px → 1.00、1 px → 1.00、2 px → 1.00、8 px → 0.90、16 px → 0.40。
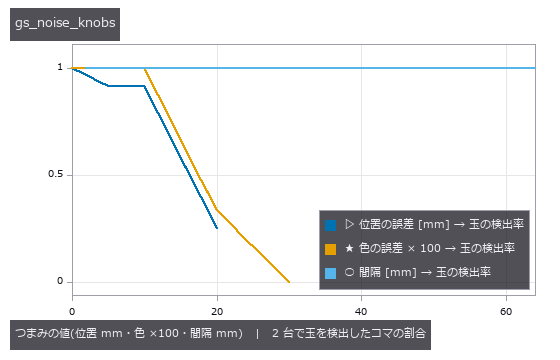
↑ 3DGS の世界の捕球の試行(弛み → 捕球の 12 コマ)を、つまみを振った 3DGS で描き直して色度の検出(balltrack.ball_detect)にかけた。
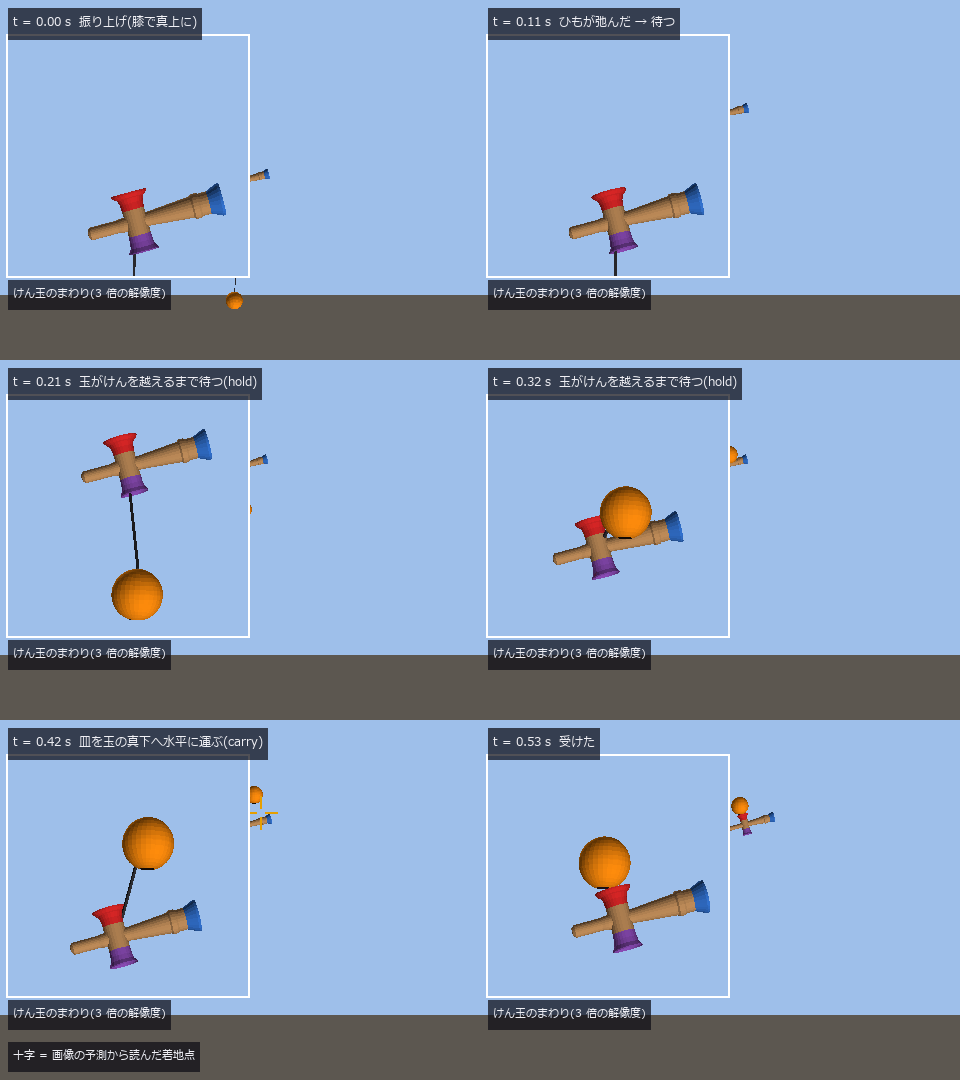
↑ The animation ―― カメラ 2、100 fps を 1/10 速で(最後のコマで 1 秒止める)。振り上げ → t = 0.077 s にひもが弛む(画像での検出 0.100 s)→ 玉がけんを越えるまで待つ → 皿を水平に運ぶ → 着地で下げる → t = 0.540 s に大皿で受ける。十字は画像の予測(弛んだ後のコマに当てた重力つきの放物線)から読んだ着地点、枠の中は同じカメラでけん玉のまわりを 3 倍の解像度に描き直した窓。t ≈ 0.3 s に玉がけんに重なって見えるのはカメラから見た重なりで、けんは糸穴の側へ 10 cm 逃げて玉の奥にある(その間の隙間の最小 41 mm)。正直に: 捕球は「縁に触れた瞬間に横ずれ ≤ 21 mm・相対速さ ≤ 1 m/s・下降中」の判定で、縁での跳ねと転がりは描いていない。
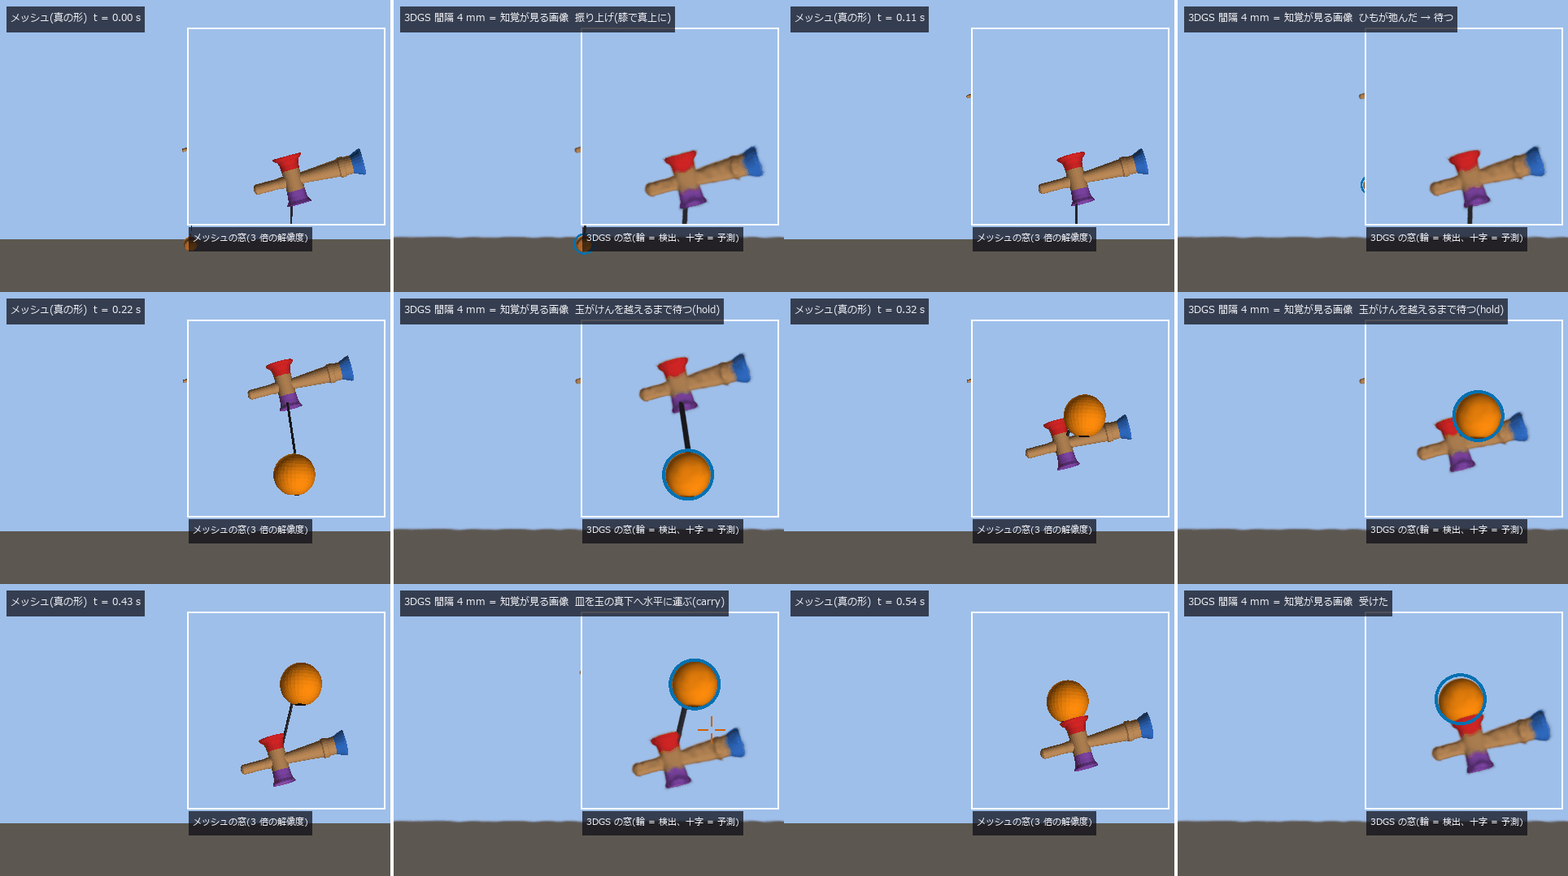
↑ The animation ―― 右 = 閉ループの知覚が実際に見た画像(世界を 3DGS にして描いたもの、カメラ 2、100 fps を 1/10 速)、左 = 同じ瞬間のメッシュ(真の形)。右上の窓 = 同じカメラでけん玉のまわりを 3 倍の解像度に描き直したもの(左はメッシュ、右は同じ 3DGS)。青の輪 = 色度で検出した玉、十字 = 弛んだ後のコマに当てた重力つきの放物線から読んだ着地点。t = 0.541 s に大皿で受ける(横ずれ 4.34 mm、推定 391 回は全部 3DGS の画像から)。
py -3.11 examples/poc_kendama.py
Source: examples/poc_kendama.py
This run produced 11 figures in total - see them all
Ops used (notes): ball_detect · camera_perceiver · catch_plan_staged · catch_success_rate · crosshair · elliptic_k_agm · gs_from_world · gs_render · gs_render_fn · gs_update · hole_detect · ken_mesh · kendama_clearance · kendama_combo_simulate · kendama_params · kendama_pose · kendama_rig · kendama_simulate · kendama_world · leader_line · overlay_mask · pendulum_launch_speed · pendulum_period_exact · pendulum_rod_simulate … (+10)
No.2026.174 —— Filming a Spinning Table-Tennis Ball and Reading Its Spin Two Ways — From the Curve and From the Markings
Two table-tennis balls launched at the same speed and angle land in different places if they spin differently: topspin dips and lands short, backspin floats and lands long, sidespin curves sideways (the Magnus effect, force along ω × v). This exhibit films four balls that differ only in spin (150 rad/s ≈ 1,430 rpm) with two 240 fps cameras and reads the spin in two ways. From the curve: fit the drag + Magnus equation of motion to the triangulated pre-bounce track with 9 parameters (position, velocity, spin) — the new op fit_spin, a damped least-squares fit. The perpendicular-spin error is 3.9 % (top), 0.9 % (back), 1.7 % (side), and the landing point predicted from the read spin is within 2 cm of the truth for all four (x = [0.488, 0.754, 1.124] m; top < none < back). From the markings: film the same ball with a 1000 fps close-up camera (20 frames) and fit the motion of the 14 black marks with Kabsch — 4.8 %, 3.2 %, 0.9 %. The two readings are independent (one sees only the track, the other only the marks) and agree within 10 % (a second-implementation gate). Theorem gate: Magnus force is ω × v, so spin parallel to the direction of travel produces no force — the instantaneous acceleration differs by less than 1e-12, and after 0.25 s of flight the track moves 7.1 mm (versus 5.4 cm for perpendicular spin). fit_spin therefore returns this component separately, and the 22 rad/s the fit reports for the no-spin ball lies almost entirely along that unreadable direction. With a short track the curve is buried in detection error and the spin cannot be read (400.3 % → 4.0 %). Found on the way: from the server-side camera the net’s white band hides the top half of a low ball beyond the net and shifts the detected centre (up to 26 mm after triangulation) — detections whose radius is under 0.8× their neighbours’ are dropped. The op that turns a mark into a direction (marker_direction) assumed the ball sits on the optical axis, so for a ball crossing the frame the change of line of sight showed up as apparent spin (0.01 rad per ms, 7 % of one frame’s rotation) — given the camera K it now solves the perspective exactly. Honestly: synthetic video (known colour, no real lighting or blur); the aerodynamic coefficients (C_d = 0.4, spin-ratio C_L) are the same in truth and fit; spin is constant in flight. 8 gates, 34.4 s.
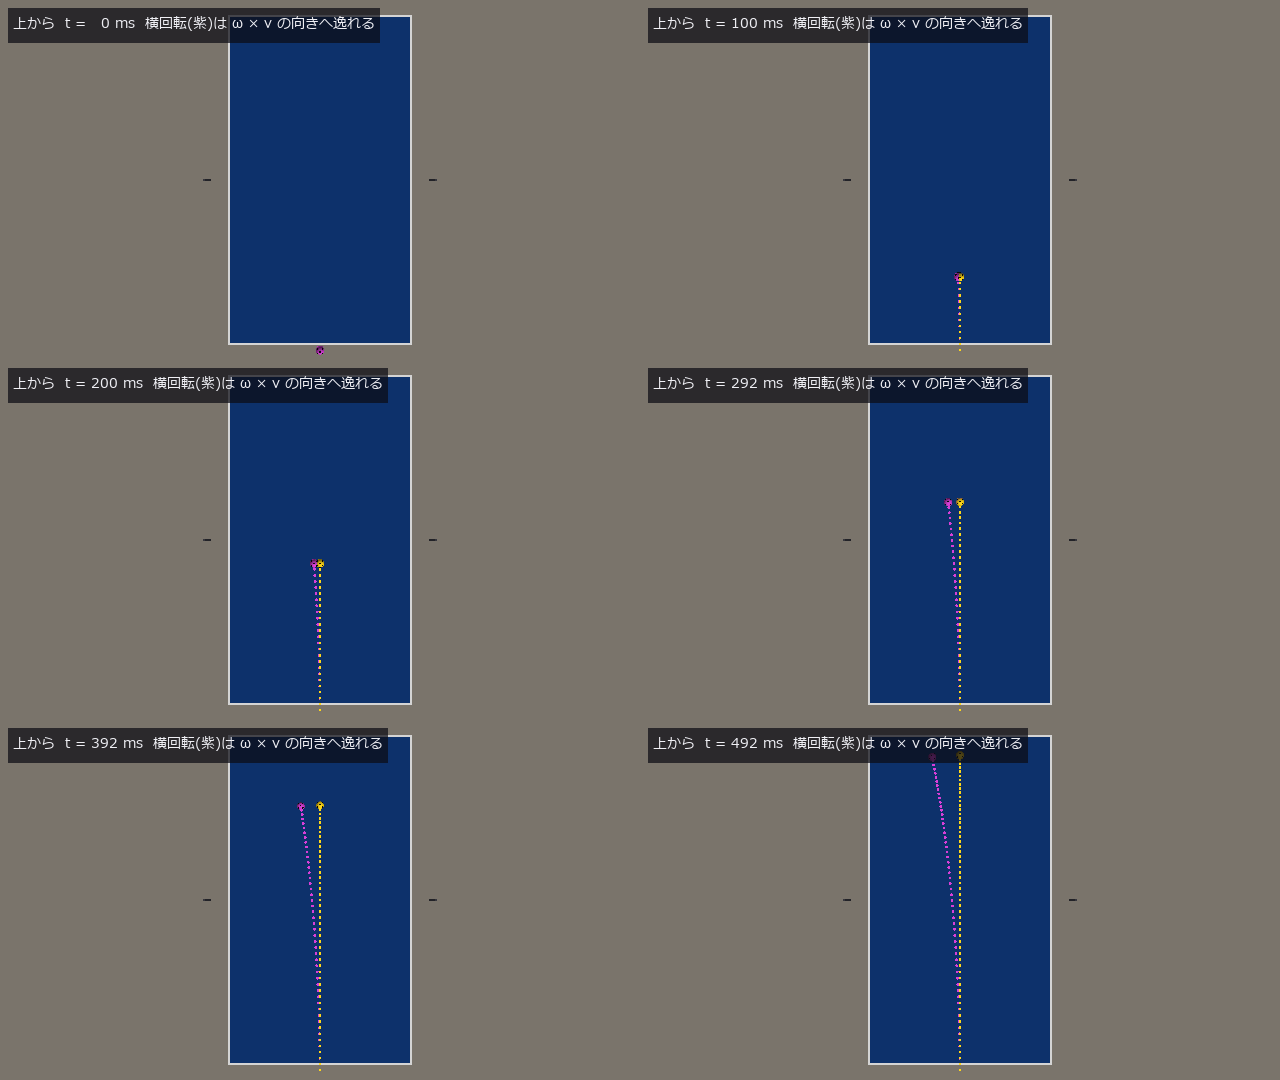
↑ Filming a Spinning Table-Tennis Ball and Reading Its Spin Two Ways — From the Curve and From the Markings ―― Two table-tennis balls launched at the same speed and angle land in different places if they spin differently: topspin dips and lands short, backspin floats and lands long, sidespin curves sideways (the Magnus effect, force along ω × v). This exhibit films four balls that differ only in spin (150 rad/s ≈ 1,430 rpm) with two 240 fps cameras and reads the spin in two ways. From the curve: fit the drag + Magnus equation of motion to the triangulated pre-bounce track with 9 parameters (position, velocity, spin) — the new op fit_spin, a damped least-squares fit. The perpendicular-spin error is 3.9 % (top), 0.9 % (back), 1.7 % (side), and the landing point predicted from the read spin is within 2 cm of the truth for all four (x = [0.488, 0.754, 1.124] m; top < none < back). From the markings: film the same ball with a 1000 fps close-up camera (20 frames) and fit the motion of the 14 black marks with Kabsch — 4.8 %, 3.2 %, 0.9 %. The two readings are independent (one sees only the track, the other only the marks) and agree within 10 % (a second-implementation gate). Theorem gate: Magnus force is ω × v, so spin parallel to the direction of travel produces no force — the instantaneous acceleration differs by less than 1e-12, and after 0.25 s of flight the track moves 7.1 mm (versus 5.4 cm for perpendicular spin). fit_spin therefore returns this component separately, and the 22 rad/s the fit reports for the no-spin ball lies almost entirely along that unreadable direction. With a short track the curve is buried in detection error and the spin cannot be read (400.3 % → 4.0 %). Found on the way: from the server-side camera the net’s white band hides the top half of a low ball beyond the net and shifts the detected centre (up to 26 mm after triangulation) — detections whose radius is under 0.8× their neighbours’ are dropped. The op that turns a mark into a direction (marker_direction) assumed the ball sits on the optical axis, so for a ball crossing the frame the change of line of sight showed up as apparent spin (0.01 rad per ms, 7 % of one frame’s rotation) — given the camera K it now solves the perspective exactly. Honestly: synthetic video (known colour, no real lighting or blur); the aerodynamic coefficients (C_d = 0.4, spin-ratio C_L) are the same in truth and fit; spin is constant in flight. 8 gates, 34.4 s.
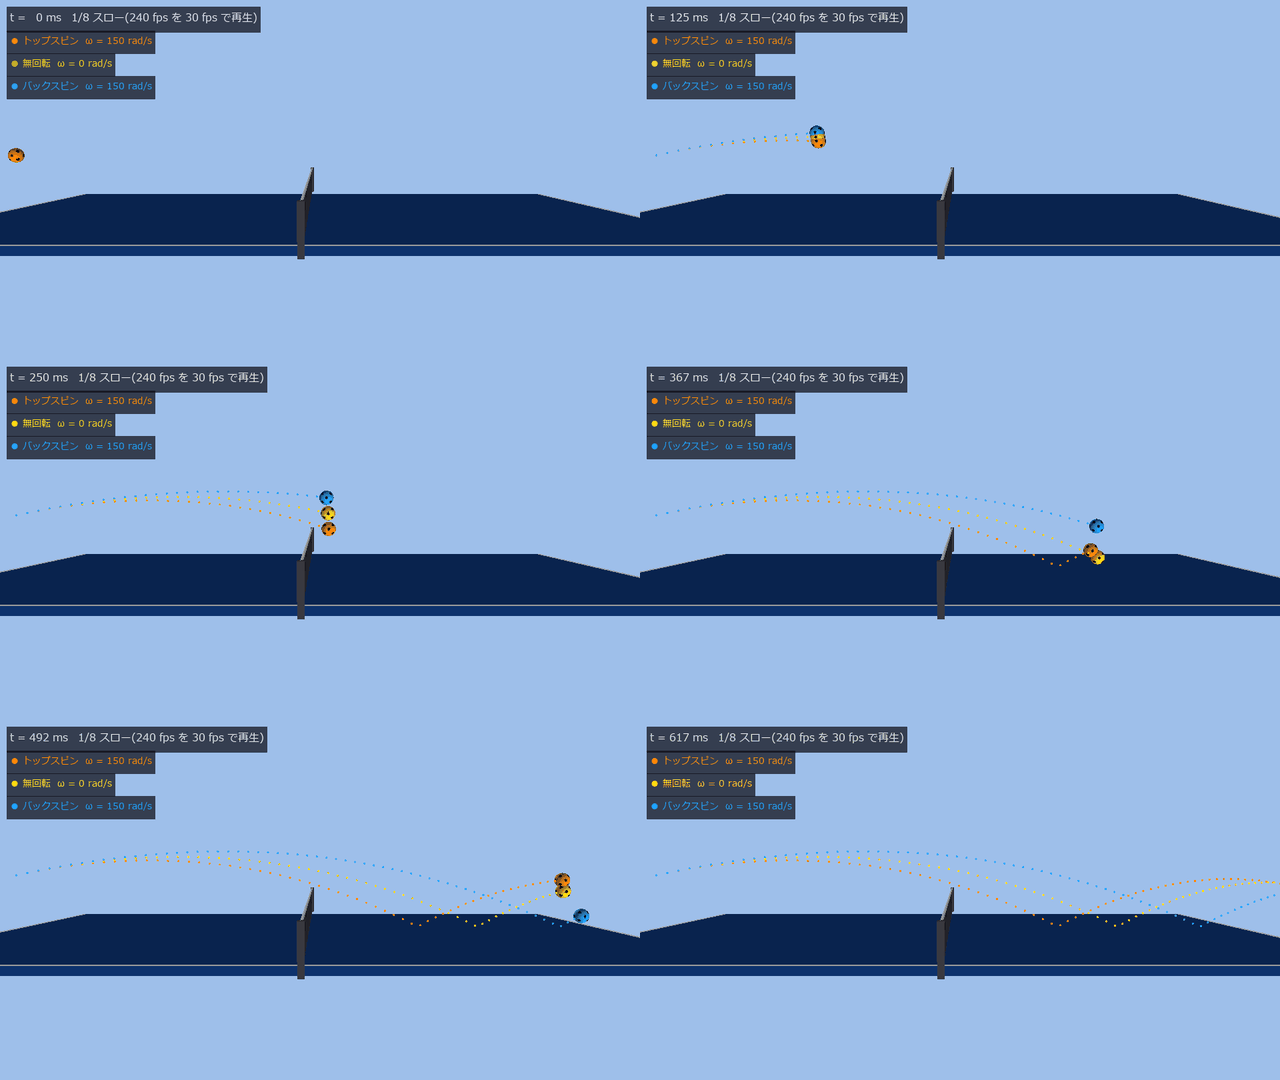
↑ The measurement ―― 同じ速さ・同じ向き(v₀ = (6.0, 0, 1.3) m/s)で打ち出した 3 本を横から: トップスピン(橙)は沈んで x = 0.49 m、無回転(黄)は 0.75 m、バックスピン(青)は浮いて 1.12 m に落ちる(台の中心から)。球は見やすさのため 1.6 倍で描いた。MP4 = 240 fps の全コマ(1/8 スロー)。 (figure labels are in Japanese; the numbers are the same)
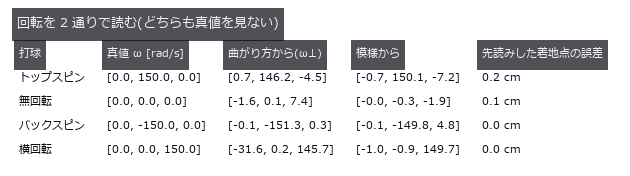
↑ 曲がり方(軌跡に運動方程式を当てる)と模様(近接カメラの Kabsch)は独立。
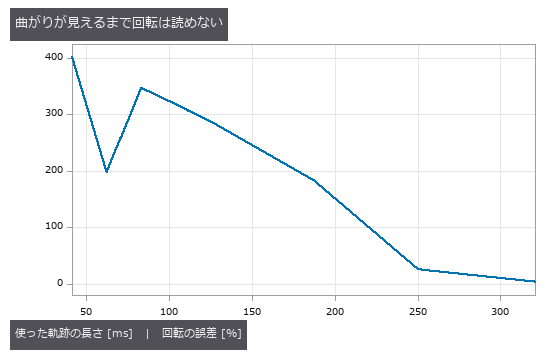
↑ 跳ねる前の先頭 n コマだけで回転を読む。
[](https://raw.githubusercontent.com/furuse-kazufumi/fullseye/master/docs/articles/assets/poc/poc_table_tennis_spin/02_spin_closeup.gif)
↑ The animation ―― 近接カメラ(1000 fps、20 コマ = 20 ms)のトップスピン。黒い模様(14 個、見えるのは 4〜6 個)を前のコマと向きで対応づけ、Kabsch で回転を当てる: ω = [-0.7, 150.1, -7.2] rad/s(真値 (0, 150, 0))。1/100 スロー、3 回繰り返し。
py -3.11 examples/poc_table_tennis_spin.py
Source: examples/poc_table_tennis_spin.py
This run produced 5 figures in total - see them all
Ops used (notes): add_ball · ball_detect · ball_mesh · ball_params · ball_set_pose · ball_track · bounce_detect · camera_rig · fit_spin · flight_ode · flight_simulate · impact_params · marker_direction · reproject · rotation_from_omega · spin_from_marker_sequence · table_params · table_world · text_box · track_triangulate · world_camera
No.2026.175 —— Filming a Bouncing Table-Tennis Ball with a High-Speed Camera and Reading Restitution and Friction — Checked Against Published Values
| When a table-tennis ball bounces on the table, restitution e decides how much vertical speed survives and friction trades horizontal speed against spin. If the contact point slides only a little the sliding stops during the bounce and the ball leaves rolling; if it slides a lot it leaves still sliding. This exhibit films 22 bounces with one high-speed camera from the side (1000 fps, ROI readout) and reads e, the friction coefficient μ and the kind of bounce from the images alone, checking them against published values. The plane of motion is known, so one camera gives positions (the centre pixel’s line of sight meets that plane). The drag + Magnus equation of motion is fitted before and after the bounce to get the velocities at contact, and the spin is read from the ball’s marks in two stages (the new op spin_from_marker_sequence). Gates: the closed forms of Cross 2002 (thin shell: a bounce ending rolling has v_x’ = 0.6 v_x + 0.4 rω, one still sliding has Δv_t = μ(1+e) | v_z | , the boundary is (2/5) | s | = μ(1+e) | v_z | ) agree with the impulse implementation over 300 random impacts / the ITTF table bounce (Laws 2.1.3: 30 cm → about 23 cm) is 23.0 cm from the video / the slope of e against impact speed, -0.00572 per km/h, is within 1.4 % of the −0.0058 measured by Inaba et al. 2017 / sliding bounces give μ = 0.2500 (truth 0.25) / the kind of bounce agrees with the closed-form boundary (15 / 15) / bounces that end rolling have rω’ within 3 % of v_x’ / on a frictionless table neither horizontal speed nor spin changes. Found on the way: reading 30 → 23 cm as e = √(23/30) = 0.876 drops the air drag — that table bounces only 21.7 cm, and the e that gives about 23 cm with drag is 0.9019. The formula of Inaba et al. itself (intercept 1.0002) makes a table that bounces 25.5 cm from 30 cm, so the two published values disagree (lab table versus standard, or method, not checked). The apparent μ of a bounce that ends rolling is only a lower bound. Honestly: synthetic video; the table’s e(v) joins the ITTF intercept and the slope of Inaba et al.; μ is constant (their measurements rise with contact-point speed); the ball does not deform (buckling from 5.5 m/s). 7 gates, 21.6 s. |
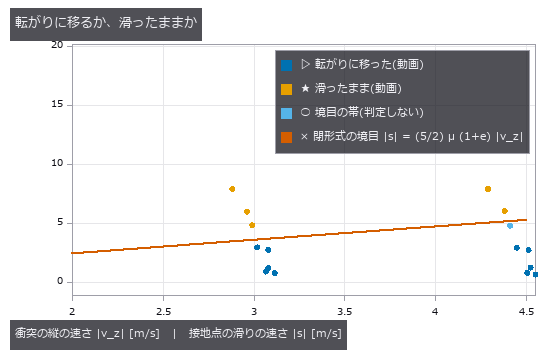
| *↑ Filming a Bouncing Table-Tennis Ball with a High-Speed Camera and Reading Restitution and Friction — Checked Against Published Values ―― When a table-tennis ball bounces on the table, restitution e decides how much vertical speed survives and friction trades horizontal speed against spin. If the contact point slides only a little the sliding stops during the bounce and the ball leaves rolling; if it slides a lot it leaves still sliding. This exhibit films 22 bounces with one high-speed camera from the side (1000 fps, ROI readout) and reads e, the friction coefficient μ and the kind of bounce from the images alone, checking them against published values. The plane of motion is known, so one camera gives positions (the centre pixel’s line of sight meets that plane). The drag + Magnus equation of motion is fitted before and after the bounce to get the velocities at contact, and the spin is read from the ball’s marks in two stages (the new op spin_from_marker_sequence). Gates: the closed forms of Cross 2002 (thin shell: a bounce ending rolling has v_x’ = 0.6 v_x + 0.4 rω, one still sliding has Δv_t = μ(1+e) | v_z | , the boundary is (2/5) | s | = μ(1+e) | v_z | ) agree with the impulse implementation over 300 random impacts / the ITTF table bounce (Laws 2.1.3: 30 cm → about 23 cm) is 23.0 cm from the video / the slope of e against impact speed, -0.00572 per km/h, is within 1.4 % of the −0.0058 measured by Inaba et al. 2017 / sliding bounces give μ = 0.2500 (truth 0.25) / the kind of bounce agrees with the closed-form boundary (15 / 15) / bounces that end rolling have rω’ within 3 % of v_x’ / on a frictionless table neither horizontal speed nor spin changes. Found on the way: reading 30 → 23 cm as e = √(23/30) = 0.876 drops the air drag — that table bounces only 21.7 cm, and the e that gives about 23 cm with drag is 0.9019. The formula of Inaba et al. itself (intercept 1.0002) makes a table that bounces 25.5 cm from 30 cm, so the two published values disagree (lab table versus standard, or method, not checked). The apparent μ of a bounce that ends rolling is only a lower bound. Honestly: synthetic video; the table’s e(v) joins the ITTF intercept and the slope of Inaba et al.; μ is constant (their measurements rise with contact-point speed); the ball does not deform (buckling from 5.5 m/s). 7 gates, 21.6 s.* |
↑ The measurement ―― ITTF の台の跳ねの試験(Laws 2.1.3: 30 cm から落として約 23 cm)。球の下端を 30 cm から落とし、動画から読んだ跳ねの高さは 23.0 cm(世界の真値 23.0 cm)。物差しは 1 cm 刻み。MP4 = 240 fps の全コマ(1/8 スロー)。 (figure labels are in Japanese; the numbers are the same)
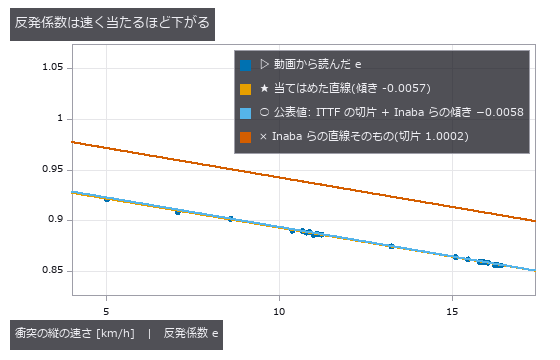
↑ 動画から読んだ e(22 本)と公表値。
↑ The animation ―― バックスピン(ω = −150 rad/s)の跳ね(当たる瞬間 v = (4.9, −4.3) m/s)、1000 fps を 1/40 スローで。接地点が大きく滑ったまま離れる(滑り +7.89 → +2.89 m/s)。模様から読んだ回転 -150 → +0 rad/s、横の速さの減り 1.997 m/s → 見かけの μ 0.250。
↑ The animation ―― トップスピン(ω = +200 rad/s)の跳ね(当たる瞬間 v = (2.9, −3.1) m/s)。接地点の滑りが小さいので跳ねの途中で止まり、転がりに移って離れる(滑り -1.17 → -0.01 m/s、跳ねた後の rω’ = 3.320 m/s と v_x’ = 3.312 m/s)。
py -3.11 examples/poc_table_tennis_bounce.py
Source: examples/poc_table_tennis_bounce.py
This run produced 5 figures in total - see them all
Ops used (notes): add_ball · ball_detect · ball_mesh · ball_params · ball_set_pose · bounce · bounce_detect · crosshair · flight_fit · flight_ode · flight_simulate · flight_state_at · impact_params · marker_direction · ray_plane_range · reproject · rotation_from_omega · spin_from_marker_sequence · table_params · table_world · text_box · world_camera
No.2026.177 —— Reading Errors End the Table-Tennis Rally — How Much Noise and Latency Move the Landing Point, in Closed Form Before the Shot
| A table-tennis robot reads where the ball is, then computes a return that lands on a chosen point of the opponent’s half. If the reading is off by δ, the shot is computed from the misread position but the ball leaves from the true one, so the landing point moves; past the margin to the edge the ball is out and the rally ends. This exhibit works out, before the shot, how a reading error becomes a landing error (the Jacobian J, 2 × 3) and checks whether noise, latency and broken rallies are explained by it. Gates: without air, the numerical J through aiming, racket planning, impact and flight differs from the closed form ΔL_xy = −δ_xy − (v_xy/ | v_z(T) | )δ_z by 2.5e-06 (a 1 cm height error moves the landing 2.1 cm along the table) / with drag and Magnus, the spread of 300 shots with σ = 2 cm readings (along 4.6, across 2.0 cm) is within 1.0 and 0.8 % of J Σ Jᵀ / aiming 6 cm from the edge with σ = 3 cm, the out probability is predicted 0.043 and 300 shots give 0.060 (1.5 σ binomial) / the landing error for latency τ = 5, 10, 20 ms matches J · (−vτ − ½gτ² ẑ) within 0.2–0.6 % / noise-free rallies reach the cap of 10 shots all 4 times, while σ = 6 cm (1.2 × the bound σ* = 5.2 cm from the margin) ends after 9, 8, 2, 7 shots, all out / with no error the ball lands 0.52 mm from the target. Found on the way: the height of the “reading τ old” was written with + ½gτ² (it is −). The gate puts the same reading error on both sides, so the mistake passed; a numerical integral caught it. With large noise (12 cm from the edge, σ = 5 cm) the prediction is 0.017 and the shots give 0.003; an earlier seed missed by 2.7 σ the other way, so 300 shots cannot tell which way the linearisation errs. Honestly: only the ball position is misread (velocity and spin are true), the noise is independent Gaussian per frame, the racket hits exactly as planned, and an out is judged only by the edge margin. 6 gates, 289 s. |
| *↑ Reading Errors End the Table-Tennis Rally — How Much Noise and Latency Move the Landing Point, in Closed Form Before the Shot ―― A table-tennis robot reads where the ball is, then computes a return that lands on a chosen point of the opponent’s half. If the reading is off by δ, the shot is computed from the misread position but the ball leaves from the true one, so the landing point moves; past the margin to the edge the ball is out and the rally ends. This exhibit works out, before the shot, how a reading error becomes a landing error (the Jacobian J, 2 × 3) and checks whether noise, latency and broken rallies are explained by it. Gates: without air, the numerical J through aiming, racket planning, impact and flight differs from the closed form ΔL_xy = −δ_xy − (v_xy/ | v_z(T) | )δ_z by 2.5e-06 (a 1 cm height error moves the landing 2.1 cm along the table) / with drag and Magnus, the spread of 300 shots with σ = 2 cm readings (along 4.6, across 2.0 cm) is within 1.0 and 0.8 % of J Σ Jᵀ / aiming 6 cm from the edge with σ = 3 cm, the out probability is predicted 0.043 and 300 shots give 0.060 (1.5 σ binomial) / the landing error for latency τ = 5, 10, 20 ms matches J · (−vτ − ½gτ² ẑ) within 0.2–0.6 % / noise-free rallies reach the cap of 10 shots all 4 times, while σ = 6 cm (1.2 × the bound σ* = 5.2 cm from the margin) ends after 9, 8, 2, 7 shots, all out / with no error the ball lands 0.52 mm from the target. Found on the way: the height of the “reading τ old” was written with + ½gτ² (it is −). The gate puts the same reading error on both sides, so the mistake passed; a numerical integral caught it. With large noise (12 cm from the edge, σ = 5 cm) the prediction is 0.017 and the shots give 0.003; an earlier seed missed by 2.7 σ the other way, so 300 shots cannot tell which way the linearisation errs. Honestly: only the ball position is misread (velocity and spin are true), the noise is independent Gaussian per frame, the racket hits exactly as planned, and an out is judged only by the edge margin. 6 gates, 289 s.* |
↑ The measurement ―― 高さを 5 cm 高く読むと、狙いの計算(灰)は低い弾道を選び、本当の位置から打った球(赤)は狙いより 10.2 cm 手前に落ちる。J の前後の増幅 2.06 × 5 cm = 10.3 cm(一次の予測)。 (figure labels are in Japanese; the numbers are the same)
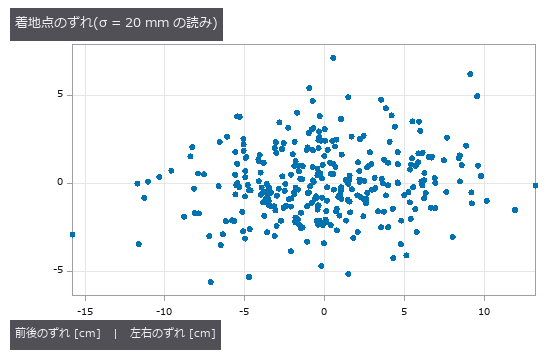
↑ 読みの雑音は 3 方向に同じ大きさでも、着地点のずれは前後に 2.2 倍伸びる(高さの読み違いが落ちる角の分だけ増える)。
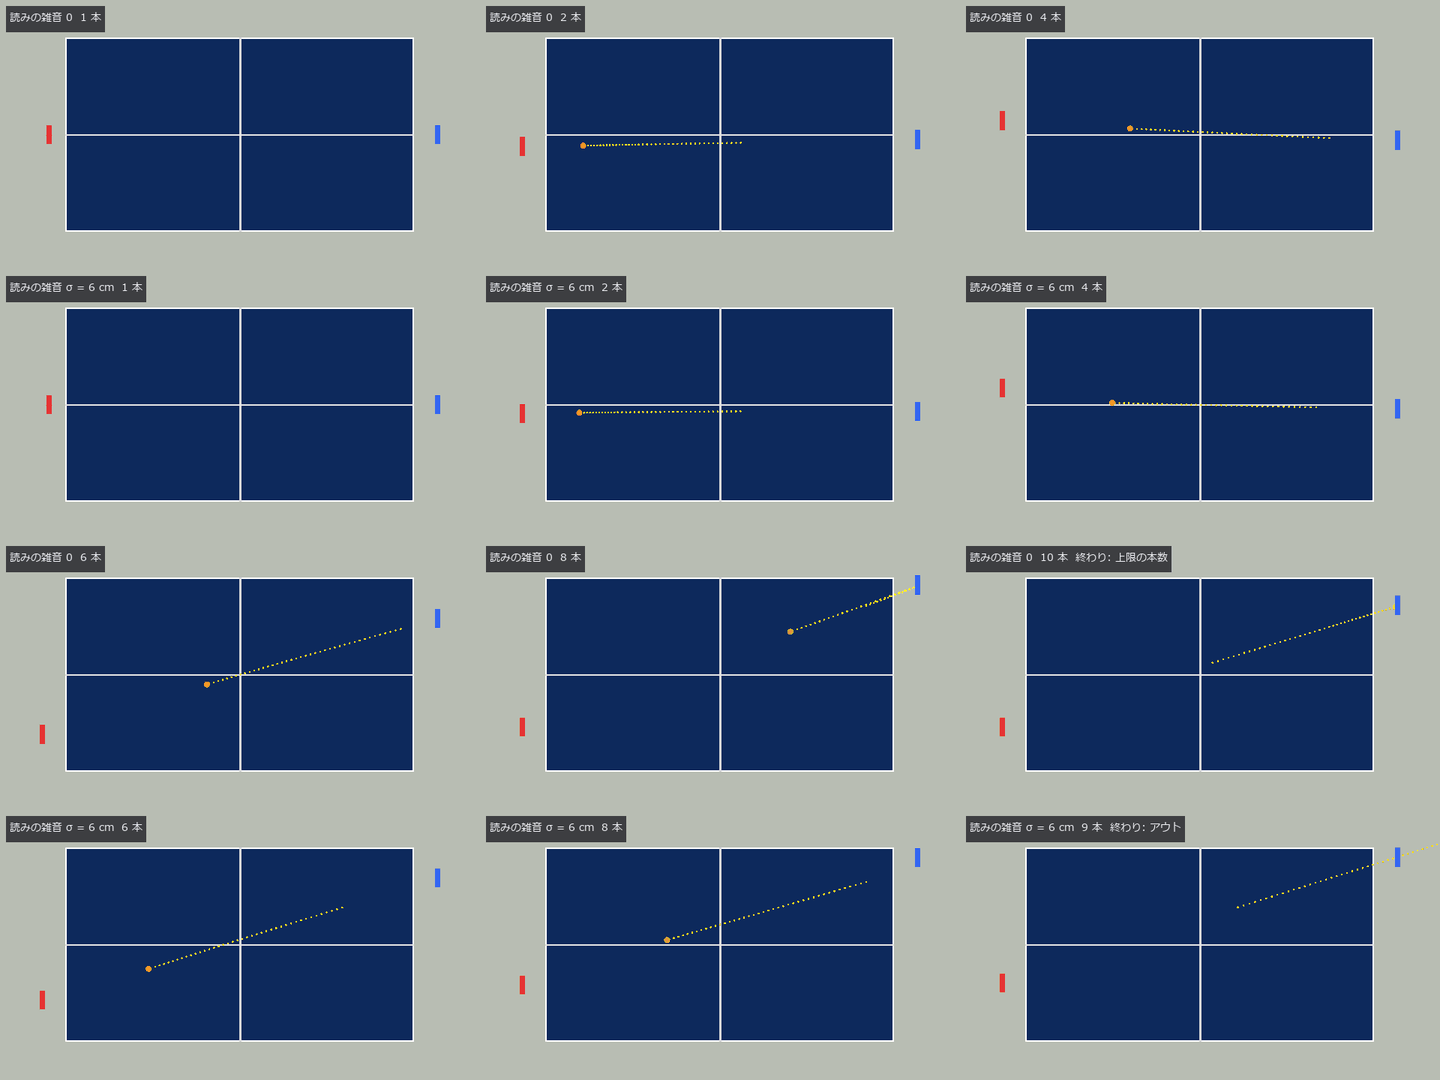
↑ The animation ―― 上から見た送り合い(1/2 速)。上 = 読みの雑音 0 で上限の 10 本、下 = 毎コマの読みに σ = 6 cm で 9 本(アウト)。ラケットは届いている —— 途切れる理由は空振りでなく、読み違いから狙った打球のアウト。
py -3.11 examples/poc_table_tennis_rally_loop.py
Source: examples/poc_table_tennis_rally_loop.py
This run produced 4 figures in total - see them all
Ops used (notes): aim_velocity · ball_params · flight_simulate · impact_params · racket_impact · racket_params · racket_plan · rally_simulate · table_params · text_box
No.2026.145 —— Testing the Periodic Boundary of Temporal Operators with a Seamless Loop
Periodic material carries an exact invariant that any temporal operator must satisfy: for a video of period T, an operator that handles the periodic boundary correctly obeys op(roll(v,k)) == roll(op(v),k) exactly, and any implementation that pads the ends by replication, clamping or truncation breaks it. Because perpetual_loop makes every time-dependent quantity a function of theta, the seam is never created rather than removed (seam ratio 1.0509, where 1 and not 0 is the correct answer), so the truth for that equality is exactly zero difference. No new operator was added. The core finding is that a perfect score came out of an empty output: run with its defaults, three_frame_difference reports a maximum difference of 0.0e+00 and zero contaminated frames, yet only 0 of 32 frames carry any content - the default threshold of 0.1 exceeds the material’s largest frame-to-frame change of 0.0841, so nothing is detected at all, and an empty output shifts to another empty output, agreeing trivially. Lowering the threshold to 0.03 gives the same operator 30 of 32 frames of content, 4 contaminated frames and a maximum difference of 1.000 - the perfect score was a lie. Scanning all sixteen single-input video-to-video operators in the ledger splits them into three groups: windowed operators contaminate only the ends (2 frames for causal frame differencing and optical-flow magnitude, 4 for the moving average, 8 for windowed background subtraction, temporal bilateral and temporal median), so trimming that many frames leaves the rest exactly equivariant; recursive or globally normalising operators contaminate all 32 frames and trimming does not help; and three operators return almost nothing, which reads as zero contamination but is not a pass. The contaminated frames are predictable not merely in count but as a set: a window of width w contaminates roll(B,k) union B, and across w = 3, 5, 7, 9, 11 and 13 the predicted set matched exactly (4, 8, 12, 16, 19, 21). The naive prediction of w-1 frames fails in all six cases and 2(w-1) fails at w = 11, where the two bands overlap by exactly one frame at T = 32 with a shift of 9. The first prediction assumed a centred window and was wrong; subtracting the mismatched sets showed contamination only at the head with the tail untouched, which means the window is trailing rather than centred - the orientation of a window can be read off the shape of the contaminated set without reading the implementation.
↑ Testing the Periodic Boundary of Temporal Operators with a Seamless Loop ―― Periodic material carries an exact invariant that any temporal operator must satisfy: for a video of period T, an operator that handles the periodic boundary correctly obeys op(roll(v,k)) == roll(op(v),k) exactly, and any implementation that pads the ends by replication, clamping or truncation breaks it. Because perpetual_loop makes every time-dependent quantity a function of theta, the seam is never created rather than removed (seam ratio 1.0509, where 1 and not 0 is the correct answer), so the truth for that equality is exactly zero difference. No new operator was added. The core finding is that a perfect score came out of an empty output: run with its defaults, three_frame_difference reports a maximum difference of 0.0e+00 and zero contaminated frames, yet only 0 of 32 frames carry any content - the default threshold of 0.1 exceeds the material’s largest frame-to-frame change of 0.0841, so nothing is detected at all, and an empty output shifts to another empty output, agreeing trivially. Lowering the threshold to 0.03 gives the same operator 30 of 32 frames of content, 4 contaminated frames and a maximum difference of 1.000 - the perfect score was a lie. Scanning all sixteen single-input video-to-video operators in the ledger splits them into three groups: windowed operators contaminate only the ends (2 frames for causal frame differencing and optical-flow magnitude, 4 for the moving average, 8 for windowed background subtraction, temporal bilateral and temporal median), so trimming that many frames leaves the rest exactly equivariant; recursive or globally normalising operators contaminate all 32 frames and trimming does not help; and three operators return almost nothing, which reads as zero contamination but is not a pass. The contaminated frames are predictable not merely in count but as a set: a window of width w contaminates roll(B,k) union B, and across w = 3, 5, 7, 9, 11 and 13 the predicted set matched exactly (4, 8, 12, 16, 19, 21). The naive prediction of w-1 frames fails in all six cases and 2(w-1) fails at w = 11, where the two bands overlap by exactly one frame at T = 32 with a shift of 9. The first prediction assumed a centred window and was wrong; subtracting the mismatched sets showed contamination only at the head with the tail untouched, which means the window is trailing rather than centred - the orientation of a window can be read off the shape of the contaminated set without reading the implementation.
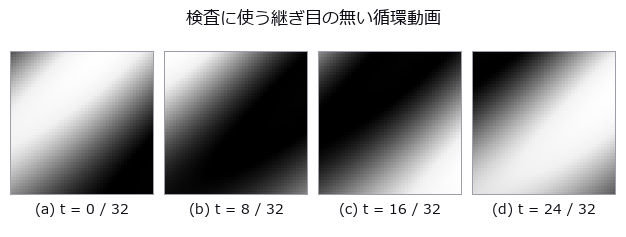
↑ The measurement ―― perpetual_loop("plasma_orbit") の 4 コマ。時間に依る量をすべて θ の関数にしてあるので、t = T は t = 0 と同じ式です —- 継ぎ目は消したのではなく最初から作られていません(継ぎ目の比 1.0509、0 ではなく 1 が正解)。★だから「巡回シフトしても同じ動画」という厳密な真値が素材の側に立ちます。 (figure labels are in Japanese; the numbers are the same)
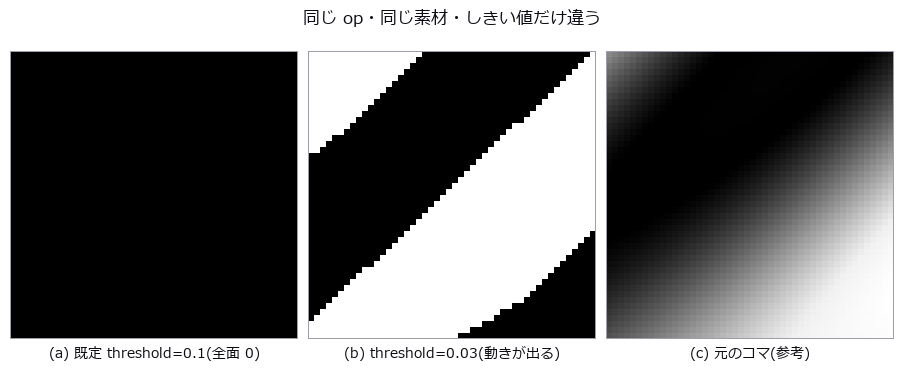
↑ three_frame_difference の同じコマです。
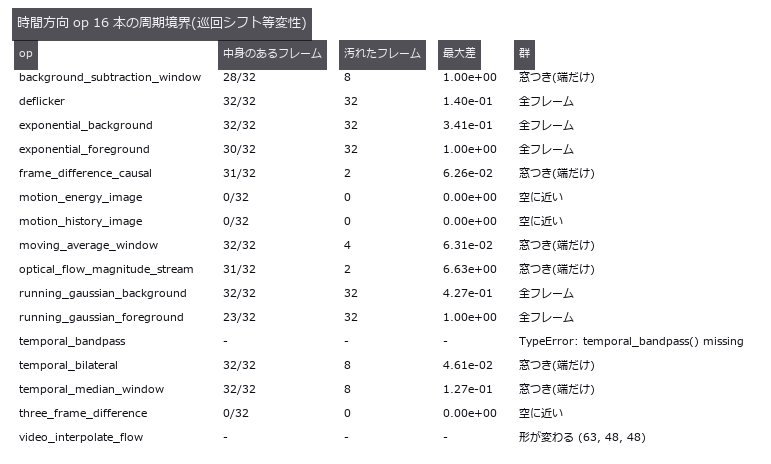
↑ 継ぎ目の無い動画 32 コマを巡回シフトして測った全数走査です。

↑ 窓幅 7 のときに汚れたフレームの位置。
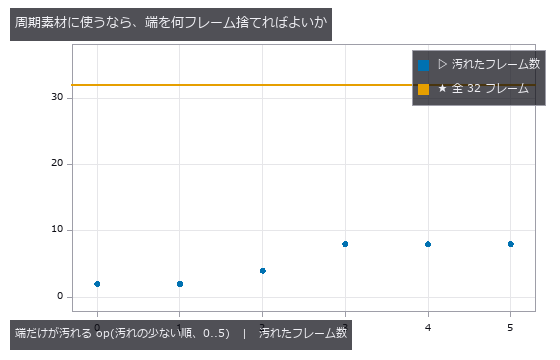
↑ 端だけが汚れる 6 本について、汚れたフレーム数を少ない順に並べたもの。

↑ The animation ―― 同じ動画を実際に回したもの(32 コマ)。最後のコマから最初のコマへ戻るところに継ぎ目が見えません —- 消したのではなく、時間に依る量をすべて θ の関数にしてあるので最初から存在しないからです。★この性質があるので「巡回シフトしても同じ動画」が厳密な真値になり、時間方向 op の周期境界を数で採点できます。
py -3.11 examples/poc_periodic_video_boundary.py
Source: examples/poc_periodic_video_boundary.py
This run produced 9 figures in total - see them all
Ops used (notes): moving_average_window · perpetual_loop · perpetual_loop_seam · three_frame_difference
The Geometry and Calibration Wing — A Small Residual Is Not Proof of Correctness
Reprojection error in camera calibration, seam mismatch in a panorama, residual in point-cloud registration: all are read as ‘smaller is better’. The 19 exhibits here, with ground truth in hand, show where that reading fails.
Reprojection RMS of 0.0688–0.0690 px alongside focal-length errors of 0.026–7.334 %. Adjacent seams at 0.12 px while the single closing seam opens by 1.5 px. Spheres and cylinders converging to the same residual with an arbitrary pose. Least squares drives the residual down to the noise; whether it lands on the truth is a separate question.
A trap in the measuring procedure itself is kept on display: fix one point cloud and sweep only the pose, and you still have a sample of one — the random seed alone produced both ‘0 % quadrant errors’ and ‘100 %’. About the only absolute quantity measurable without ground truth is the loop-closure error of a full 360-degree sweep.
No.2026.006 —— A Reprojection Error of 0.05 px Guarantees Nothing
A small reprojection residual does not ensure correct camera focal length. Grid points from known poses were recalibrated, yielding 7.334 % focal-length error for shallow board tilt. The residual barely changes while internal parameters collapse, yet optimization still returns a plausible answer.
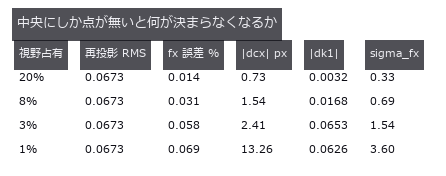
↑ A Reprojection Error of 0.05 px Guarantees Nothing ―― Grid points projected with known intrinsics and poses, re-calibrated, and the error split by component. With the board tilted 32 / 8 / 2 degrees the reprojection RMS spans 0.0688 to 0.0690 px (ratio 1.00) while the focal-length error spans 0.026 to 7.334 % (281x). With a distorting camera the degeneracy gate never fires, and the non-linear optimiser returns an answer even for a fronto-parallel board.
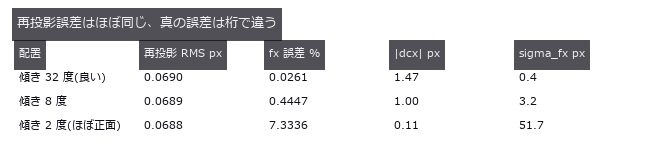
↑ The measurement ―― RMS は 1.00 倍しか動かないのに fx 誤差は 281 倍動く。配置の良し悪しを映すのは sigma_fx のほう。 (figure labels are in Japanese; the numbers are the same)
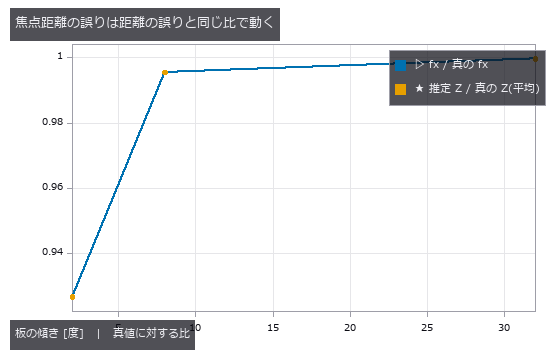
↑ 2 本は重なる。
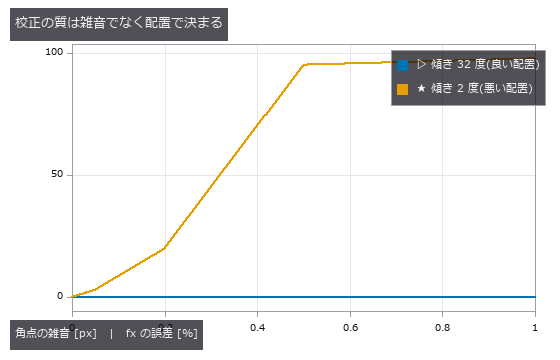
↑ どちらも雑音 0 では真値。
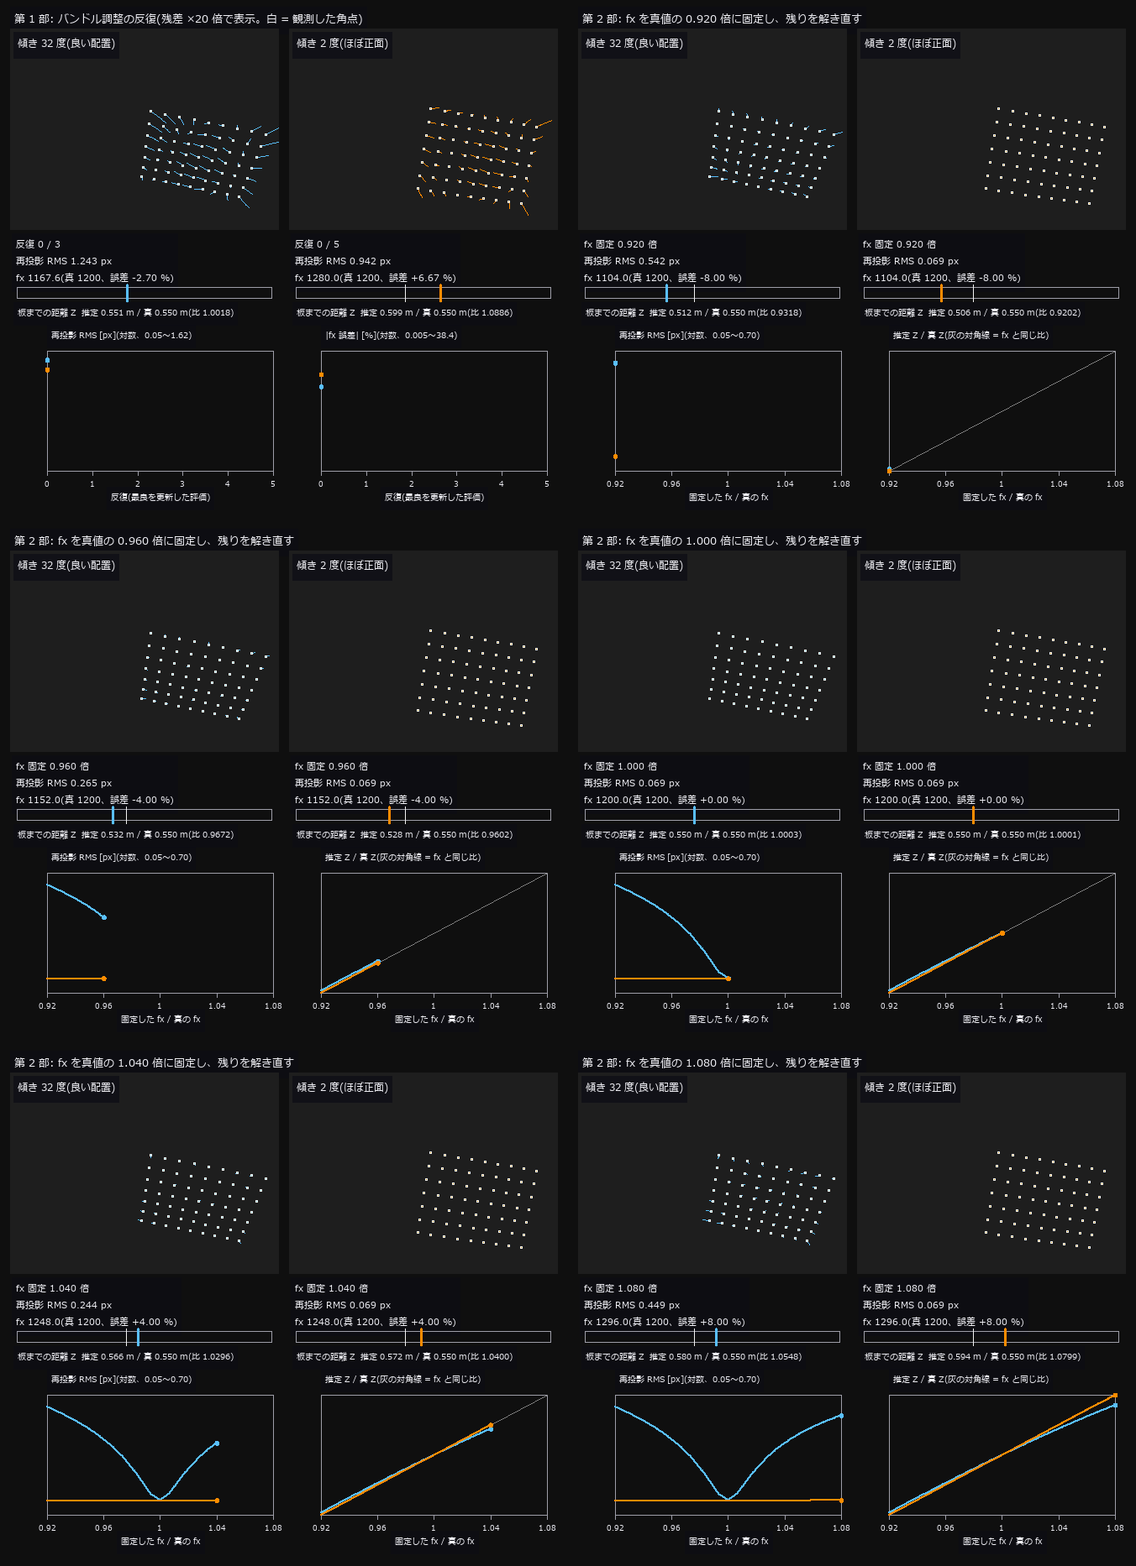
↑ The animation ―― 第 1 部: 同じ雑音 0.05 px の観測を、傾き 32 度(左)と 2 度(右)の配置で解く反復。再投影 RMS はどちらも 0.069 / 0.069 px まで下がるが、fx は左が 1199.7(誤差 0.026 %)、右が 1112.0(誤差 7.33 %)で止まる。第 2 部: fx を真値の 0.92〜1.08 倍に固定して残りを解き直すと、左は RMS が 0.54 / 0.45 px(両端)まで跳ね上がるのに、右は 0.069 / 0.069 px とほとんど動かない —— 板までの距離 Z が fx と同じ比で動いて(Z 比 0.920 / 1.080)、画素の位置を保つため。右の配置では再投影誤差が焦点距離について何も言っていない。
py -3.11 examples/poc_camera_calibration.py
Source: examples/poc_camera_calibration.py
This run produced 5 figures in total - see them all
Ops used (notes): axes_frame · axes_transform · camera_calibration · data_to_pixel · plot_series · project_points · reprojection_error · text_box · ticks
No.2026.028 —— Chain the Neighbours Together and You Cannot Get Back Where You Started
36 frames cut from a cylindrical panorama by a known rotation sequence and chained pairwise around a full turn. Adjacent seams agree to 0.12 px, yet the one closing seam opens by 1.5 px (13x). The buried bundle_adjust_mosaic did not beat the chain (30 of 36 frames were left as the identity); the worst pose error goes from 1.65 px for the chain to 0.56 px with global optimisation.
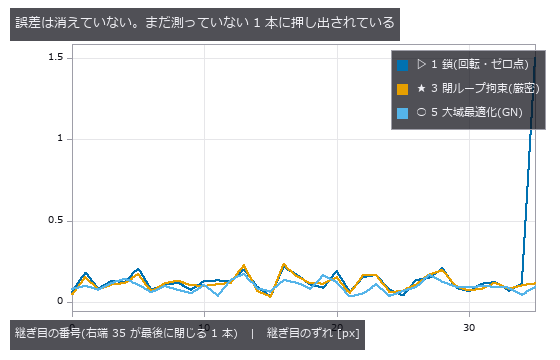
↑ Chain the Neighbours Together and You Cannot Get Back Where You Started ―― 36 frames cut from a cylindrical panorama by a known rotation sequence and chained pairwise around a full turn. Adjacent seams agree to 0.12 px, yet the one closing seam opens by 1.5 px (13x). The buried bundle_adjust_mosaic did not beat the chain (30 of 36 frames were left as the identity); the worst pose error goes from 1.65 px for the chain to 0.56 px with global optimisation.

↑ The measurement ―― 系 2(等分)は閉ループ誤差を下げるのに姿勢はかえって悪化する。新しい観測を足さずに効くのは系 3。 (figure labels are in Japanese; the numbers are the same)
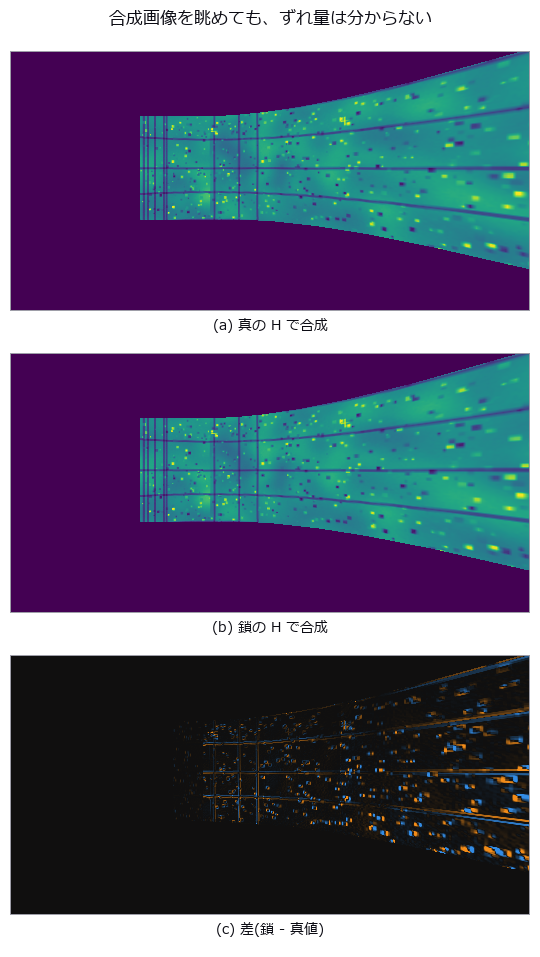
↑ 上 2 枚はどちらも継ぎ目が綺麗に見える(後勝ちの上書きで混合しないため)。
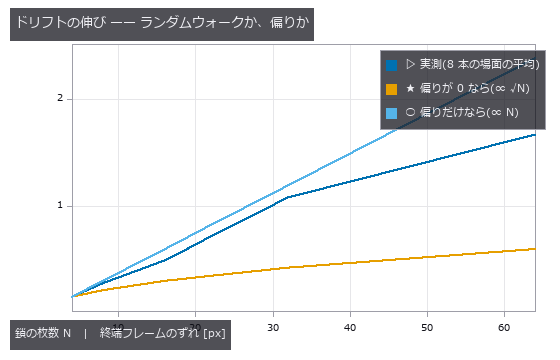
↑ 実測 log-log 傾き 0.89。
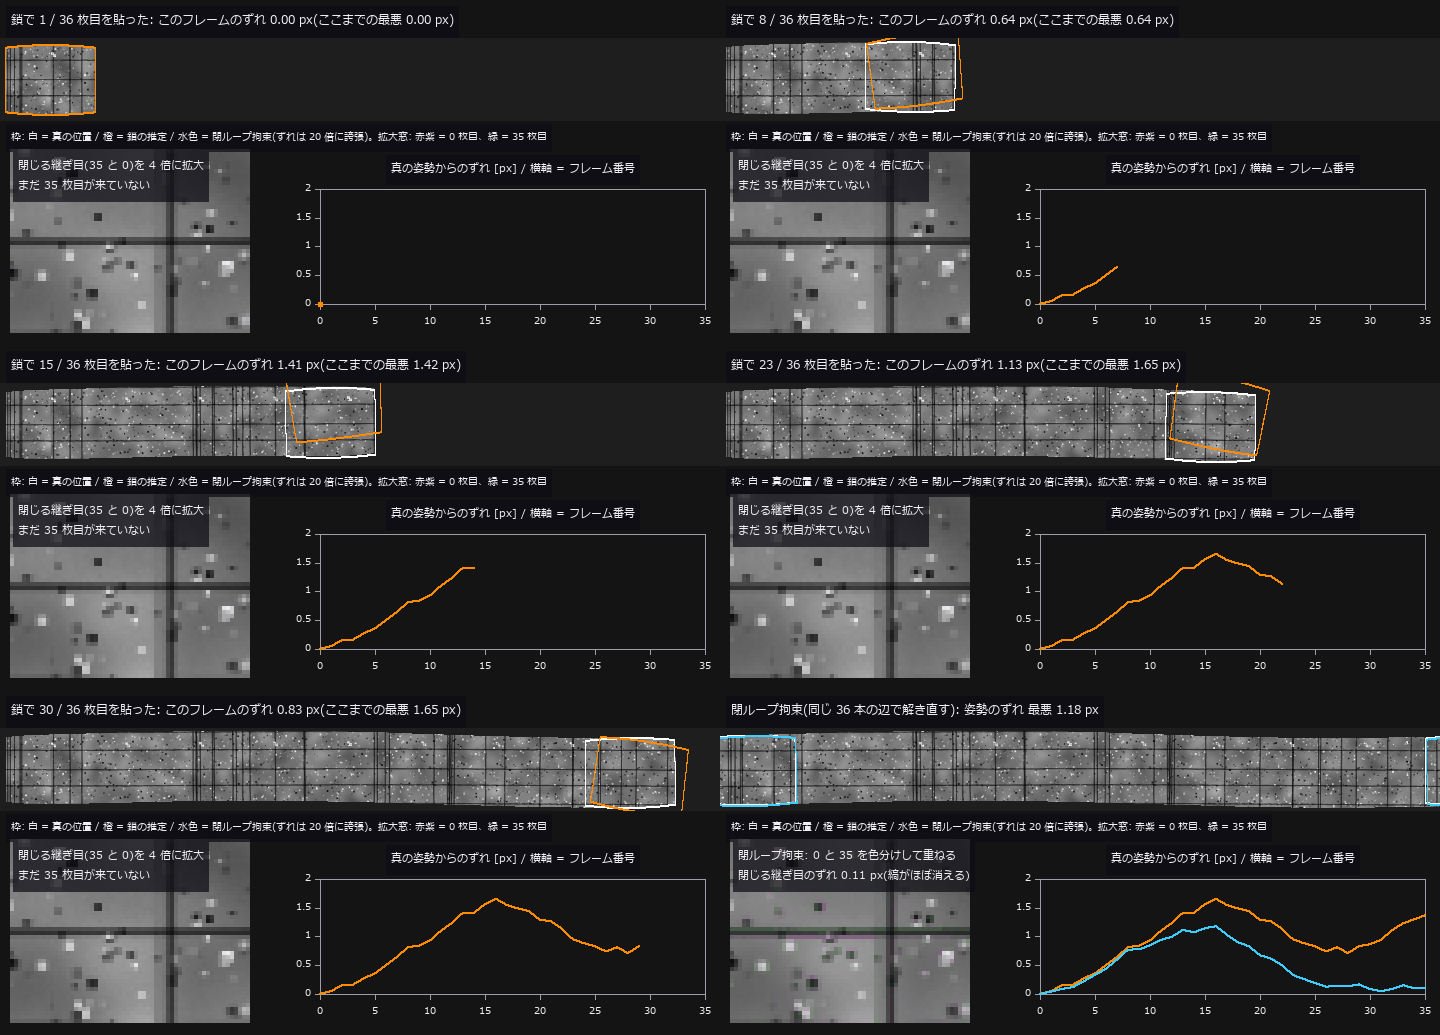
↑ The animation ―― 鎖(隣どうしの相対回転を掛けるだけ)で 36 枚を円筒に 1 枚ずつ貼る過程。白い枠が真の位置、橙の枠が鎖の推定位置(ずれを 20 倍に誇張)。隣どうしの継ぎ目は平均 0.119 px で合っているのに、真の姿勢からのずれ(右下の曲線)は積み上がって最悪 1.65 px(フレーム 16)。一周して 0 枚目(赤紫)と35 枚目(緑)を重ねると閉じる継ぎ目が 1.50 px 開き、縁に色の縞(二重像)が出る(左下、4 倍拡大)。最後に同じ 36 本の辺を閉ループ拘束で解き直すと(水色)、姿勢のずれは最悪 1.18 px、閉じる継ぎ目は 0.11 px。
py -3.11 examples/poc_panorama_drift.py
Source: examples/poc_panorama_drift.py
This run produced 5 figures in total - see them all
Ops used (notes): axes_frame · axes_transform · hom_vector_to_proj_hom_mat2d · plot_series · pose_error · text_box · ticks · warp_by_plane
No.2026.108 —— Measuring on a Real Stereo Photograph — Three Stumbles Synthesis Never Produces
The first exhibit in this museum measured on a real photograph (Middlebury 2014 motorcycle, with ground-truth disparity). The distributor’s own note says the holes in the truth are NaN; they are +inf, so np.nanmedian reports a median disparity of 44.97 px instead of 42.55 px, while fill_disparity and apply_cmap — which test with isfinite — handle them correctly. The default max_disp=16 scores bad2 95.06 %: any search range below the true maximum of 59.91 px loses the whole foreground, so the cliff sits between 48 and 64, which geometry predicts before any measurement. Against a 94.04 % null, SGM scores 15.81 %, and discarding the least confident 40 % takes it to 6.80 %. Converting to metric depth bends the scene: depth_from_disparity had no principal-point offset, and ignoring the real doffs of 31.086 px puts points 1.519 to 5.243 times too far — no single scale repairs it, since the best factor of 0.3733 still leaves 958.3 mm RMS over a 2889 mm range, pushing far surfaces +1676 mm out and pulling near ones -926 mm in. The argument was added here, and it reproduces the closed form exactly.
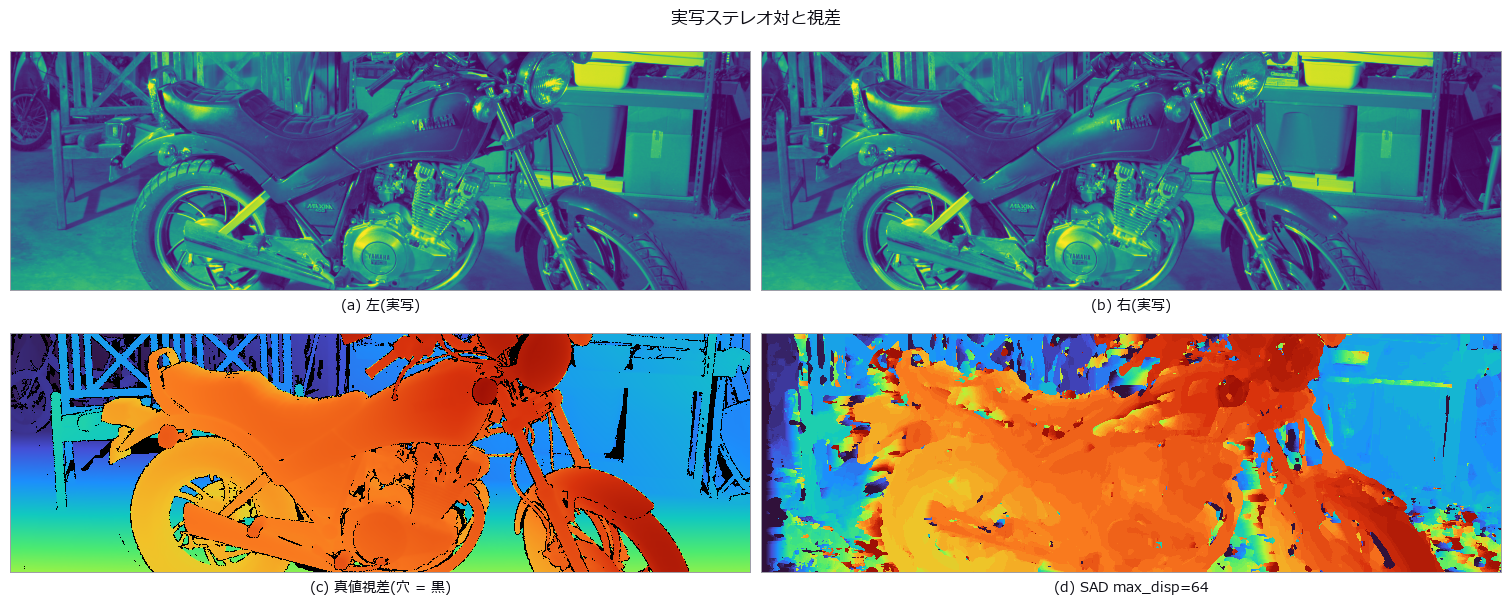
↑ Measuring on a Real Stereo Photograph — Three Stumbles Synthesis Never Produces ―― The first exhibit in this museum measured on a real photograph (Middlebury 2014 motorcycle, with ground-truth disparity). The distributor’s own note says the holes in the truth are NaN; they are +inf, so np.nanmedian reports a median disparity of 44.97 px instead of 42.55 px, while fill_disparity and apply_cmap — which test with isfinite — handle them correctly. The default max_disp=16 scores bad2 95.06 %: any search range below the true maximum of 59.91 px loses the whole foreground, so the cliff sits between 48 and 64, which geometry predicts before any measurement. Against a 94.04 % null, SGM scores 15.81 %, and discarding the least confident 40 % takes it to 6.80 %. Converting to metric depth bends the scene: depth_from_disparity had no principal-point offset, and ignoring the real doffs of 31.086 px puts points 1.519 to 5.243 times too far — no single scale repairs it, since the best factor of 0.3733 still leaves 958.3 mm RMS over a 2889 mm range, pushing far surfaces +1676 mm out and pulling near ones -926 mm in. The argument was added here, and it reproduces the closed form exactly.

↑ The measurement ―― 下位 4 割を捨てると bad2 は 26.75 % -> 6.80 %。 (figure labels are in Japanese; the numbers are the same)
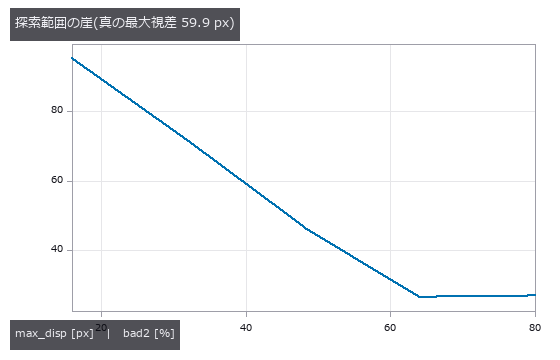
↑ 真の最大視差を下回る設定は前景を丸ごと失う。
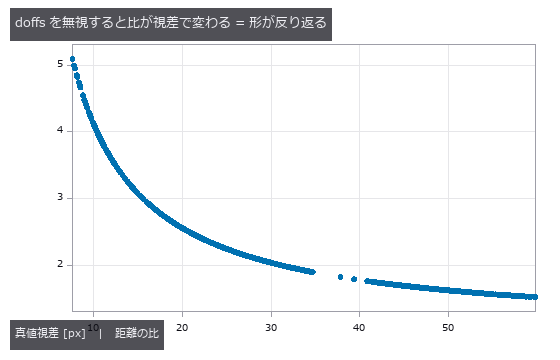
↑ 単一のスケールでは直らない(最良でも残差 958 mm RMS)。
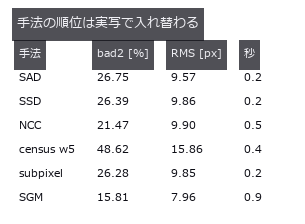
↑ census が最下位なのは窓が 64 bit で頭打ちだから。
py -3.11 examples/poc_real_stereo_depth.py
Source: examples/poc_real_stereo_depth.py
This run produced 5 figures in total - see them all
No.2026.034 —— The Convergence Basin of Point-Cloud Registration — How Far Off Can the Initial Pose Be?
ICP (iterative closest point) success rate contoured against the initial pose error, with the point cloud re-sampled on every trial. With no translation offset, success drops below 50 % at 90 degrees for point-to-point and 120 degrees for point-to-plane. Spheres and cylinders converge to the same residual with an arbitrary pose; with the global method all 16 of 16 trials appear converged and the pose is wrong — undetectable from the residual.
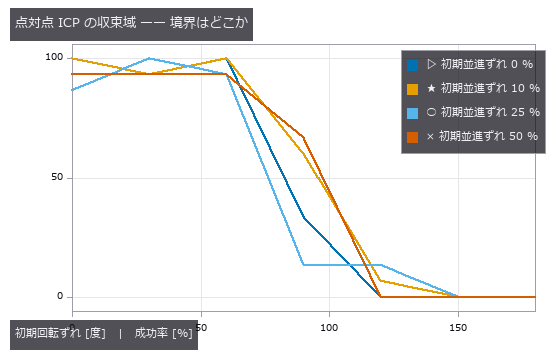
↑ The Convergence Basin of Point-Cloud Registration — How Far Off Can the Initial Pose Be? ―― ICP (iterative closest point) success rate contoured against the initial pose error, with the point cloud re-sampled on every trial. With no translation offset, success drops below 50 % at 90 degrees for point-to-point and 120 degrees for point-to-plane. Spheres and cylinders converge to the same residual with an arbitrary pose; with the global method all 16 of 16 trials appear converged and the pose is wrong — undetectable from the residual.
Terms: ICP — A registration method that alternates nearest-point correspondence with rigid-transform estimation between two point clouds.
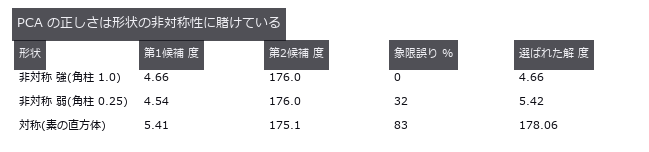
↑ The measurement ―― 非対称性が消えると 4 候補が形として区別できず、選択が崩れる(選ばれた解が第 1 候補から離れる)。 (figure labels are in Japanese; the numbers are the same)
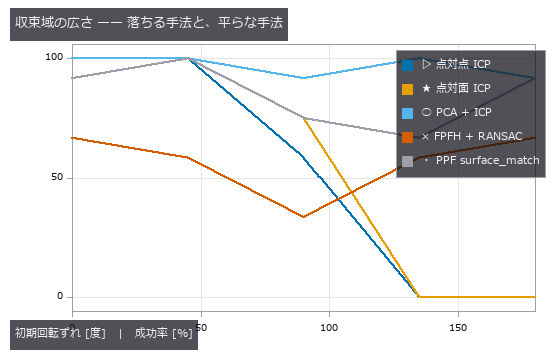
↑ 平らな線ほど「広い」。
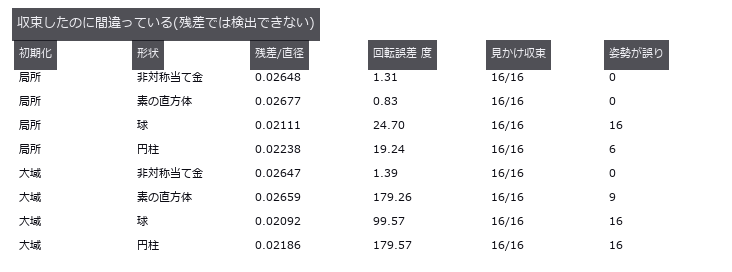
↑ 球・円柱は残差が小さいまま姿勢が任意。
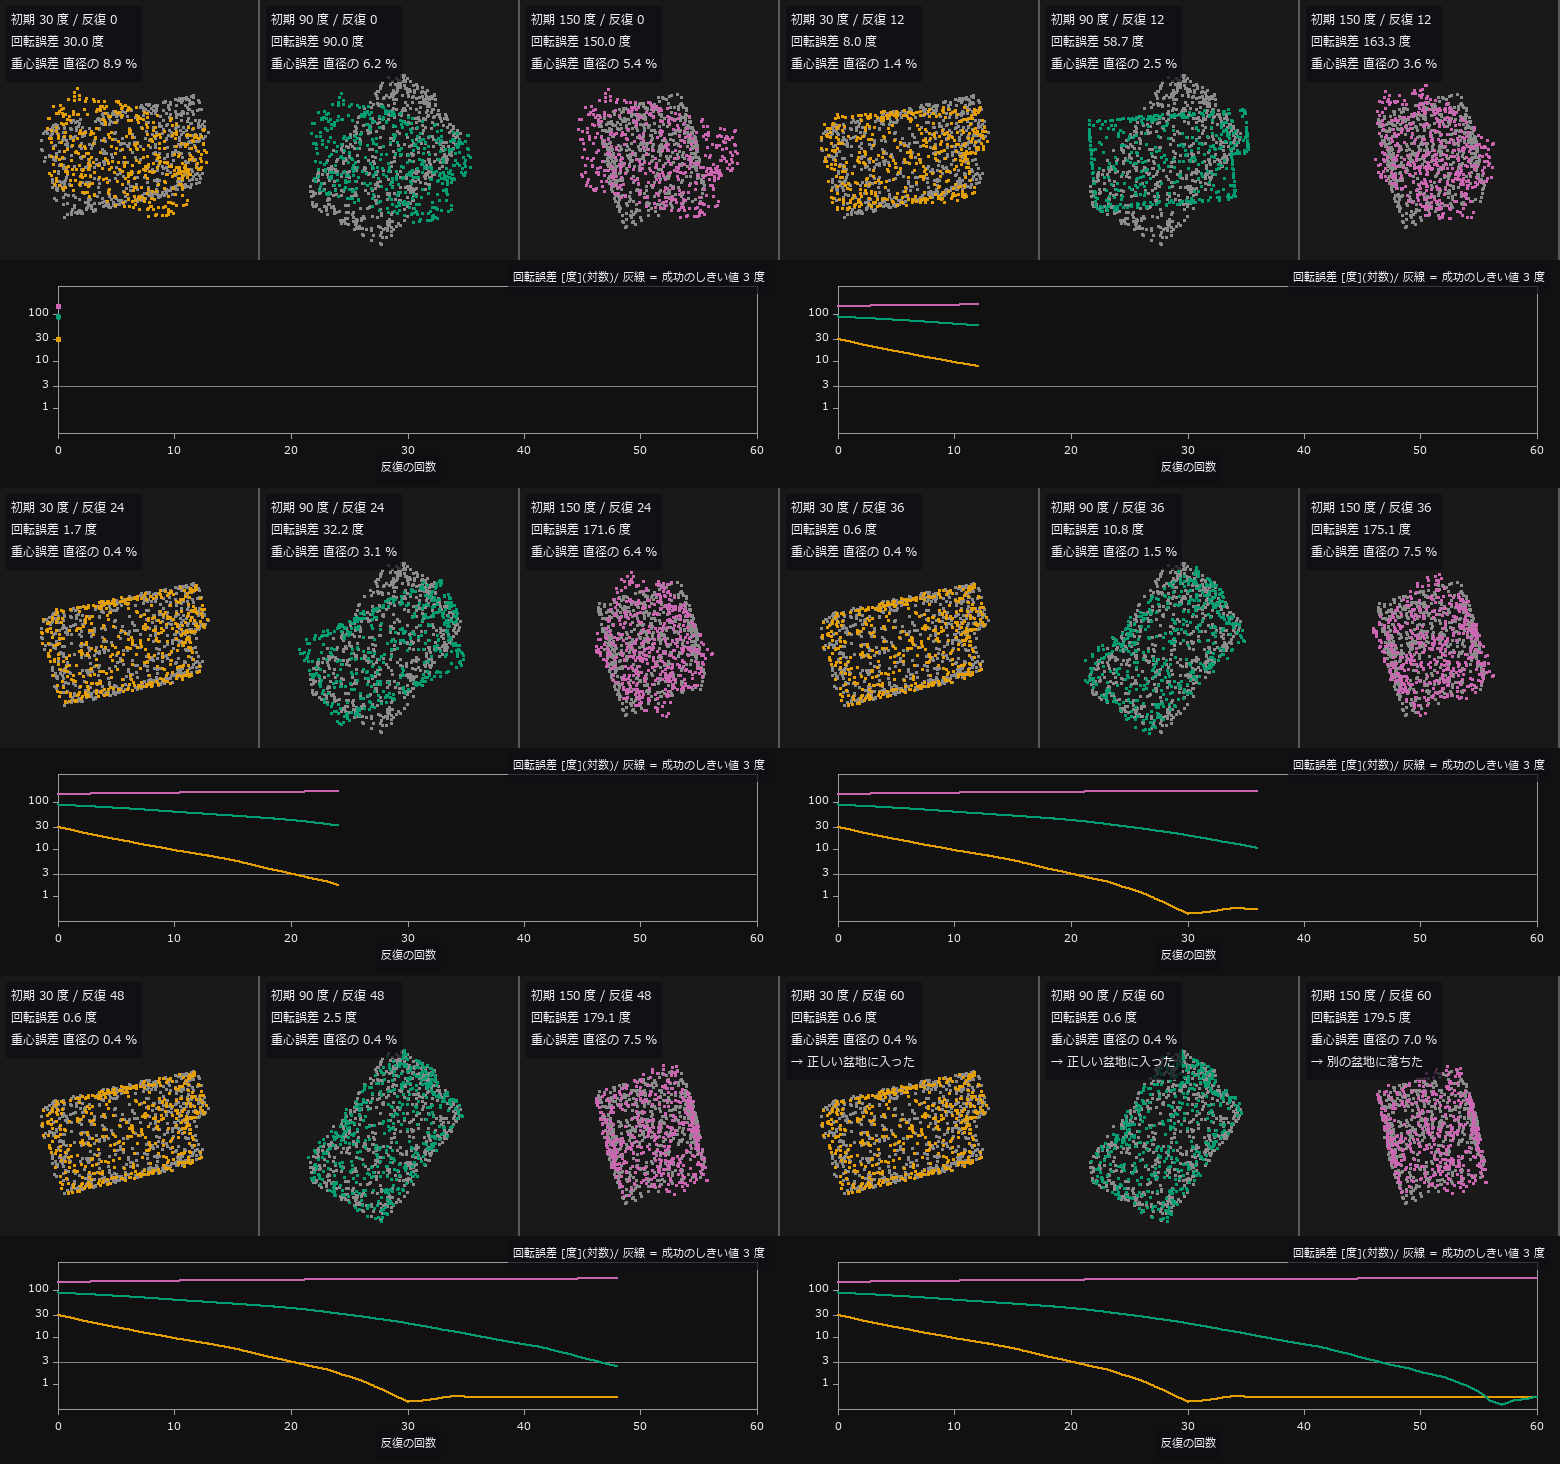
↑ The animation ―― 点対点 ICP を 1 反復ずつ動かす(fs.icp(max_iter=1) を前回の姿勢から連鎖)。灰 = 目標の点群、色 = 動かしている点群(斜めから見た正射影)。同じ回転軸で初期回転ずれだけを 30 / 90 / 150 度と変え、並進ずれは直径の 10 %。反復予算は本文の点対点 ICP と同じ 60 回で、その後の回転誤差: 30 度 → 0.6 度(成功)、90 度 → 0.6 度(成功)、150 度 → 179.5 度(失敗)。下の曲線は回転誤差の推移(対数、灰線 = 成功のしきい値 3 度)。動画専用に取り直した 1 組の点群での 1 試行の軌跡で、成功率は第 2 章の表。
py -3.11 examples/poc_registration_basin.py
Source: examples/poc_registration_basin.py
This run produced 5 figures in total - see them all
Ops used (notes): axes_frame · axes_transform · estimate_normals · farthest_point_sampling · plot_series · text_box · ticks
No.2026.117 —— Which Quantities Really Survive a Rotation — Auditing Invariance on a Real Coin
Shape features are routinely called rotation-invariant, but the pixel grid is not invariant under rotation, so the claim usually breaks at a helper — how the boundary is counted, how the image is interpolated, where the threshold lands. A real photograph (scikit-image coins, Greek coins from Pompeii, British Museum) is turned through a full circle in 5-degree steps and the wobble is split into three arms: A rotate the greyscale and re-threshold (what people actually do), B rotate the 0-degree binary mask with nearest neighbour (re-rasterisation only), C multiples of 90 degrees via np.rot90 (exact). The rotation itself is done with scipy, not with fullseye — measuring your own invariance with your own rotation hides errors that lean the same way. Arm C is exactly 0.00 % for all seven quantities: the measurements carry no orientation bias at all, so every bit of the wobble is the cost of re-laying the boundary on the grid. The prediction was wrong: rotating the binary mask turns out to be far worse than interpolating the grey — perimeter 2.52 % (A) vs 9.47 % (B), circularity 4.82 % vs 20.45 %. Nearest-neighbour rotation re-lays a staircase; interpolating the grey re-derives the boundary from the underlying continuous signal. Rotate the greyscale, never the mask. A synthetic square anchors the closed form: the 4-connected staircase perimeter of a square rotated 45 degrees is bounded by 4L → 4L√2 (+41.4 %), but the measured swing is 7.91 % because regionprops applies a Crofton-style correction — the closed form is a ceiling, not a prediction. Finally, check the denominator: Hu[1] is ~0 for a near-circular blob (3.9e-04), so its 29.6 % relative spread means nothing at all.
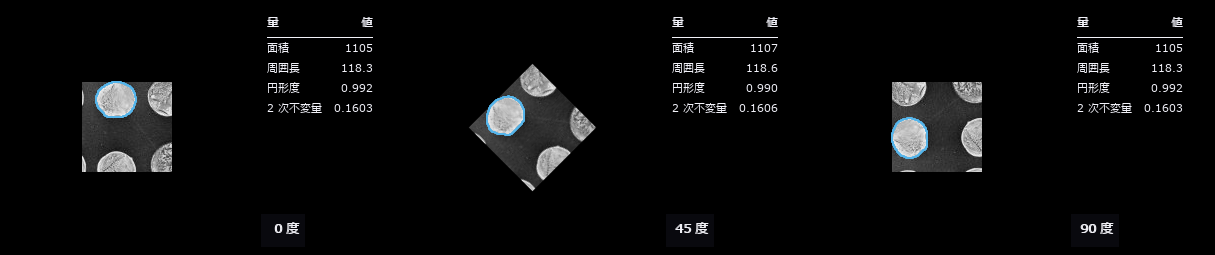
↑ Which Quantities Really Survive a Rotation — Auditing Invariance on a Real Coin ―― Shape features are routinely called rotation-invariant, but the pixel grid is not invariant under rotation, so the claim usually breaks at a helper — how the boundary is counted, how the image is interpolated, where the threshold lands. A real photograph (scikit-image coins, Greek coins from Pompeii, British Museum) is turned through a full circle in 5-degree steps and the wobble is split into three arms: A rotate the greyscale and re-threshold (what people actually do), B rotate the 0-degree binary mask with nearest neighbour (re-rasterisation only), C multiples of 90 degrees via np.rot90 (exact). The rotation itself is done with scipy, not with fullseye — measuring your own invariance with your own rotation hides errors that lean the same way. Arm C is exactly 0.00 % for all seven quantities: the measurements carry no orientation bias at all, so every bit of the wobble is the cost of re-laying the boundary on the grid. The prediction was wrong: rotating the *binary mask turns out to be far worse than interpolating the grey — perimeter 2.52 % (A) vs 9.47 % (B), circularity 4.82 % vs 20.45 %. Nearest-neighbour rotation re-lays a staircase; interpolating the grey re-derives the boundary from the underlying continuous signal. Rotate the greyscale, never the mask. A synthetic square anchors the closed form: the 4-connected staircase perimeter of a square rotated 45 degrees is bounded by 4L → 4L√2 (+41.4 %), but the measured swing is 7.91 % because regionprops applies a Crofton-style correction — the closed form is a ceiling, not a prediction. Finally, check the denominator: Hu[1] is ~0 for a near-circular blob (3.9e-04), so its 29.6 % relative spread means nothing at all.*
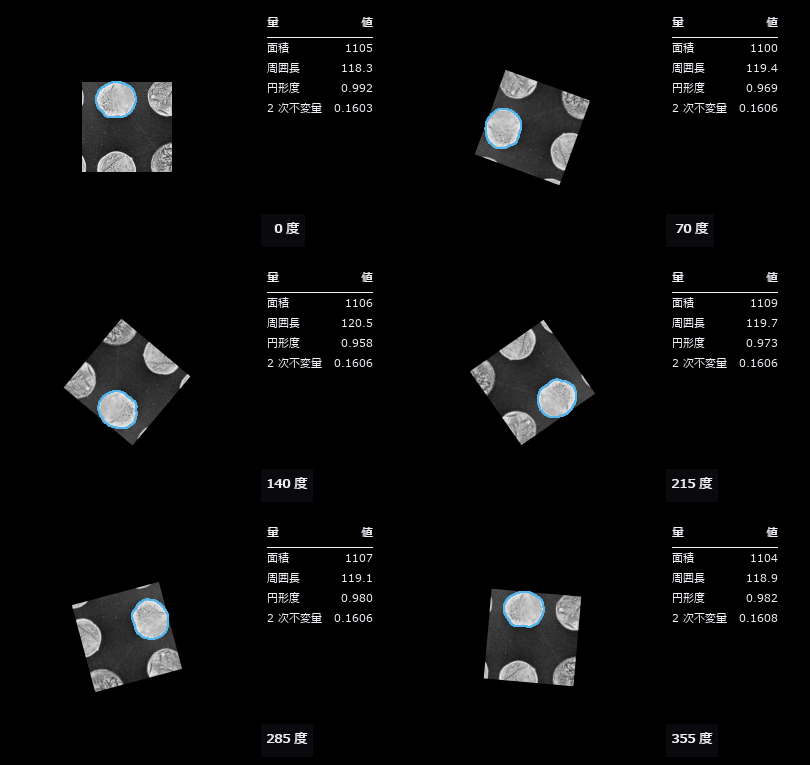
↑ The measurement ―― 実写の硬貨を 5 度ずつ 1 周。地がモノクロなので輪郭は彩度のある色で描いている(灰色には彩度が無いので、どの階調とも色相で区別がつく)。右の表の数字がどれだけ揺れるかが見える。 (figure labels are in Japanese; the numbers are the same)
py -3.11 examples/poc_rotation_invariance_audit.py
Source: examples/poc_rotation_invariance_audit.py
This run produced 2 figures in total - see them all
Ops used (notes): annotate_outline · annotate_table · blob_features · blob_label · circularity · eccentricity · moments_region_2nd_invar · moments_region_central_invar · text_box
No.2026.190 —— One Scene, Two Worlds — Scoring a Photoreal Simulator’s Depth Against a Closed-Form Truth, Side by Side with Our Own World
The author’s wish: “put the finished form of everything we built into the most realistic environment there is” — so, both environments. Our own world (all ground truth, not photoreal) and the external photoreal simulator CARLA 0.9.16 (code MIT, assets CC-BY; photoreal, but its formulas are hidden) are joined by a bridge, carlabridge (25 ops, numpy only). On a straight in Town04 a lead car is placed 8–64 m ahead and RGB, depth and semantic images are captured; the recorded poses (left-handed, degrees) are mapped to our right-handed frame and the image-plane distance to the rear face is computed in closed form; the same rule-based perception (median depth over car-labelled pixels) is applied to CARLA’s image and to our own world re-rendered with the same intrinsics and mounting. CARLA’s depth sits +0.10 m from the truth in every frame (bounding-box origin offset), our re-render within ±0.3 m, the car pixel count follows 1/d² in both (log-log slopes −1.94 / −1.99) with pixel ratios 0.90–1.08. Gates: rotation matrices equal CARLA’s own get_matrix, camera pose equals look_at, depth round-trips within one quantisation step, world → record → re-render is pixel-identical. Honestly: CARLA’s truth itself cannot be verified — what is verified is that the conventions are invertible and agree with the closed form; agreement is not proof of correctness. CARLA imagery uses CC-BY assets (CARLA team).

↑ One Scene, Two Worlds — Scoring a Photoreal Simulator’s Depth Against a Closed-Form Truth, Side by Side with Our Own World ―― The author’s wish: “put the finished form of everything we built into the most realistic environment there is” — so, both environments. Our own world (all ground truth, not photoreal) and the external photoreal simulator CARLA 0.9.16 (code MIT, assets CC-BY; photoreal, but its formulas are hidden) are joined by a bridge, carlabridge (25 ops, numpy only). On a straight in Town04 a lead car is placed 8–64 m ahead and RGB, depth and semantic images are captured; the recorded poses (left-handed, degrees) are mapped to our right-handed frame and the image-plane distance to the rear face is computed in closed form; the same rule-based perception (median depth over car-labelled pixels) is applied to CARLA’s image and to our own world re-rendered with the same intrinsics and mounting. CARLA’s depth sits +0.10 m from the truth in every frame (bounding-box origin offset), our re-render within ±0.3 m, the car pixel count follows 1/d² in both (log-log slopes −1.94 / −1.99) with pixel ratios 0.90–1.08. Gates: rotation matrices equal CARLA’s own get_matrix, camera pose equals look_at, depth round-trips within one quantisation step, world → record → re-render is pixel-identical. Honestly: CARLA’s truth itself cannot be verified — what is verified is that the conventions are invertible and agree with the closed form; agreement is not proof of correctness. CARLA imagery uses CC-BY assets (CARLA team).

↑ The measurement ―― 先行車の後ろ面までの像面距離の真値は記録の姿勢から閉形式で出す。車のラベルの画素の深度の中央値は CARLA で全コマ +0.1 m、自前の描き直しで ±0.3 m。最下行から平らな路面の式で出す距離は後輪の接地を見るのでバンパーより 0.5 m ほど先を指す。 (figure labels are in Japanese; the numbers are the same)

↑ 像面に平行な後ろ面の面積は距離の 2 乗に反比例する。
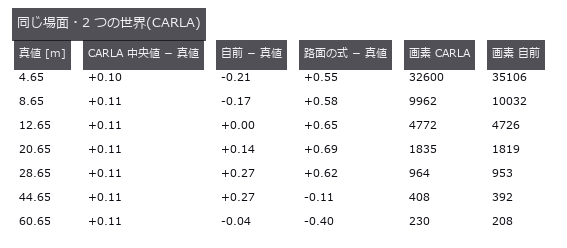
↑ コマごとの数字。
py -3.11 examples/poc_carla_bridge.py
Source: examples/poc_carla_bridge.py
This run produced 4 figures in total - see them all
Ops used (notes): camera_pose_to_carla · carla_camera_pose · carla_depth_decode · carla_depth_encode · carla_label_map · carla_label_unmap · carla_labels · carla_rotation_angles · carla_scene_load · carla_scene_save · carla_scene_synthetic · carla_transform_matrix · intrinsics_to_fullseye · lead_truth_depth · scene_pair_table
No.2026.191 —— Assembling One Town — Auto-Joining Driving-School Elements, Driving Through from Entry to Exit, and Scoring Every Stop Line on the Way
| The foundation for the author’s plan “one capstone per PoC series, driving first”. The intersection, railway crossing, slope and parallel-parking bay that earlier PoCs placed and scored one at a time are joined into a single road by the new module drivetown (10 ops): element k+1’s entry is placed onto element k’s exit in closed form with a 0.05 m overlap. The default town has 9 elements over 235.1 m. A longitudinal-only driver follows the centreline, treats the next stop line as a stationary lead vehicle for IDM braking, waits 2 s at the intersection and looks left and right at the crossing before moving on, and if the warning is active it waits until the barrier is up (the crossing carries gated warning posts, booms and a train driven by the interpretation-standard state machine). The rule pack town_rules gives JP = left-hand traffic with a mandatory stop and look at crossings, US and DE = right-hand traffic stopping only while the warning is active; packs other than JP are marked verified False because their primary sources have not been checked. Figures: the town from above (polygons, centreline, stop lines, stopping positions, signals), speed and acceleration over time, an on-board drive-through (stopped at red → moving on green → booms down → train passing → booms up and moving → before the slope), and a table of 9 rule-pack runs, and the 159-scene curriculum ledger. 38 gates: with a train warning at 20 s the car leaves the crossing at 65.50 s ≥ booms fully up at 65.45 s with zero time on the crossing while forbidden, JP stops twice while US/DE stop once without a train, the right-hand stop line mirrors about the intersection centre (s 40.95 ↔ 65.95), the boom covers 1078 pixels and the train 46,129 pixels in the on-board frames, joint position error minus overlap 1.1e-14 at all 8 joints with zero heading error, total length equals Σ centerline_length − 0.05 × 8 exactly, stop-line positions in closed form from the regulation dimensions, stops 0.537 / 0.536 m short of the lines, | a | at most 1.877 ≤ 3, trapezoidal ∫v dt matches s to 3.9e-11 m, braking distance ≥ v²/2b, the existing crossing_stop_check passes, and the same commands fed to long_simulate (RK4) stop within 0.002 m. Honestly: lateral motion is pinned to the centreline, the signal is “green after 2 s” without reading the lamp, there are no other vehicles or pedestrians, and the US/DE hold times reuse the JP values. |
| *↑ Assembling One Town — Auto-Joining Driving-School Elements, Driving Through from Entry to Exit, and Scoring Every Stop Line on the Way ―― The foundation for the author’s plan “one capstone per PoC series, driving first”. The intersection, railway crossing, slope and parallel-parking bay that earlier PoCs placed and scored one at a time are joined into a single road by the new module drivetown (10 ops): element k+1’s entry is placed onto element k’s exit in closed form with a 0.05 m overlap. The default town has 9 elements over 235.1 m. A longitudinal-only driver follows the centreline, treats the next stop line as a stationary lead vehicle for IDM braking, waits 2 s at the intersection and looks left and right at the crossing before moving on, and if the warning is active it waits until the barrier is up (the crossing carries gated warning posts, booms and a train driven by the interpretation-standard state machine). The rule pack town_rules gives JP = left-hand traffic with a mandatory stop and look at crossings, US and DE = right-hand traffic stopping only while the warning is active; packs other than JP are marked verified False because their primary sources have not been checked. Figures: the town from above (polygons, centreline, stop lines, stopping positions, signals), speed and acceleration over time, an on-board drive-through (stopped at red → moving on green → booms down → train passing → booms up and moving → before the slope), and a table of 9 rule-pack runs, and the 159-scene curriculum ledger. 38 gates: with a train warning at 20 s the car leaves the crossing at 65.50 s ≥ booms fully up at 65.45 s with zero time on the crossing while forbidden, JP stops twice while US/DE stop once without a train, the right-hand stop line mirrors about the intersection centre (s 40.95 ↔ 65.95), the boom covers 1078 pixels and the train 46,129 pixels in the on-board frames, joint position error minus overlap 1.1e-14 at all 8 joints with zero heading error, total length equals Σ centerline_length − 0.05 × 8 exactly, stop-line positions in closed form from the regulation dimensions, stops 0.537 / 0.536 m short of the lines, | a | at most 1.877 ≤ 3, trapezoidal ∫v dt matches s to 3.9e-11 m, braking distance ≥ v²/2b, the existing crossing_stop_check passes, and the same commands fed to long_simulate (RK4) stop within 0.002 m. Honestly: lateral motion is pinned to the centreline, the signal is “green after 2 s” without reading the lamp, there are no other vehicles or pedestrians, and the US/DE hold times reuse the JP values.* |
| *↑ The measurement ―― IDM(a_max 1.5、b_max 3.0、v_max 8)で停止線の手前に止まる。交差点は 2 秒。踏切は左右確認 4 秒の後、警報 20 s に始まった状態機械(降下 → 遮断 → 列車 → 上昇)が idle に戻る 65.5 s まで待って発進。下の帯 = 警報中の区間と列車が踏切に居る区間。 | a | の最大 1.88 m/s²。 (figure labels are in Japanese; the numbers are the same)* |
↑ 止まった位置は停止線の 0.54, 0.54 m 手前。
↑ GIF の 6 コマ(静止画)。
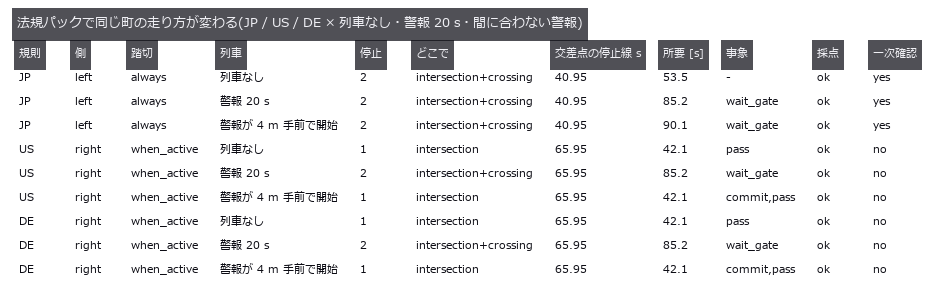
↑ JP = 左側通行・踏切は常に停止 + 左右確認(道路交通法 33 条 1 項、本文で確認)。
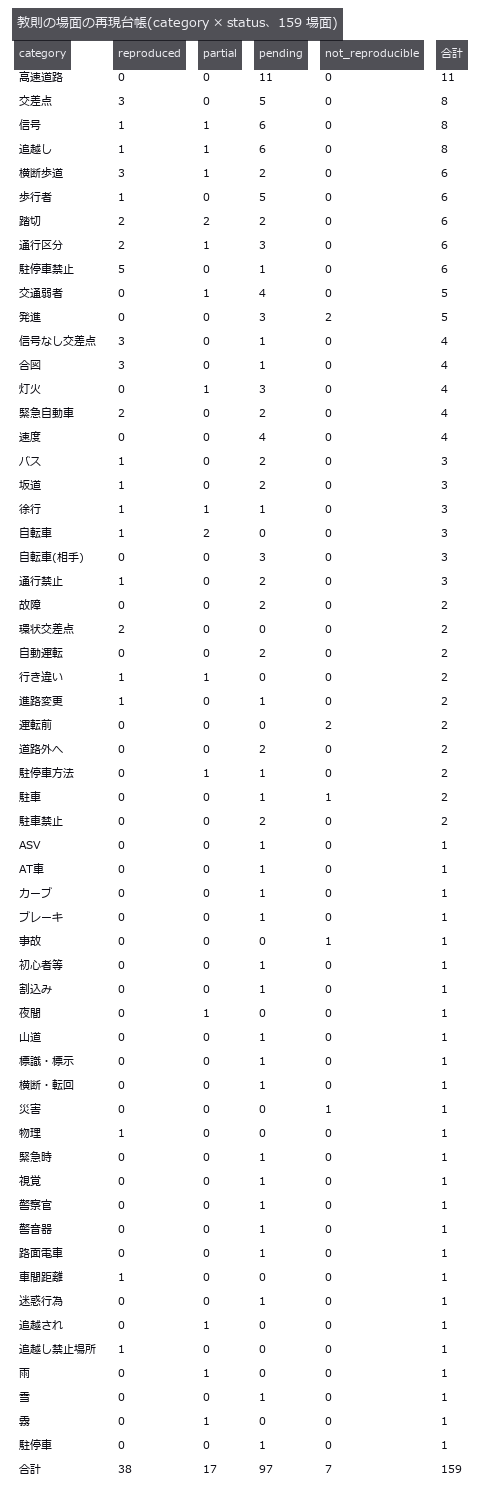
↑ docs/drive/kyosoku_scenarios.json の件数。
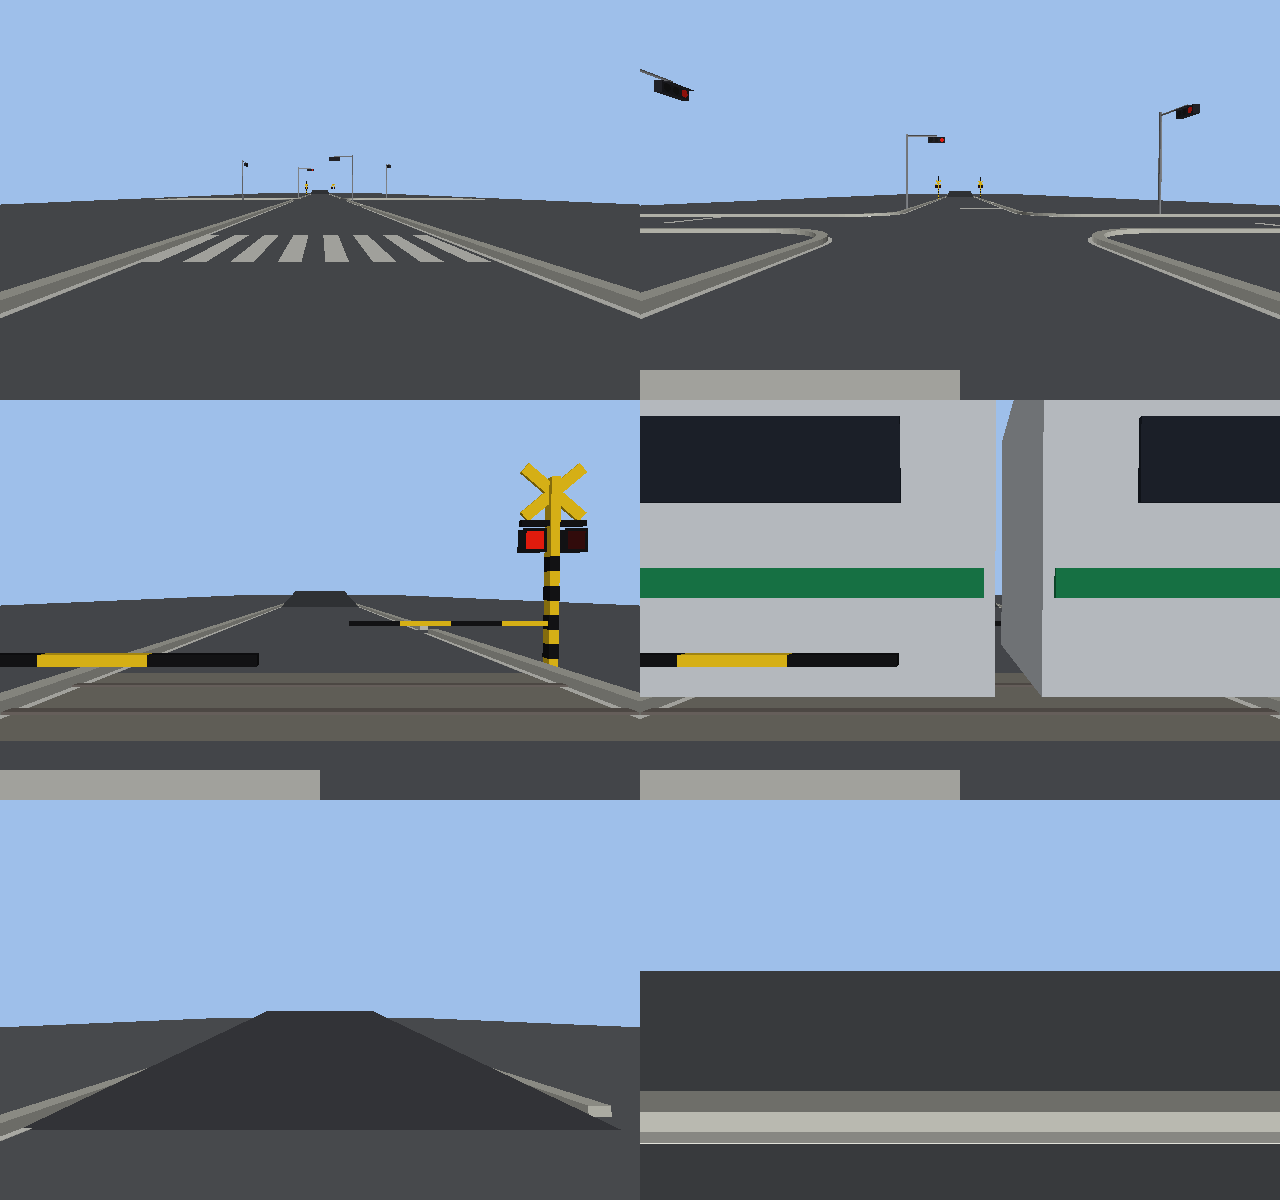
↑ The animation ―― 車載カメラ(640×400、13 コマ)で町を通し走行。赤信号で止まり、青で発進、踏切で止まって左右を見て、下りた遮断かんと点滅する警報灯の前で列車が過ぎて上がるまで待ってから渡り、坂を越えて縦列駐車の前を抜ける。
py -3.11 examples/poc_driving_town.py
Source: examples/poc_driving_town.py
This run produced 7 figures in total - see them all
Ops used (notes): course_crank · course_loop_bend · course_road · course_s_curve · crossing_stop_check · idm_accel · intersection · kyosoku_summary · long_params · long_simulate · town_centerline · town_chain · town_checks · town_crossing_state · town_layout · town_rules · town_run · town_stop_lines · town_world · world_camera
No.2026.192 —— Building a Real Japanese Town in Our Own World and Driving It — Roads from OpenStreetMap, Buildings from PLATEAU, Japanese Furniture and Rules
The author’s wish: “if possible, do it on a Japanese map”. The bundled maps of external photoreal simulators are European or American towns with right-hand traffic, and adding a Japanese town would need an editor build and Japanese assets, so we build Japan in our own world instead. The road network is an OpenStreetMap extract (equirectangular projection; widths from OSM tags or the Road Structure Ordinance lane widths as defaults). The road shape is the raster union of edges drawn as width-carrying segments, traced into boundary loops by Fullseye’s own contour tracer (contours_xld, whose area equals the pixel count exactly); the holes are city blocks, given pavements and kerbs. Buildings come from MLIT’s Project PLATEAU CityGML (LOD1 footprint and height → extruded prisms, driveplateau). The street furniture follows the regulation dimensions: the stop sign (330-A, 80 cm side), the stop line (45 cm), the road lettering 止まれ (Traffic Regulation Standard figure (1): 240 × 80 cm per character, 1 m apart, vertical), Japanese crosswalks with 45 cm stripes parallel to travel, crossbucks, utility poles and curve mirrors. The route is the shortest path (respecting one-way streets) shifted to the left-hand lane centre, with signals, stop signs and level crossings as stop lines, driven by drivetown’s through-run under the JP rule pack. Figures: Ginza 0.7 × 0.6 km from above, a bird’s-eye view with 852 PLATEAU buildings, an on-board drive-through (stop at red → go on green → stop sign), the same run’s frames, the furniture before a stop sign with its label image, the road-network table and the speed profile. 24 gates: 0.001° of latitude = 111.3195 m and agreement with a second implementation to 1e-9, straight-road union area = L w + π(w/2)² within 0.04 %, loop area = pixel count × step² within 1.5e-11 m², 4 holes in the 3 × 3 grid, shortest path 160 m with stop lines at 76.25 / 156.25 m in closed form, right-hand route mirrored, a 320 m detour around a reversed one-way street, two stops 0.54 m short of their lines with town_checks ok, the stop-sign plate 0.8 m on a side with its top at 2.5 m, the 止まれ column 9.2 m long, sign and lettering visible in the frame before the stop sign, and a 30 m synthetic CityGML prism. On real data: 586 OSM edges, 122 blocks, 852 buildings, area gate 5e-8 m², and a 461 m route to a signalled junction driven with 7 stops, ok. Honestly: 60 % of widths are class defaults where OSM has no tag; no lane assignment, signal phases, other vehicles or pedestrians; the 止まれ glyphs are polyline approximations (official dimensions); crossbuck plate sizes are assumed; slivers under 4 m² are not built; PLATEAU ground relief is ignored. Figure credits: roads © OpenStreetMap contributors (ODbL), buildings: MLIT Project PLATEAU. The data themselves are not committed.

↑ Building a Real Japanese Town in Our Own World and Driving It — Roads from OpenStreetMap, Buildings from PLATEAU, Japanese Furniture and Rules ―― The author’s wish: “if possible, do it on a Japanese map”. The bundled maps of external photoreal simulators are European or American towns with right-hand traffic, and adding a Japanese town would need an editor build and Japanese assets, so we build Japan in our own world instead. The road network is an OpenStreetMap extract (equirectangular projection; widths from OSM tags or the Road Structure Ordinance lane widths as defaults). The road shape is the raster union of edges drawn as width-carrying segments, traced into boundary loops by Fullseye’s own contour tracer (contours_xld, whose area equals the pixel count exactly); the holes are city blocks, given pavements and kerbs. Buildings come from MLIT’s Project PLATEAU CityGML (LOD1 footprint and height → extruded prisms, driveplateau). The street furniture follows the regulation dimensions: the stop sign (330-A, 80 cm side), the stop line (45 cm), the road lettering 止まれ (Traffic Regulation Standard figure (1): 240 × 80 cm per character, 1 m apart, vertical), Japanese crosswalks with 45 cm stripes parallel to travel, crossbucks, utility poles and curve mirrors. The route is the shortest path (respecting one-way streets) shifted to the left-hand lane centre, with signals, stop signs and level crossings as stop lines, driven by drivetown’s through-run under the JP rule pack. Figures: Ginza 0.7 × 0.6 km from above, a bird’s-eye view with 852 PLATEAU buildings, an on-board drive-through (stop at red → go on green → stop sign), the same run’s frames, the furniture before a stop sign with its label image, the road-network table and the speed profile. 24 gates: 0.001° of latitude = 111.3195 m and agreement with a second implementation to 1e-9, straight-road union area = L w + π(w/2)² within 0.04 %, loop area = pixel count × step² within 1.5e-11 m², 4 holes in the 3 × 3 grid, shortest path 160 m with stop lines at 76.25 / 156.25 m in closed form, right-hand route mirrored, a 320 m detour around a reversed one-way street, two stops 0.54 m short of their lines with town_checks ok, the stop-sign plate 0.8 m on a side with its top at 2.5 m, the 止まれ column 9.2 m long, sign and lettering visible in the frame before the stop sign, and a 30 m synthetic CityGML prism. On real data: 586 OSM edges, 122 blocks, 852 buildings, area gate 5e-8 m², and a 461 m route to a signalled junction driven with 7 stops, ok. Honestly: 60 % of widths are class defaults where OSM has no tag; no lane assignment, signal phases, other vehicles or pedestrians; the 止まれ glyphs are polyline approximations (official dimensions); crossbuck plate sizes are assumed; slivers under 4 m² are not built; PLATEAU ground relief is ignored. Figure credits: roads © OpenStreetMap contributors (ODbL), buildings: MLIT Project PLATEAU. The data themselves are not committed.

↑ The measurement ―― 銀座 0.7 × 0.6 km の俯瞰: OSM の道路網を幅つきでラスタ化した和集合の穴 = 街区(歩道 + 縁石)、信号・横断歩道・電柱。 道路: © OpenStreetMap contributors (ODbL) / 建物: 出典 国土交通省 Project PLATEAU (figure labels are in Japanese; the numbers are the same)

↑ PLATEAU(国交省 3D 都市モデル、LOD1 の足元と高さ)の建物 852 棟を押し出し柱で立てた銀座。
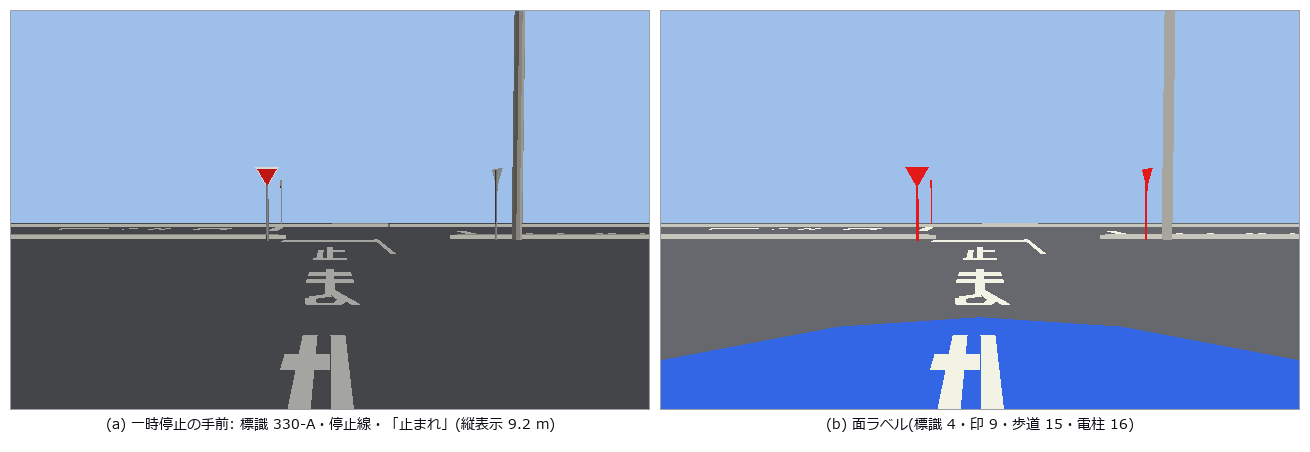
↑ 日本の道具立て(寸法は道路標識令 別表第二 / 交通規制基準 第 46 図例(1))。

↑ 幅の由来: {‘lanes’: 192, ‘default’: 375, ‘width’: 19}(width タグ / lanes × 車線幅 / 種別の既定)。
[](https://raw.githubusercontent.com/furuse-kazufumi/fullseye/master/docs/articles/assets/poc/poc_driving_japan_town/07_japan_speed.png)
↑ 停止線: [(3.3, ‘intersection’), (15.2, ‘intersection’), (133.1, ‘intersection’), (396.4, ‘intersection’), (419.3, ‘intersection’), (432.1, ‘intersection’…
↑ The animation ―― 左の車線中心を通して走る車載カメラ(JP 法規パック): 赤で停止 → 2 秒で青 → 発進、一時停止では止まって確認。道路: © OpenStreetMap contributors (ODbL) / 建物: 出典 国土交通省 Project PLATEAU
py -3.11 examples/poc_driving_japan_town.py
Source: examples/poc_driving_japan_town.py
This run produced 7 figures in total - see them all
Ops used (notes): citygml_synthetic · intersection · japan_stats · japan_world · jp_sign_stop_mesh · jp_stop_marking_mesh · latlon_to_local · osm_parse · osm_road_graph · osm_road_loops · osm_road_mask · osm_route · osm_synthetic · plateau_parse · town_checks · town_run · world_camera
No.2026.193 —— Driving Our Own Driver Through Someone Else’s Scenario and Submitting to Someone Else’s Judge — CommonRoad Public Scenarios and TUM’s Official Checker
| The user’s remark “setting your own traps and clearing them yourself has its limits” led to a new rule: bring at least one of the truth, the gate or the subject in from outside. Earlier driving PoCs planted their own ground truth in a synthetic world, wrote their own gates and scored their own driver. Here the scenario is a public CommonRoad (TUM) scenario (BSD-3), the judge is TUM’s drivability-checker (it does not install on Windows, so it runs in WSL and tools/check_solution_json.py writes the verdict as JSON), and only the driver is ours. The new module drivecommonroad (10 ops) reads 2020a XML itself (lanelet boundaries, dynamic obstacles, planning problem, sign 274 speed limits, stopLine), chains lanelets by successor, drives with IDM longitudinally and pure pursuit laterally under kinematic single-track (KS) dynamics (rear-axle reference, RK4, BMW_320i parameters copied from commonroad-vehicle-models’ parameters_vehicle2), stops at stop lines and writes the official solution XML (ksTrajectory). It also carries a second implementation of the judge (feasibility by re-integrating the recorded inputs to 2 cm / 0.03 rad, collision by separating axes, road boundary by point-in-polygon) to set beside the official JSON. Figures: a bird’s-eye view (lanelets, obstacle tracks, ego, goal lanelet), speed and acceleration, gaps to each obstacle, six frames (start, before the junction, turning left, closest to oncoming, entering the goal lanelet, stopped), a table of our verdicts against the official ones, and the sweep table. 22 gates: on the synthetic T-junction the reader (4 lanelets, 1 obstacle, 274 → 13.89 m/s), route 98.84 m = Σ centrelines (1e-6), KS straight line to 1e-9 and circle radius l_wb/tan δ (1e-6), goal reached with | a | ≤ 3 and v ≤ limit, stop 0.90 m short of the stop line, feasible (max_pos_err 0), no collision, a driver that ignores the car ahead collides at (step 52, obstacle 2), the blocked scene stops short, 201 ksStates = steps with positions = rear axle + b (1e-12). On the real ZAM_Tjunction-1_1_T-1 (12 lanelets, 5 obstacles, limit 14.0, route 347.6 m) the default IDM hits oncoming car 1; the 14th gap-acceptance setting (a_lat 8.0, lookahead 5.0) yields a 148-state run (v_max 9.82 m/s, 0.83 m lateral error) that the official checker accepts: valid, goal reached, feasible, no collision, n_states 148. The negative control (the gentle default driver) collides at (68, 1) in our check and the official checker also reports obstacle_collision true and valid false (feasible true), so our five verdicts agree with the official ones for both runs. Honestly: ZAM is not solvable by IDM alone and was solved by the sweep (no yielding behaviour; waiting would miss the goal time window); 8 m/s² lateral is uncomfortable though inside the checker’s friction circle (8.1 < 11.5); the public 2020a scenarios contain no traffic lights, stop lines or stop signs 206, so rule scoring is synthetic only; the official verdict is the WSL JSON (our feasibility re-integrates the recorded inputs with the same RK4, hence zero error); a longitudinal-only driver still collides in Speyer and Moabit. Source: CommonRoad scenarios (TUM, BSD-3). The data are not committed (FULLSEYE_COMMONROAD_DATA). |
| *↑ Driving Our Own Driver Through Someone Else’s Scenario and Submitting to Someone Else’s Judge — CommonRoad Public Scenarios and TUM’s Official Checker ―― The user’s remark “setting your own traps and clearing them yourself has its limits” led to a new rule: bring at least one of the truth, the gate or the subject in from outside. Earlier driving PoCs planted their own ground truth in a synthetic world, wrote their own gates and scored their own driver. Here the scenario is a public CommonRoad (TUM) scenario (BSD-3), the judge is TUM’s drivability-checker (it does not install on Windows, so it runs in WSL and tools/check_solution_json.py writes the verdict as JSON), and only the driver is ours. The new module drivecommonroad (10 ops) reads 2020a XML itself (lanelet boundaries, dynamic obstacles, planning problem, sign 274 speed limits, stopLine), chains lanelets by successor, drives with IDM longitudinally and pure pursuit laterally under kinematic single-track (KS) dynamics (rear-axle reference, RK4, BMW_320i parameters copied from commonroad-vehicle-models’ parameters_vehicle2), stops at stop lines and writes the official solution XML (ksTrajectory). It also carries a second implementation of the judge (feasibility by re-integrating the recorded inputs to 2 cm / 0.03 rad, collision by separating axes, road boundary by point-in-polygon) to set beside the official JSON. Figures: a bird’s-eye view (lanelets, obstacle tracks, ego, goal lanelet), speed and acceleration, gaps to each obstacle, six frames (start, before the junction, turning left, closest to oncoming, entering the goal lanelet, stopped), a table of our verdicts against the official ones, and the sweep table. 22 gates: on the synthetic T-junction the reader (4 lanelets, 1 obstacle, 274 → 13.89 m/s), route 98.84 m = Σ centrelines (1e-6), KS straight line to 1e-9 and circle radius l_wb/tan δ (1e-6), goal reached with | a | ≤ 3 and v ≤ limit, stop 0.90 m short of the stop line, feasible (max_pos_err 0), no collision, a driver that ignores the car ahead collides at (step 52, obstacle 2), the blocked scene stops short, 201 ksStates = steps with positions = rear axle + b (1e-12). On the real ZAM_Tjunction-1_1_T-1 (12 lanelets, 5 obstacles, limit 14.0, route 347.6 m) the default IDM hits oncoming car 1; the 14th gap-acceptance setting (a_lat 8.0, lookahead 5.0) yields a 148-state run (v_max 9.82 m/s, 0.83 m lateral error) that the official checker accepts: valid, goal reached, feasible, no collision, n_states 148. The negative control (the gentle default driver) collides at (68, 1) in our check and the official checker also reports obstacle_collision true and valid false (feasible true), so our five verdicts agree with the official ones for both runs. Honestly: ZAM is not solvable by IDM alone and was solved by the sweep (no yielding behaviour; waiting would miss the goal time window); 8 m/s² lateral is uncomfortable though inside the checker’s friction circle (8.1 < 11.5); the public 2020a scenarios contain no traffic lights, stop lines or stop signs 206, so rule scoring is synthetic only; the official verdict is the WSL JSON (our feasibility re-integrates the recorded inputs with the same RK4, hence zero error); a longitudinal-only driver still collides in Speyer and Moabit. Source: CommonRoad scenarios (TUM, BSD-3). The data are not committed (FULLSEYE_COMMONROAD_DATA).* |
| [](https://raw.githubusercontent.com/furuse-kazufumi/fullseye/master/docs/articles/assets/poc/poc_driving_commonroad/02_commonroad_speed.png) |
| *↑ The measurement ―― IDM の希望速度 v₀ = min(制限, 曲率の許容 √(a_lat/ | κ | ))。a は区分一定(RK4 の 1 step ごと)。 | a | ≤ max(a_max 1.5, b_max 3.0)。 (figure labels are in Japanese; the numbers are the same)* |
↑ 近似(中心間距離 − 両車の半長)。
↑ 俯瞰の 6 コマ(matplotlib で描いた PNG)。
↑ 公式 = commonroad-drivability-checker 2025.4.0。
↑ IDM だけでは対向車 obs 1 より先に左折できず、曲がりの許容横加速度と見通しを順に上げた。
py -3.11 examples/poc_driving_commonroad.py
Source: examples/poc_driving_commonroad.py
This run produced 6 figures in total - see them all
Ops used (notes): boundary · cr_checker_result · cr_collision · cr_drive · cr_drive_sweep · cr_feasible · cr_read · cr_route · cr_solution_xml · cr_synthetic · ks_step
No.2026.195 —— Peg-in-Hole with a Compliant Wrist — Whitney’s Quasi-Static Geometry as the Gate, a Wrist Camera to Centre the Peg, MuJoCo Contacts to Check It
| The first exhibit of the physics-simulation × Fullseye series (the physics side of the rule ‘home-made traps have a ceiling: bring in the truth, the gate or the subject from outside’). Two things come from outside. The theorem: Whitney 1982 (ASME J. Dyn. Sys. Meas. Control 104(1), DOI 10.1115/1.3149634; the paper itself is paywalled and was not read — the formulas are taken from the author’s own MIT OCW 2.875 Class 3 slides: two-point contact depth l/d = c/θ, θ_m = √(2c), wedging if θ > c/μ, the jamming parallelogram with λ = l/(2rμ)). The contact physics: MuJoCo (contact points, normal forces, mj_geomDistance). No learning — only the rule measure → correct → descend → slow down on force. Three things are our own: the two-point depth made exact for a 3-D cylinder, l tan θ = 2R − r(cos θ + sec θ) (derived; l sin θ ≈ 2c_r to fourth order), a second implementation that predicts the number of contact points from the true pose by geometry alone, and a measurement that reads the hole centre (anti-aliased edge lifted onto the plate plane, then a circle fit) and the peg tip (known-radius cylinder on the depth points, the tip from the silhouette end matched against the projected rim circle) in 3-D from one wrist RGB-D frame. New module pegsim, 18 ops (plus 9 facade functions that need mujoco). Figures: wrist-camera overlay (green = truth, red = estimate, yellow = edge points, 3× inset), insertion GIF with correction, GIF of the peg sliding down the chamfer without correction, three theoretical l₂ curves with the MuJoCo measurements, the jamming diagram at l = 2 / 8 mm, and the success table. 23 gates: Whitney’s quantities by hand (c = 0.0385, θ_m = 15.9°, chamfer tolerance 1.2 mm, c/μ = 7.35°), l₂ sin θ = 0.3977–0.3999 mm (2c_r = 0.400), the 2-D rectangle approximation is 0.52 mm off at 6° (counter-example), the second implementation switches from one to two points at l₂ ∓ 0.05 mm, PnP identity to 1e-9, the known-radius circle fit agrees with measure.fit_circle to 1e-9 on a full circle and has a median centre error of 0.15 px on a 25° arc (free fit 3.3 px), the synthetic RGB-D (analytic ray cast, no mujoco) gives the hole centre to 0.004 px and the offset to 0.0004 mm, and the image-plane ellipse centre is 0.80 px away from the projected circle centre (why we fit in 3-D). MuJoCo gates: the depth buffer under MSAA holds sample 0 at (−0.125, +0.375) px (pixel centre with offsamples=0); over 8 poses ( | ε | ≤ 3 mm, | θ | ≤ 3°) the hole centre is within 0.18 px (free circle) / 0.045 px (drawing radius R + W), the offset within 0.024 / 0.010 mm, the tip’s lateral error 0.003 px; l₂ measured by bisection on mj_geomDistance matches the closed form to 0.017–0.070 mm (1.5–6°) with l₂ sin θ = 0.396–0.398 mm; the contact state switches one-point / two-point at l₂ ∓ 0.3 mm; the insertion with ε = (2, 1) mm and θ = 2° succeeds and the first two-point tick has l sin θ = 0.400 mm; 7 servo iterations take the true offset from 2.24 to 0.03 mm; without correction ε₀ = 1 mm is pushed in by the chamfer; the grid ε₀ {0, 1, 2, 3} mm × θ₀ {0, 1.5, 3}° succeeds up to 1 mm without correction (2 mm and more stop at the mouth — the chamfer tolerance is 1.2 mm) and 12 / 12 with it. Honestly: the tip’s axial position comes from the coverage of one silhouette pixel and is off by up to 0.50 px (the 0.3 px target is not met); the raw agreement between predicted and simulated contact counts is 0.69 (0.96 within ±1 — soft contacts flicker between 0/1 and 1/2 points); the wrist is a rigid body on springs with no actuator lag, flex or calibration error; wedging cannot occur at θ ≤ 3° with μ = 0.3 and was not provoked; the original paper was not read. Traps: MuJoCo’s 4× MSAA depth is the depth at sample 0, not at the pixel centre (measured on a tilted plane; depth is rendered from a second compile with offsamples=0), the default 28 slices of a cylinder pull the radius 0.04 mm inwards (numslices=128), and the first 2-D rectangle approximation D = d/cos θ + l tan θ is 0.5 mm wrong at θ = 6°. Without mujoco the MuJoCo gates are skipped and the 12 numpy gates decide. 37 s. |
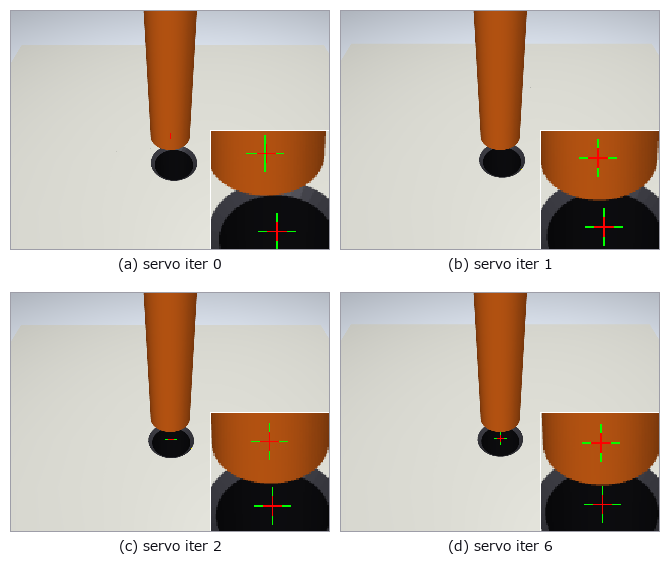
| *↑ Peg-in-Hole with a Compliant Wrist — Whitney’s Quasi-Static Geometry as the Gate, a Wrist Camera to Centre the Peg, MuJoCo Contacts to Check It ―― The first exhibit of the physics-simulation × Fullseye series (the physics side of the rule ‘home-made traps have a ceiling: bring in the truth, the gate or the subject from outside’). Two things come from outside. The theorem: Whitney 1982 (ASME J. Dyn. Sys. Meas. Control 104(1), DOI 10.1115/1.3149634; the paper itself is paywalled and was not read — the formulas are taken from the author’s own MIT OCW 2.875 Class 3 slides: two-point contact depth l/d = c/θ, θ_m = √(2c), wedging if θ > c/μ, the jamming parallelogram with λ = l/(2rμ)). The contact physics: MuJoCo (contact points, normal forces, mj_geomDistance). No learning — only the rule measure → correct → descend → slow down on force. Three things are our own: the two-point depth made exact for a 3-D cylinder, l tan θ = 2R − r(cos θ + sec θ) (derived; l sin θ ≈ 2c_r to fourth order), a second implementation that predicts the number of contact points from the true pose by geometry alone, and a measurement that reads the hole centre (anti-aliased edge lifted onto the plate plane, then a circle fit) and the peg tip (known-radius cylinder on the depth points, the tip from the silhouette end matched against the projected rim circle) in 3-D from one wrist RGB-D frame. New module pegsim, 18 ops (plus 9 facade functions that need mujoco). Figures: wrist-camera overlay (green = truth, red = estimate, yellow = edge points, 3× inset), insertion GIF with correction, GIF of the peg sliding down the chamfer without correction, three theoretical l₂ curves with the MuJoCo measurements, the jamming diagram at l = 2 / 8 mm, and the success table. 23 gates: Whitney’s quantities by hand (c = 0.0385, θ_m = 15.9°, chamfer tolerance 1.2 mm, c/μ = 7.35°), l₂ sin θ = 0.3977–0.3999 mm (2c_r = 0.400), the 2-D rectangle approximation is 0.52 mm off at 6° (counter-example), the second implementation switches from one to two points at l₂ ∓ 0.05 mm, PnP identity to 1e-9, the known-radius circle fit agrees with measure.fit_circle to 1e-9 on a full circle and has a median centre error of 0.15 px on a 25° arc (free fit 3.3 px), the synthetic RGB-D (analytic ray cast, no mujoco) gives the hole centre to 0.004 px and the offset to 0.0004 mm, and the image-plane ellipse centre is 0.80 px away from the projected circle centre (why we fit in 3-D). MuJoCo gates: the depth buffer under MSAA holds sample 0 at (−0.125, +0.375) px (pixel centre with offsamples=0); over 8 poses ( | ε | ≤ 3 mm, | θ | ≤ 3°) the hole centre is within 0.18 px (free circle) / 0.045 px (drawing radius R + W), the offset within 0.024 / 0.010 mm, the tip’s lateral error 0.003 px; l₂ measured by bisection on mj_geomDistance matches the closed form to 0.017–0.070 mm (1.5–6°) with l₂ sin θ = 0.396–0.398 mm; the contact state switches one-point / two-point at l₂ ∓ 0.3 mm; the insertion with ε = (2, 1) mm and θ = 2° succeeds and the first two-point tick has l sin θ = 0.400 mm; 7 servo iterations take the true offset from 2.24 to 0.03 mm; without correction ε₀ = 1 mm is pushed in by the chamfer; the grid ε₀ {0, 1, 2, 3} mm × θ₀ {0, 1.5, 3}° succeeds up to 1 mm without correction (2 mm and more stop at the mouth — the chamfer tolerance is 1.2 mm) and 12 / 12 with it. Honestly: the tip’s axial position comes from the coverage of one silhouette pixel and is off by up to 0.50 px (the 0.3 px target is not met); the raw agreement between predicted and simulated contact counts is 0.69 (0.96 within ±1 — soft contacts flicker between 0/1 and 1/2 points); the wrist is a rigid body on springs with no actuator lag, flex or calibration error; wedging cannot occur at θ ≤ 3° with μ = 0.3 and was not provoked; the original paper was not read. Traps: MuJoCo’s 4× MSAA depth is the depth at sample 0, not at the pixel centre (measured on a tilted plane; depth is rendered from a second compile with offsamples=0), the default 28 slices of a cylinder pull the radius 0.04 mm inwards (numslices=128), and the first 2-D rectangle approximation D = d/cos θ + l tan θ is 0.5 mm wrong at θ = 6°. Without mujoco the MuJoCo gates are skipped and the 12 numpy gates decide. 37 s.* |

↑ The measurement ―― 傾き θ で二点接触が始まる深さ l₂(最狭部から)。3-D の円柱で厳密にした (1′) と小角の式 l₂ sin θ = 2c_r は重なり、2-D の長方形近似は θ = 6° で 0.5 mm 浅い。点は MuJoCo の mj_geomDistance の二分法で測った値(閉形式と 0.07 mm 以内)。1° では 22.9 mm と穴の深さ 20 mm を超え、二点接触は起きない。 (figure labels are in Japanese; the numbers are the same)
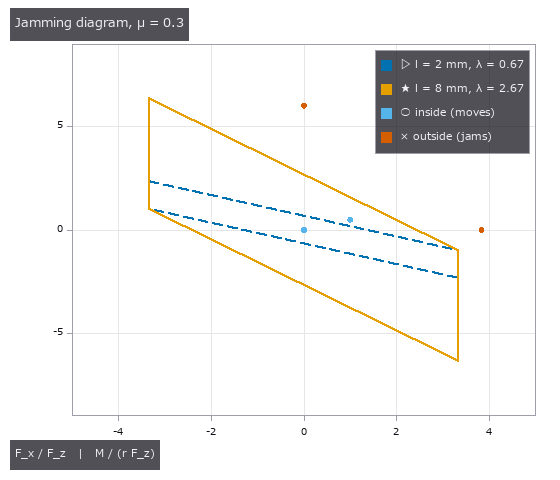
↑ Whitney のかじりの図(OCW p.34): 二点接触中にペグが進むのは加える力の比がこの平行四辺形の内側にあるとき。
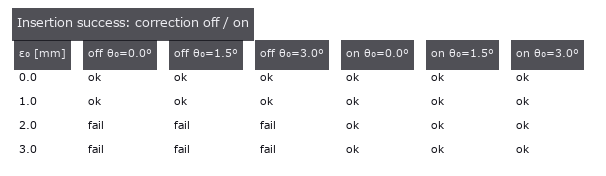
↑ 初期横ずれ ε₀ × 傾き θ₀ の成功 / 失敗(各 1 走行、ずれの向きは 30°)。
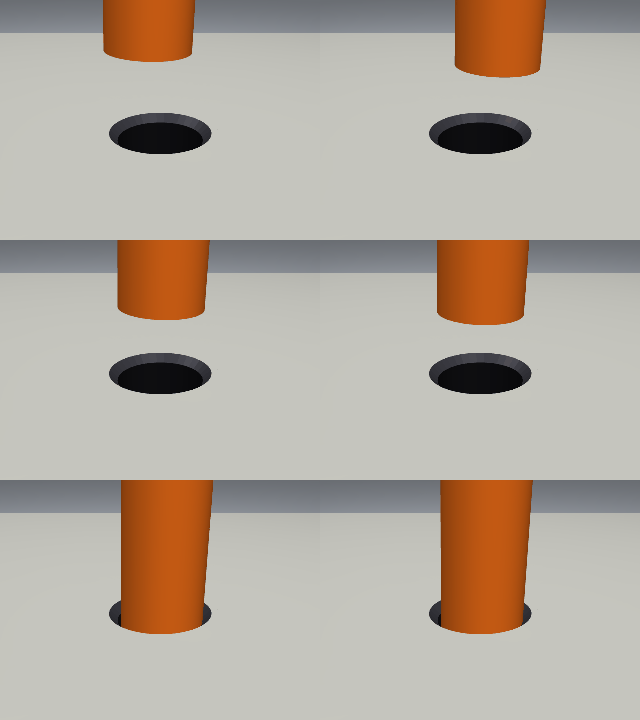
↑ The animation ―― 補正ありの挿入(ε₀ = (2, 1) mm、θ₀ = 2°、側面カメラ、0.15 s ごと): サーボで穴の上に寄せ、下げ、一点 → 二点接触を経て 15 mm。
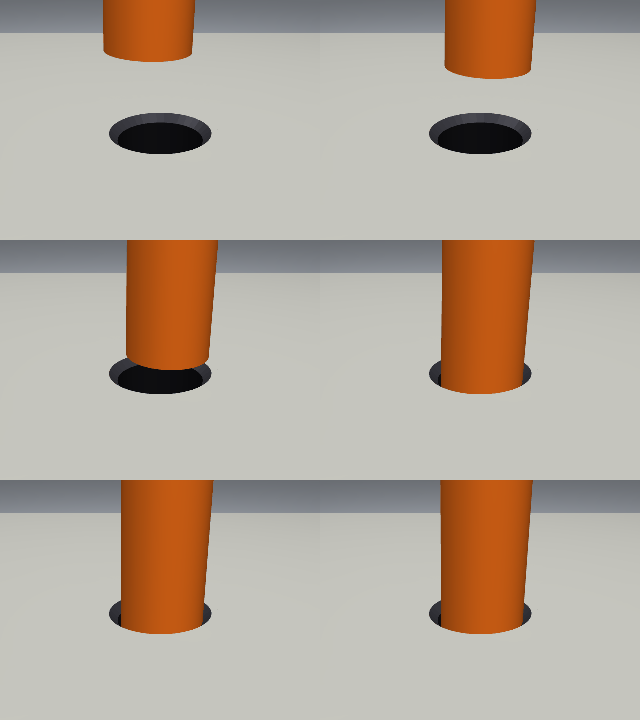
↑ The animation ―― 補正なし(ε₀ = 1 mm < 面取りの許容 1.2 mm、θ₀ = 2°): 面取りが柔らかい手首を横へ押し、ペグが滑り込む。2 mm では入口で止まる。
py -3.11 examples/poc_pegsim_insertion.py
Source: examples/poc_pegsim_insertion.py
This run produced 6 figures in total - see them all
Ops used (notes): camera_world_to_cv · chamfer_capture · circle_fit_known_radius · contact_state_predict · jamming_diagram · peg_measure_overlay · peg_offset_from_rgbd · peg_params · peg_scene_mjcf · peg_synthetic_rgbd · project_points · two_point_depth · wedging_check · whitney_clearance
No.2026.200 —— Tracking, Predicting and Returning an Air-Hockey Puck with a Five-Bar Linkage — No Learning, Closed Forms and an External Simulator as the Gates
| The third exhibit of the physics-simulation × Fullseye series (the first was peg-in-hole, the second the three visuotactile exhibits). The subject is a low-cost air-hockey robot (Shinjo, Beltran-Hernandez, Hamaya, Tanaka, IROS 2024, doi 10.1109/iros58592.2024.10801458): a five-bar linkage driven by position-control servos, with the chain camera → puck detection → velocity estimation → trajectory prediction → motion planning. The chain is rebuilt with existing Fullseye parts (balltrack.ball_detect / ball_track / kalman_ca, ballistics.slide_stop_distance, calib.image_to_world_plane) and the new module puck (26 ops), learning-free and rule-based throughout, with ground truth brought in from outside on three fronts. (1) Closed forms: sliding on the air cushion is Coulomb’s uniform deceleration a = μg (stopping distance v₀²/(2μg)); a wall flips the normal component by −e and keeps kₜ of the tangential one (two coefficients of restitution; the notation follows Cross 2022, Eur. J. Phys., doi 10.1088/1361-6404/ac4b47, oblique impact of a disc; the Spong 2001 impact model could not be read and is unverified); between walls the path is stitched from per-segment closed forms (a quadratic or a logarithm) — against the mirror method as a second implementation (no friction, e = kₜ = 1) it agrees to 3e-15 m over 200 launches with up to 17 reflections, and to 1.5e-5 m against semi-implicit Euler at dt = 1e-5. (2) Five-bar kinematics: the closed form of two two-link arms meeting at the striker (circle–circle intersections); FK∘IK returns to 2e-15 m on 400 workspace points and the reach circle l₁ + l₂ separates inside from outside at ±1e-6 m. (3) An external simulator: the table MJCF of the Robot Air Hockey Challenge (Liu et al., arXiv 2411.05718, MIT; the file is not bundled, it lives under the environment variable FULLSEYE_AIRHOCKEY_DATA and is used only with –full). ★The second implementation exposed a model difference: this table excludes the puck–surface contact and slows the puck through joint viscous damping c = 0.005 N·s/m (m = 0.01 kg → c/m = 0.5 /s, a 2 s time constant). It is not Coulomb deceleration (measured log-speed slope −0.4999 /s). The rims are soft contacts, so e and kₜ are not parameters but measured outcomes (e_n = 0.739, kₜ = 0.852). Adding model=”viscous” to the predictor matches MuJoCo to 0.110 mm before the first wall and, with the measured e and kₜ, to 0.4 mm 0.4 s after one bounce. Our own Coulomb MJCF (a cylinder on a frictional plane) decelerates 3.3 % away from μg (whether MuJoCo’s soft-contact friction or our MJCF settings is not resolved). The synthetic top-down camera draws the puck with coverage anti-aliasing and adds motion during the exposure as the mean of sub-exposures: the blurred centroid advances by v·τ/2 (closed form, matched to 0.004 px — it vanishes if the frame is stamped at mid-exposure). Detection is a facade over ball_detect with the threshold just below the table value, 0.85 — the weight is (threshold − pixel), so at 0.5 the edge pixels are cut and a phase-dependent bias of 0.08 px appears (measured; 0.005 px at 0.85). Velocity is a least-squares fit of the uniform-deceleration model with the direction û fixed (û iterated three times; the viscous case is linear in the basis (1 − e^{−kτ})/k) and σ_v comes from σ²(AᵀA)⁻¹. The striker plan is a rule: IK to the crossing point, each servo at a constant rate ≤ 6 rad/s, too_late if it cannot arrive first, unreachable outside the workspace, no_crossing if the path never crosses (fail-closed). Figures: a 343 px/m frame with the 16 detections, the predicted path and the crossing point (0.0 mm from the truth, 756 ms ahead) next to a 1:1 crop of the puck (nearest neighbour ×8) with the sub-pixel centroid (0.004 px from the truth); a GIF where the 95 % band of the crossing narrows as frames accumulate on a coarse camera (100 px/m, noise σ 0.06); velocity error vs N inside 3σ; a GIF of the five-bar linkage arriving first (move 256 ms, crossing 883 ms); where it breaks (blur, an unknown wall kₜ fans the prediction after a bounce, 45 px per frame breaks ball_track’s association); MuJoCo vs the viscous closed form vs Coulomb (three curves with –full). 16 gates (numpy only, 1.6 s, 7 s with figures) plus 6 with –full (MuJoCo, 13 s): stopping distance = ballistics (0), wall energy ratio e², mirror method 3e-15 m, self-consistency + Euler 1.5e-5 m, FK∘IK 2e-15 m, the reach boundary and the reachable interval | y | ≤ 0.369 on the defence line x = −0.75 (the puck can be at | y | ≤ 0.487, so the corners are out of reach — stated honestly), detection centroids over 50 positions max 0.0059 px / rms 0.0024 px (0.012 mm), velocity from exact positions 7e-16 and from detections at N = 12 0.01 % (σ_v 0.2 mm/s), crossing points from noisy detections over 20 launches rms 0.2 mm / max 0.5 mm (threshold 3σ_mc + a 2 mm floor because the 60-sample Monte-Carlo σ itself wobbles by ±10 %), the plan E = (−0.750, 0.350) with a 0.256 s move, 8 m/s → too_late, y = 0.47 → unreachable, blur 0.004 px, six spelling-breaks plus None without a crossing, μ to 0.7 % (the 0.3 s bend is 0.8 px), e 0.7999 and kₜ 0.9001, fast puck 10/10 at 20 and 35 px per frame but 1/10 at 45 and 80 (max_jump 40 px, 27 m/s at 120 fps), kalman_ca innovation 2.7e-13 m; –full: viscous slope −0.4999 /s, closed form 0.110 mm, 0.4 mm after the bounce, Coulomb MJCF 3.3 %, render → colour detection → pinhole bias (−2.6, 2.3) mm and scatter 0.35 mm (0.12 px; the bias comes from the site height and render quantisation and is subtracted in the chain), the full chain over 20 launches: 14 crossed the defence line, all 12 within reach were intercepted, 2 in the corners were declined, crossing error median 1.2 mm / max 14.9 mm (inside the 71.65 mm puck + mallet radius), timing max 21 ms. Honestly: the linkage dimensions (d 0.30, l₁ 0.25, l₂ 0.35 m), the 6 rad/s servo rate, the 40 mm mallet, the defence line x = −0.75 and the closed-form defaults μ 0.02 / e 0.8 / kₜ 0.9 are all assumptions (the paper’s hardware numbers could not be read); no real footage is used (synthetic + MuJoCo, no lighting, lens distortion or rolling shutter; the synthetic detection error of 0.006 px is more than an order of magnitude better than reality); the slip/grip regimes and spin of a wall impact are not implemented; e and kₜ are estimated by splitting the track at the frame where the heading changes most (a single bounce only). |

| *↑ Tracking, Predicting and Returning an Air-Hockey Puck with a Five-Bar Linkage — No Learning, Closed Forms and an External Simulator as the Gates ―― The third exhibit of the physics-simulation × Fullseye series (the first was peg-in-hole, the second the three visuotactile exhibits). The subject is a low-cost air-hockey robot (Shinjo, Beltran-Hernandez, Hamaya, Tanaka, IROS 2024, doi 10.1109/iros58592.2024.10801458): a five-bar linkage driven by position-control servos, with the chain camera → puck detection → velocity estimation → trajectory prediction → motion planning. The chain is rebuilt with existing Fullseye parts (balltrack.ball_detect / ball_track / kalman_ca, ballistics.slide_stop_distance, calib.image_to_world_plane) and the new module puck (26 ops), learning-free and rule-based throughout, with ground truth brought in from outside on three fronts. (1) Closed forms: sliding on the air cushion is Coulomb’s uniform deceleration a = μg (stopping distance v₀²/(2μg)); a wall flips the normal component by −e and keeps kₜ of the tangential one (two coefficients of restitution; the notation follows Cross 2022, Eur. J. Phys., doi 10.1088/1361-6404/ac4b47, oblique impact of a disc; the Spong 2001 impact model could not be read and is unverified); between walls the path is stitched from per-segment closed forms (a quadratic or a logarithm) — against the mirror method as a second implementation (no friction, e = kₜ = 1) it agrees to 3e-15 m over 200 launches with up to 17 reflections, and to 1.5e-5 m against semi-implicit Euler at dt = 1e-5. (2) Five-bar kinematics: the closed form of two two-link arms meeting at the striker (circle–circle intersections); FK∘IK returns to 2e-15 m on 400 workspace points and the reach circle l₁ + l₂ separates inside from outside at ±1e-6 m. (3) An external simulator: the table MJCF of the Robot Air Hockey Challenge (Liu et al., arXiv 2411.05718, MIT; the file is not bundled, it lives under the environment variable FULLSEYE_AIRHOCKEY_DATA and is used only with –full). ★The second implementation exposed a model difference: this table excludes the puck–surface contact and slows the puck through joint viscous damping c = 0.005 N·s/m (m = 0.01 kg → c/m = 0.5 /s, a 2 s time constant). It is not Coulomb deceleration (measured log-speed slope −0.4999 /s). The rims are soft contacts, so e and kₜ are not parameters but measured outcomes (e_n = 0.739, kₜ = 0.852). Adding model=”viscous” to the predictor matches MuJoCo to 0.110 mm before the first wall and, with the measured e and kₜ, to 0.4 mm 0.4 s after one bounce. Our own Coulomb MJCF (a cylinder on a frictional plane) decelerates 3.3 % away from μg (whether MuJoCo’s soft-contact friction or our MJCF settings is not resolved). The synthetic top-down camera draws the puck with coverage anti-aliasing and adds motion during the exposure as the mean of sub-exposures: the blurred centroid advances by v·τ/2 (closed form, matched to 0.004 px — it vanishes if the frame is stamped at mid-exposure). Detection is a facade over ball_detect with the threshold just below the table value, 0.85 — the weight is (threshold − pixel), so at 0.5 the edge pixels are cut and a phase-dependent bias of 0.08 px appears (measured; 0.005 px at 0.85). Velocity is a least-squares fit of the uniform-deceleration model with the direction û fixed (û iterated three times; the viscous case is linear in the basis (1 − e^{−kτ})/k) and σ_v comes from σ²(AᵀA)⁻¹. The striker plan is a rule: IK to the crossing point, each servo at a constant rate ≤ 6 rad/s, too_late if it cannot arrive first, unreachable outside the workspace, no_crossing if the path never crosses (fail-closed). Figures: a 343 px/m frame with the 16 detections, the predicted path and the crossing point (0.0 mm from the truth, 756 ms ahead) next to a 1:1 crop of the puck (nearest neighbour ×8) with the sub-pixel centroid (0.004 px from the truth); a GIF where the 95 % band of the crossing narrows as frames accumulate on a coarse camera (100 px/m, noise σ 0.06); velocity error vs N inside 3σ; a GIF of the five-bar linkage arriving first (move 256 ms, crossing 883 ms); where it breaks (blur, an unknown wall kₜ fans the prediction after a bounce, 45 px per frame breaks ball_track’s association); MuJoCo vs the viscous closed form vs Coulomb (three curves with –full). 16 gates (numpy only, 1.6 s, 7 s with figures) plus 6 with –full (MuJoCo, 13 s): stopping distance = ballistics (0), wall energy ratio e², mirror method 3e-15 m, self-consistency + Euler 1.5e-5 m, FK∘IK 2e-15 m, the reach boundary and the reachable interval | y | ≤ 0.369 on the defence line x = −0.75 (the puck can be at | y | ≤ 0.487, so the corners are out of reach — stated honestly), detection centroids over 50 positions max 0.0059 px / rms 0.0024 px (0.012 mm), velocity from exact positions 7e-16 and from detections at N = 12 0.01 % (σ_v 0.2 mm/s), crossing points from noisy detections over 20 launches rms 0.2 mm / max 0.5 mm (threshold 3σ_mc + a 2 mm floor because the 60-sample Monte-Carlo σ itself wobbles by ±10 %), the plan E = (−0.750, 0.350) with a 0.256 s move, 8 m/s → too_late, y = 0.47 → unreachable, blur 0.004 px, six spelling-breaks plus None without a crossing, μ to 0.7 % (the 0.3 s bend is 0.8 px), e 0.7999 and kₜ 0.9001, fast puck 10/10 at 20 and 35 px per frame but 1/10 at 45 and 80 (max_jump 40 px, 27 m/s at 120 fps), kalman_ca innovation 2.7e-13 m; –full: viscous slope −0.4999 /s, closed form 0.110 mm, 0.4 mm after the bounce, Coulomb MJCF 3.3 %, render → colour detection → pinhole bias (−2.6, 2.3) mm and scatter 0.35 mm (0.12 px; the bias comes from the site height and render quantisation and is subtracted in the chain), the full chain over 20 launches: 14 crossed the defence line, all 12 within reach were intercepted, 2 in the corners were declined, crossing error median 1.2 mm / max 14.9 mm (inside the 71.65 mm puck + mallet radius), timing max 21 ms. Honestly: the linkage dimensions (d 0.30, l₁ 0.25, l₂ 0.35 m), the 6 rad/s servo rate, the 40 mm mallet, the defence line x = −0.75 and the closed-form defaults μ 0.02 / e 0.8 / kₜ 0.9 are all assumptions (the paper’s hardware numbers could not be read); no real footage is used (synthetic + MuJoCo, no lighting, lens distortion or rolling shutter; the synthetic detection error of 0.006 px is more than an order of magnitude better than reality); the slip/grip regimes and spin of a wall impact are not implemented; e and kₜ are estimated by splitting the track at the frame where the heading changes most (a single bounce only).* |
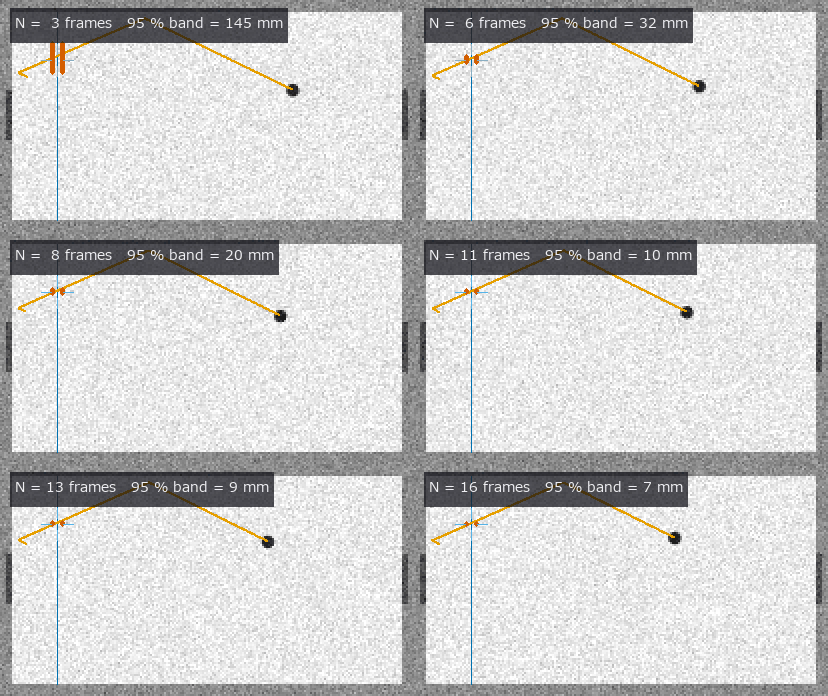
↑ The measurement ―― 粗いカメラ(100 px/m、雑音 σ 0.06)でも、コマが増えるほど守備線上の交点の 95 % 帯(赤)が細る: N = 3 で 145 mm → N = 16 で 7 mm。緑の十字 = 真の交点。 (figure labels are in Japanese; the numbers are the same)

↑ 検出から最小二乗で出した速度の誤差は N とともに縮み、最小二乗の分散の 3σ(破線)の内側に収まる(N = 12 で 0.01 %、N = 24 で 0.01 %)。

↑ どこで壊れるか。

↑ Challenge の台では速さが指数で落ちる(粘性減衰 c/m = 0.5 /s、実測の傾き -0.4999 /s)。
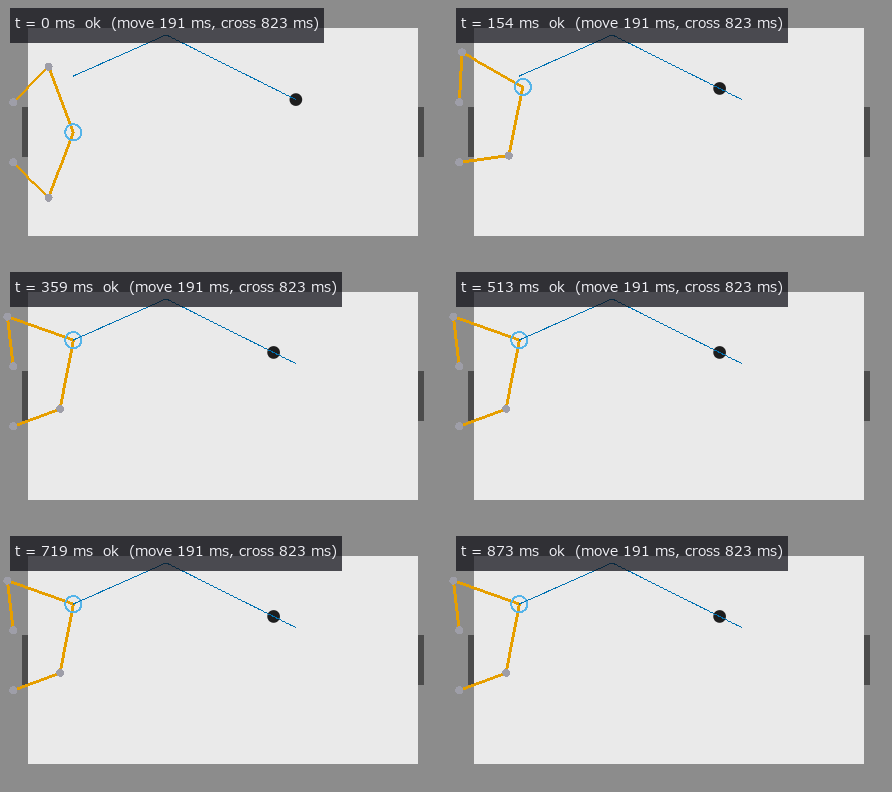
↑ The animation ―― 8 コマで予測した交点へ、5 節リンク(一定角速度 ≤ 6 rad/s、寸法は仮定)が 191 ms で先回りして打具(緑の円、半径 40 mm は仮定)を置く。交点の到着は 823 ms 先。
py -3.11 examples/poc_air_hockey_intercept.py
Source: examples/poc_air_hockey_intercept.py
This run produced 6 figures in total - see them all
Ops used (notes): crosshair · fivebar_fk · fivebar_ik · fivebar_link · fivebar_reach_interval · fivebar_trajectory · fivebar_workspace · kalman_ca · puck_camera · puck_crossing_point · puck_detect · puck_mirror_path · puck_mu_from_decel · puck_pinhole_camera · puck_render_frame · puck_restitution_from_wall · puck_scene_mjcf · puck_slide_predict · puck_state_at · puck_stop_distance · puck_synth_frames · puck_table · puck_track · puck_velocity_estimate … (+5)
No.2026.201 —— Detecting and Recovering Peg-Insertion Failures with a Rule Table — Whitney’s Contact States Instead of a VLM, MuJoCo as the Truth
| The capstone of the peg-in-hole thread of the physics-simulation × Fullseye series (pegsim, soft-wrist insertion, 2026.195). The prior work (Shirasaka, Beltran-Hernandez, Hamaya, Ushiku, arXiv:2509.17666, ICRA 2026, code unpublished) structures soft-wrist insertion as contact formation — a sequence of contact states that constrain the degrees of freedom one by one — and lets a VLM judge the failure mode from the final pose and an image before picking a recovery skill. Here the VLM is replaced by a rule table: the observation (contact kind none / plate / chamfer / one_point / two_point / floor, depth band above / mouth / hole / bottom, stall, whether the tilt at the onset of two-point contact is above c/μ, whether the force ratio lies inside the jamming parallelogram, whether the tip offset from the hole centre is within W + c_r) is discretised into a six-field signature and looked up in a 12-row table. At most one row matches (a validator first checks pairwise exclusivity and that all 8 classes are reachable); if none does the answer is unknown (the table decides 362 of the 576 signatures in the vocabulary and never guesses the rest: fail-closed). Ground truth comes from outside on two fronts. (1) The theorem: Whitney 1982 (the original is paywalled and unread; the equations are from the author’s own MIT OCW 2.875 Class 3 slides): wedging θ > c/μ (p.28), the jamming parallelogram λ = l/(2rμ) (p.34). The four vertices are re-derived from the planar statics of two-point contact (both points sliding down with Coulomb friction: F_x = f₂ − f₁, F_z = μ(f₁ + f₂), M = μrf₁ − (μr + l)f₂) and agree with pegsim’s vertices (the OCW values) to 2.2e-16 — this derivation fixes the sign convention of the force ratios (e_x from the wall the tip touches towards the opposite mouth edge, F_z positive when pushing, M = M⃗·(e_x × ẑ)). (2) The physics engine: MuJoCo’s contact points, normal forces and the wrist force sensor (–full). The tip load (F⃗, M⃗_tip) is read from the deflection of the wrist springs (a rule that needs no external F/T sensor): over the 3,458 quasi-static ticks spent stalled, the estimated load plus gravity balances the sum of the contact forces to 0.35 N, and agrees with the wrist force sensor (site frame → world) to 0.026 N. Failures are injected on purpose: an offset of 2.5 mm the chamfer cannot catch (> W + c_r = 1.2 mm), wedging with μ 0.8 and θ₀ 4.5° (> c/μ = 2.76°), jamming with θ₀ 3° and a +3 mm lateral target shift towards the tilt once the tip is 4 mm in, a plug at 6 mm depth, a decoy hole 26 mm away. The chain is descend (slow at 2.5 N, 12 N cap) → stall (advance < 0.05 mm over a 30-tick window, armed after 0.5 mm of progress) → signature → table → recovery primitive (lift 6 mm and re-centre with the wrist RGB-D / lift 10 mm and return to the fixture target / retract 4 mm and undo the measured tilt / pick the 0.5 mm carriage × 0.5° wrist step that maximises the parallelogram margin in a linear model / lift and abort). Figures: the flip probability of the offset field when σ = 0.05 mm noise is added at the W + c_r = 1.2 mm boundary (0.508 at the boundary, 0.168 / 0.157 at ±1σ, within 0.03 of Φ(−1); dashed = theory), the confusion matrix of the 6 injected classes (6 / 6 from truth signatures, 6 / 6 from the vision signatures), the jamming diagram with the trajectory of force ratios estimated from the wrist load (the tick where the jam stall is detected lies outside its own-depth parallelogram at l = 5.3 mm with margin −0.50, the 321 ticks of nominal two-point sliding lie inside with min 0.18 / median 0.20 — the diagram widens with depth, so two parallelograms are drawn), depth vs tick for the wedge (stall → wedging in the same tick → retract + tilt reset → re-descend and succeed), a 48-frame wrist-camera GIF (‘detected: wedging -> retract_reduce_tilt’ appears, then the re-descent), and the release-probe table. ★The release probe shows Whitney’s distinction physically: the wedge (μ 0.8, θ 4.7°) stays at 5.90 mm when the push is removed (F_z 2.03 → 0.64 N) and even when pulled by 2 mm (F_z −0.39 N) — compression is stored inside; the jam (μ 0.3, θ 4.4°, F_x 1.3 N) advances under its own weight from 6.25 to 7.21 mm once the lateral force is also removed and comes back to 5.30 mm when pulled — a matter of force direction. 12 gates (numpy only, 0.6 s) plus 8 with –full (MuJoCo, 14 s, 35 s with figures): table completeness and exclusivity, parallelogram vertices 2.2e-16, the wedging boundary at c/μ ∓ 1e-9 rad (7.353° at μ 0.3, 2.755° at 0.8), stall detection (no false alarm on three monotone descents plus a hover, onset 27 ticks after the true stop, armed at tick 17), all 362 row signatures classify to their row, three unknown signatures and four spelling breaks, the closed-form wrist load to 1e-12, flip probability = Φ(− | z | ), synthetic RGB-D (analytic ray cast, no mujoco) offsets at four poses to 0.002 mm → field → class = truth, discretisation boundaries, the summary latency of 30 ticks and the confusion matrix, the MJCF (two force/torque sensors, the plug, 109 decoy geoms plus a 4-box frame, ValueError for a plug outside the hole or an overlapping decoy); –full: force closure, the injection grid 6 classes × {no recovery, recovery} with 6 / 6 from truth and from vision signatures and 0/5 → 5/5 (the blocked hole is correctly aborted = success), detection latencies of 32–33 ticks (= 30-tick window + ≤ 10 confirmation), 9 for the plug and 18 for the decoy, the release probe, the jamming-diagram margin (the “inside” threshold 0.15 sits between the stalled −0.50 and the sliding 0.18 — MuJoCo’s sliding boundary is ≈ 0.15 inside Whitney’s line: a 36-gon wall and soft contact), wedging only above the boundary (μ 0.8 at θ₀ 2.0° inserts, μ 0.3 at θ₀ 4.5° jams instead), the vision anchor (0.016 mm with one hole, perturbed to 0.47 mm by the decoy — stated honestly), and the recorded run. Honestly: no VLM baseline is built (nothing is lined up against something that does not exist). The 5/5 is one condition per class and is not comparable with the paper’s real-robot success rate. The “vision signature” is the hover-time wrist RGB-D anchor plus encoder integration (the tip is invisible once inside the hole). The jam test is valid only while stalled with F_z ≥ 1 N (while moving the ratios are ill-conditioned and the margin reaches −1.6 although the peg advances). A +1.6 mm shift stalls at the force cap with the ratio inside — unknown, and the table stays silent. The recovery primitives are scripted (lifts of 4 / 6 / 10 mm, ≤ 6 iterations, ≤ 3 recoveries per run). Only one jam direction (the opposite side slides in). The compliant-support condition for avoiding wedging (S = L_g/(L_g² + K_θ/K_x)) is not used because the inequality cannot be read from the slides. No tactile sensing (tacslip). |

| *↑ Detecting and Recovering Peg-Insertion Failures with a Rule Table — Whitney’s Contact States Instead of a VLM, MuJoCo as the Truth ―― The capstone of the peg-in-hole thread of the physics-simulation × Fullseye series (pegsim, soft-wrist insertion, 2026.195). The prior work (Shirasaka, Beltran-Hernandez, Hamaya, Ushiku, arXiv:2509.17666, ICRA 2026, code unpublished) structures soft-wrist insertion as contact formation — a sequence of contact states that constrain the degrees of freedom one by one — and lets a VLM judge the failure mode from the final pose and an image before picking a recovery skill. Here the VLM is replaced by a rule table: the observation (contact kind none / plate / chamfer / one_point / two_point / floor, depth band above / mouth / hole / bottom, stall, whether the tilt at the onset of two-point contact is above c/μ, whether the force ratio lies inside the jamming parallelogram, whether the tip offset from the hole centre is within W + c_r) is discretised into a six-field signature and looked up in a 12-row table. At most one row matches (a validator first checks pairwise exclusivity and that all 8 classes are reachable); if none does the answer is unknown (the table decides 362 of the 576 signatures in the vocabulary and never guesses the rest: fail-closed). Ground truth comes from outside on two fronts. (1) The theorem: Whitney 1982 (the original is paywalled and unread; the equations are from the author’s own MIT OCW 2.875 Class 3 slides): wedging θ > c/μ (p.28), the jamming parallelogram λ = l/(2rμ) (p.34). The four vertices are re-derived from the planar statics of two-point contact (both points sliding down with Coulomb friction: F_x = f₂ − f₁, F_z = μ(f₁ + f₂), M = μrf₁ − (μr + l)f₂) and agree with pegsim’s vertices (the OCW values) to 2.2e-16 — this derivation fixes the sign convention of the force ratios (e_x from the wall the tip touches towards the opposite mouth edge, F_z positive when pushing, M = M⃗·(e_x × ẑ)). (2) The physics engine: MuJoCo’s contact points, normal forces and the wrist force sensor (–full). The tip load (F⃗, M⃗_tip) is read from the deflection of the wrist springs (a rule that needs no external F/T sensor): over the 3,458 quasi-static ticks spent stalled, the estimated load plus gravity balances the sum of the contact forces to 0.35 N, and agrees with the wrist force sensor (site frame → world) to 0.026 N. Failures are injected on purpose: an offset of 2.5 mm the chamfer cannot catch (> W + c_r = 1.2 mm), wedging with μ 0.8 and θ₀ 4.5° (> c/μ = 2.76°), jamming with θ₀ 3° and a +3 mm lateral target shift towards the tilt once the tip is 4 mm in, a plug at 6 mm depth, a decoy hole 26 mm away. The chain is descend (slow at 2.5 N, 12 N cap) → stall (advance < 0.05 mm over a 30-tick window, armed after 0.5 mm of progress) → signature → table → recovery primitive (lift 6 mm and re-centre with the wrist RGB-D / lift 10 mm and return to the fixture target / retract 4 mm and undo the measured tilt / pick the 0.5 mm carriage × 0.5° wrist step that maximises the parallelogram margin in a linear model / lift and abort). Figures: the flip probability of the offset field when σ = 0.05 mm noise is added at the W + c_r = 1.2 mm boundary (0.508 at the boundary, 0.168 / 0.157 at ±1σ, within 0.03 of Φ(−1); dashed = theory), the confusion matrix of the 6 injected classes (6 / 6 from truth signatures, 6 / 6 from the vision signatures), the jamming diagram with the trajectory of force ratios estimated from the wrist load (the tick where the jam stall is detected lies outside its own-depth parallelogram at l = 5.3 mm with margin −0.50, the 321 ticks of nominal two-point sliding lie inside with min 0.18 / median 0.20 — the diagram widens with depth, so two parallelograms are drawn), depth vs tick for the wedge (stall → wedging in the same tick → retract + tilt reset → re-descend and succeed), a 48-frame wrist-camera GIF (‘detected: wedging -> retract_reduce_tilt’ appears, then the re-descent), and the release-probe table. ★The release probe shows Whitney’s distinction physically: the wedge (μ 0.8, θ 4.7°) stays at 5.90 mm when the push is removed (F_z 2.03 → 0.64 N) and even when pulled by 2 mm (F_z −0.39 N) — compression is stored inside; the jam (μ 0.3, θ 4.4°, F_x 1.3 N) advances under its own weight from 6.25 to 7.21 mm once the lateral force is also removed and comes back to 5.30 mm when pulled — a matter of force direction. 12 gates (numpy only, 0.6 s) plus 8 with –full (MuJoCo, 14 s, 35 s with figures): table completeness and exclusivity, parallelogram vertices 2.2e-16, the wedging boundary at c/μ ∓ 1e-9 rad (7.353° at μ 0.3, 2.755° at 0.8), stall detection (no false alarm on three monotone descents plus a hover, onset 27 ticks after the true stop, armed at tick 17), all 362 row signatures classify to their row, three unknown signatures and four spelling breaks, the closed-form wrist load to 1e-12, flip probability = Φ(− | z | ), synthetic RGB-D (analytic ray cast, no mujoco) offsets at four poses to 0.002 mm → field → class = truth, discretisation boundaries, the summary latency of 30 ticks and the confusion matrix, the MJCF (two force/torque sensors, the plug, 109 decoy geoms plus a 4-box frame, ValueError for a plug outside the hole or an overlapping decoy); –full: force closure, the injection grid 6 classes × {no recovery, recovery} with 6 / 6 from truth and from vision signatures and 0/5 → 5/5 (the blocked hole is correctly aborted = success), detection latencies of 32–33 ticks (= 30-tick window + ≤ 10 confirmation), 9 for the plug and 18 for the decoy, the release probe, the jamming-diagram margin (the “inside” threshold 0.15 sits between the stalled −0.50 and the sliding 0.18 — MuJoCo’s sliding boundary is ≈ 0.15 inside Whitney’s line: a 36-gon wall and soft contact), wedging only above the boundary (μ 0.8 at θ₀ 2.0° inserts, μ 0.3 at θ₀ 4.5° jams instead), the vision anchor (0.016 mm with one hole, perturbed to 0.47 mm by the decoy — stated honestly), and the recorded run. Honestly: no VLM baseline is built (nothing is lined up against something that does not exist). The 5/5 is one condition per class and is not comparable with the paper’s real-robot success rate. The “vision signature” is the hover-time wrist RGB-D anchor plus encoder integration (the tip is invisible once inside the hole). The jam test is valid only while stalled with F_z ≥ 1 N (while moving the ratios are ill-conditioned and the margin reaches −1.6 although the peg advances). A +1.6 mm shift stalls at the force cap with the ratio inside — unknown, and the table stays silent. The recovery primitives are scripted (lifts of 4 / 6 / 10 mm, ≤ 6 iterations, ≤ 3 recoveries per run). Only one jam direction (the opposite side slides in). The compliant-support condition for avoiding wedging (S = L_g/(L_g² + K_θ/K_x)) is not used because the inequality cannot be read from the slides. No tactile sensing (tacslip).* |

↑ The measurement ―― 注入した失敗 6 クラスと表の分類(真値署名): 対角 6 / 6。右列は視覚のずれ(構え時の RGB-D + エンコーダ積分)で作った署名の正答 6 / 6。 (figure labels are in Japanese; the numbers are the same)

↑ 手首ばねのたわみから推定した先端の力の比。

↑ μ = 0.8・θ₀ = 4.5° のくさび。

↑ くさびは力を抜いても引いても動かない(深さ 5.90 → 5.90 mm、内部圧縮)、詰まりは横の力を抜くと自重で進み(6.25 → 7.21 mm)引けば戻る(5.30 mm、力の向きの問題)—— Whitney の区別を MuJoCo で。
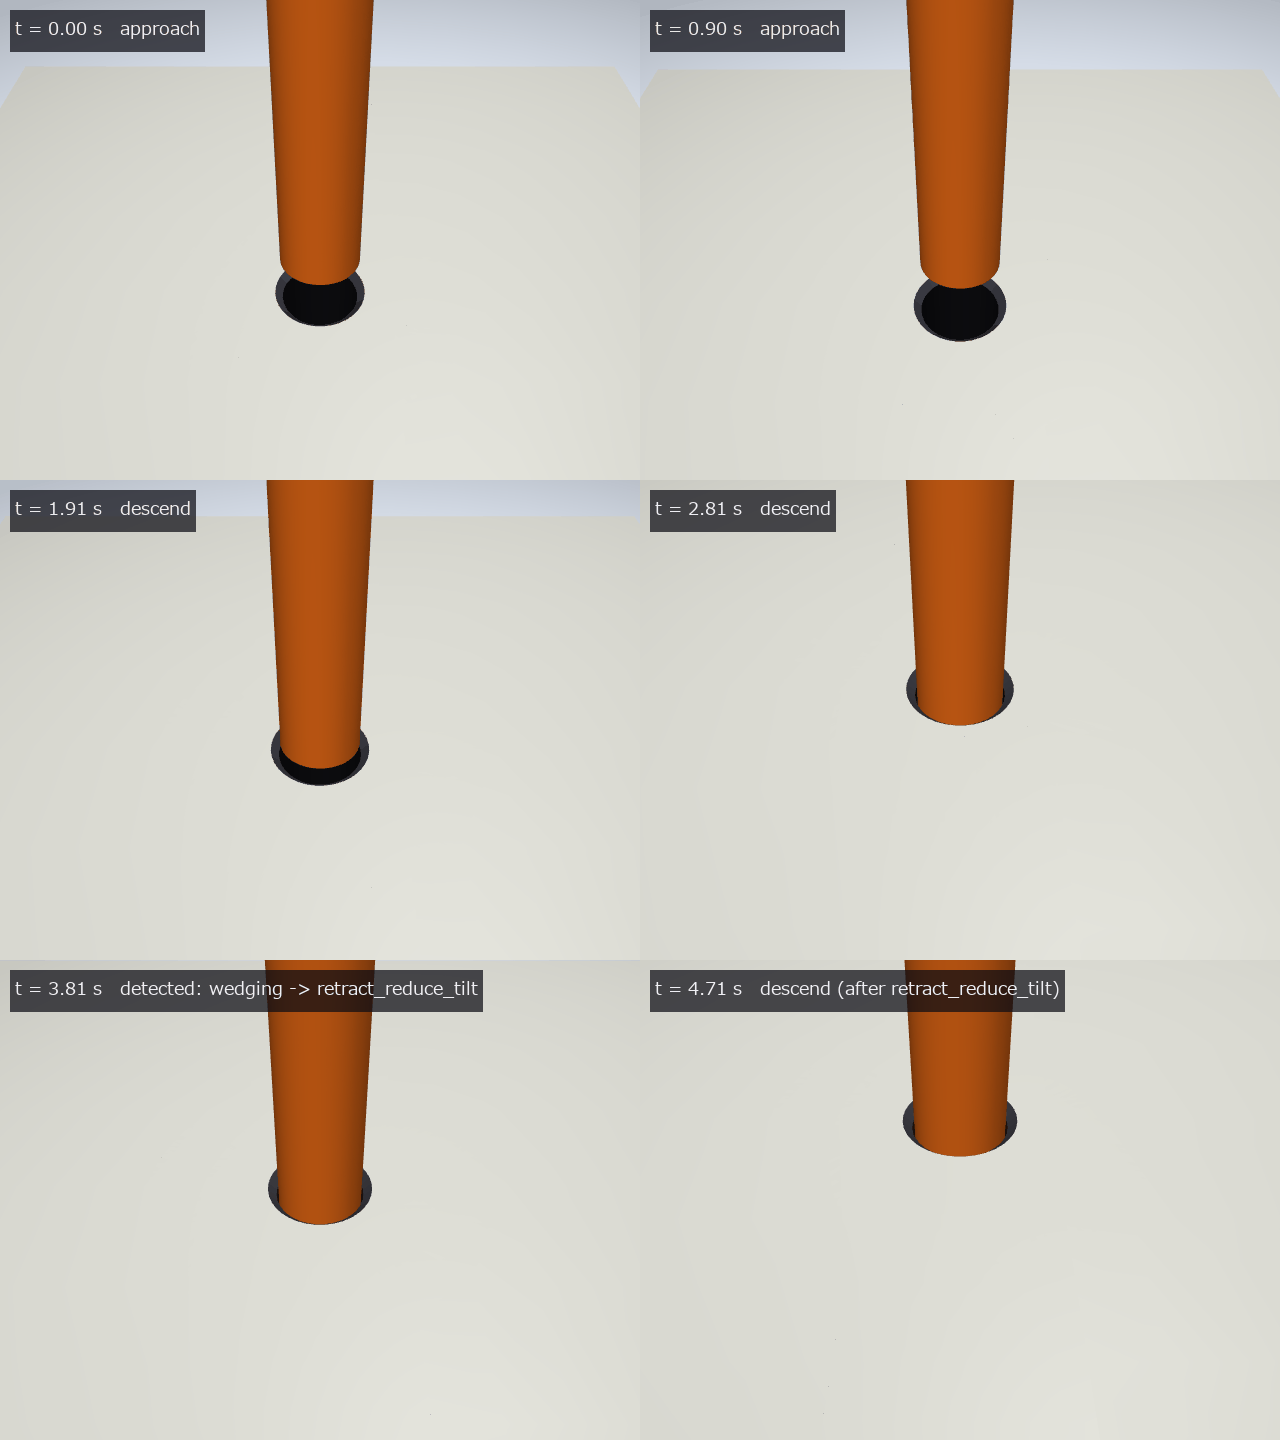
↑ The animation ―― 手首カメラ(640×480、0.1 s ごと、48 コマ): 降下 → くさびで止まる → ‘detected: wedging’ → 退避して傾きを戻す → 再降下で成功。
py -3.11 examples/poc_peg_failure_recovery.py
Source: examples/poc_peg_failure_recovery.py
This run produced 6 figures in total - see them all
Ops used (notes): chamfer_capture · failure_confusion · insertion_episode_summary · insertion_failure_classify · insertion_failure_presets · insertion_failure_table · insertion_failure_validate · insertion_recovery_primitive · insertion_signature · insertion_stall_detect · jamming_diagram · jamming_force_check · jamming_parallelogram_planar · peg_offset_from_rgbd · peg_params · peg_synthetic_rgbd · pegfail_scene_mjcf · text_box · tip_force_ratios · vision_boundary_flip · wedging_risk · whitney_clearance · wrist_load_from_deflection
No.2026.203 —— Calibrating a Vision-Based Tactile Sensor’s Illumination on Real Calibration Spheres, with a Gradient LUT as the Second Implementation — the Ball Radius and Hand-Marked Circles as the Truth
| The physics-simulation × Fullseye series continues from tacsim (elastic membrane + camera, 2026.196). tacsim synthesised its own three-colour Lambertian images and inverted them itself — the truth and the subject were both home-made. This exhibit brings in real images (the calibration packs published under the MIT licence by the authors of arXiv:2109.04027), calibrates the forward map (normal → colour) and solves the inverse along two independent routes: a linear 12-parameter illumination I_c = a_c + l_c · n (inverted by photometric_stereo = the subject) and an example-based gradient LUT (tilt θ and azimuth φ cut into 125 × 125 bins, mean colour per bin, also a version with a quadratic in position). New module tacscalib, 10 ops, numpy only. Two truths come from outside: the known ball radius (inside the contact circle the membrane follows the sphere, so the normal is the closed form n = (−x, −y, √(R² − r²))/R) and hand-marked contact circles (integer pixels, radii in 2 px steps = a weak truth). R enters both calibration and evaluation, so the gates test whether the calibration generalises to other images, not R itself — calibrate on the 24 even frames, measure on the 24 odd ones. ★A dead band in the prototype was fixed: fitting the position quadratic only to well-populated bins dropped every low-tilt bin, and pixels with tilt 0–15° snapped to 0 or 15° (barely visible in the median angular error; only the profile plot showed it). Sparse bins now borrow the position terms of the angularly nearest polynomial bin and fit only their own constant — on the real hold-out, the median | Δθ | for true tilt < 15° drops from 4.84° to 1.89°. The price: the tilt floor on flat ground rises from 0.4° to 3.3° (the colour difference between a small tilt and flat sinks into the 3.6 DN background noise = a resolution limit). Single-row bins carry pure noise and bias the depth by +18.5 %; a minimum of 10 rows gives +6.0 %. ★The inverse lookup rewrites the distance as one feature inner product ( | k | ² = AᵀQA) and runs coarse → fine (pick the top two 3 × 3-bin blocks by their representatives): the same bin as brute force for 90.0 % of pixels, median angular error within 0.10°, 2.4× faster. 9 gates (synthetic, 1.3 s) plus 10 with –full (real data, 42 s): illumination round trip 4.8e-15, quantisation floor 0.430°, with ±40 % position gain 0.726° with position terms vs 4.600° without, dead band 13.24° → 0.58°, coefficients mapped in closed form to an external quadratic-LUT format agree to 7.1e-15 DN; real hold-out of 24 frames: RGB residual linear 7.92 DN (72-parameter position model 4.63, background noise 3.60), median angular error linear 10.71° / LUT without position 8.58° / LUT with position 4.17° / the external pre-calibrated LUT 3.57°*, contact_radius_ring (the subject) radius −0.25 px (−12.9 px with its default search radius), depth +4.7 % against 595 µm with a profile RMS of 7.1 µm, 7.59 / 8.83 / 3.70° for the position LUT with 1 / 4 / 24 calibration frames, and the second sensor’s linear residual 30.8 DN = 3.9× the first. Figures: a synthetic press with the error maps of three routes, a GIF circling the light (reconstruction vs the true spherical cap), the dead band before and after; with –full: a real frame → reconstruction → true cap, a real-data GIF, profiles, residual maps, error maps, the sensor-plane error map, the position scatter, the calibration-count curve and the radial tilt. All at 1:1. Honestly: there is no truth for force or indentation depth. Angular errors are for the nearest-bin LUT (no interpolation). *The external LUT was built from the same 48 frames, so it is a reference, not a hold-out. The second pack has no primary source for ball diameter or pixel pitch (only a code comment giving 0.0266 mm/px), so only radius-independent quantities (the ratio of linear residuals) are gated and the angular errors are ranked only. The position LUT breaks in the image corners (extrapolation where few calibration balls landed). Trap we hit: with all centres on integer pixels the synthetic data never produces sparse bins, so the dead band is invisible in principle (reproduced with sub-pixel offsets). Two issues in existing ops (contact_radius_ring’s default search radius cuts the circle at a quarter of the window; photometric.angular_error_deg’s 1.15e-4° floor) were fixed in a later commit (default search radius: −12.9 px → −0.25 px, and the default is now part of gate 12). |

| *↑ Calibrating a Vision-Based Tactile Sensor’s Illumination on Real Calibration Spheres, with a Gradient LUT as the Second Implementation — the Ball Radius and Hand-Marked Circles as the Truth ―― The physics-simulation × Fullseye series continues from tacsim (elastic membrane + camera, 2026.196). tacsim synthesised its own three-colour Lambertian images and inverted them itself — the truth and the subject were both home-made. This exhibit brings in real images (the calibration packs published under the MIT licence by the authors of arXiv:2109.04027), calibrates the forward map (normal → colour) and solves the inverse along two independent routes: a linear 12-parameter illumination I_c = a_c + l_c · n (inverted by photometric_stereo = the subject) and an example-based gradient LUT (tilt θ and azimuth φ cut into 125 × 125 bins, mean colour per bin, also a version with a quadratic in position). New module tacscalib, 10 ops, numpy only. Two truths come from outside: the known ball radius (inside the contact circle the membrane follows the sphere, so the normal is the closed form n = (−x, −y, √(R² − r²))/R) and hand-marked contact circles (integer pixels, radii in 2 px steps = a weak truth). R enters both calibration and evaluation, so the gates test whether the calibration generalises to other images, not R itself — calibrate on the 24 even frames, measure on the 24 odd ones. ★A dead band in the prototype was fixed: fitting the position quadratic only to well-populated bins dropped every low-tilt bin, and pixels with tilt 0–15° snapped to 0 or 15° (barely visible in the median angular error; only the profile plot showed it). Sparse bins now borrow the position terms of the angularly nearest polynomial bin and fit only their own constant — on the real hold-out, the median | Δθ | for true tilt < 15° drops from 4.84° to 1.89°. The price: the tilt floor on flat ground rises from 0.4° to 3.3° (the colour difference between a small tilt and flat sinks into the 3.6 DN background noise = a resolution limit). Single-row bins carry pure noise and bias the depth by +18.5 %; a minimum of 10 rows gives +6.0 %. ★The inverse lookup rewrites the distance as one feature inner product ( | k | ² = AᵀQA) and runs coarse → fine (pick the top two 3 × 3-bin blocks by their representatives): the same bin as brute force for 90.0 % of pixels, median angular error within 0.10°, 2.4× faster. 9 gates (synthetic, 1.3 s) plus 10 with –full (real data, 42 s): illumination round trip 4.8e-15, quantisation floor 0.430°, with ±40 % position gain 0.726° with position terms vs 4.600° without, dead band 13.24° → 0.58°, coefficients mapped in closed form to an external quadratic-LUT format agree to 7.1e-15 DN; real hold-out of 24 frames: RGB residual linear 7.92 DN (72-parameter position model 4.63, background noise 3.60), median angular error linear 10.71° / LUT without position 8.58° / LUT with position 4.17° / the external pre-calibrated LUT 3.57°, contact_radius_ring (the subject) radius −0.25 px (−12.9 px with its default search radius), depth +4.7 % against 595 µm with a profile RMS of 7.1 µm, 7.59 / 8.83 / 3.70° for the position LUT with 1 / 4 / 24 calibration frames, and the second sensor’s linear residual 30.8 DN = 3.9× the first. Figures: a synthetic press with the error maps of three routes, a GIF circling the light (reconstruction vs the true spherical cap), the dead band before and after; with –full: a real frame → reconstruction → true cap, a real-data GIF, profiles, residual maps, error maps, the sensor-plane error map, the position scatter, the calibration-count curve and the radial tilt. All at 1:1. Honestly: there is no truth for force or indentation depth. Angular errors are for the nearest-bin LUT (no interpolation). *The external LUT was built from the same 48 frames, so it is a reference, not a hold-out. The second pack has no primary source for ball diameter or pixel pitch (only a code comment giving 0.0266 mm/px), so only radius-independent quantities (the ratio of linear residuals) are gated and the angular errors are ranked only. The position LUT breaks in the image corners (extrapolation where few calibration balls landed). Trap we hit: with all centres on integer pixels the synthetic data never produces sparse bins, so the dead band is invisible in principle (reproduced with sub-pixel offsets). Two issues in existing ops (contact_radius_ring’s default search radius cuts the circle at a quarter of the window; photometric.angular_error_deg’s 1.15e-4° floor) were fixed in a later commit (default search radius: −12.9 px → −0.25 px, and the default is now part of gate 12). |
↑ The measurement ―― 位置つき LUT の法線を Frankot–Chellappa で積分した面に光を 1 周させる(中央)、右は真の球冠。等倍 89×89、24 コマ。 (figure labels are in Japanese; the numbers are the same)

↑ 合成の 1 球、真の傾き < 15° の画素。

↑ 法線の半径スロープを方位平均して 1D 積分した断面と真の球冠(破線)。

↑ 法線の角誤差 0〜20°(同じ hold-out 1 枚、等倍)。

↑ 接触中心の画像中心からの距離 vs 角誤差の中央値(hold-out 各 1 点)。
↑ The animation ―― 実機の 1 枚から復元した面に光を 1 周させる(中央)、右は真の球冠。等倍 201×201、24 コマ。
py -3.11 examples/poc_tacscalib_sphere_lut.py
Source: examples/poc_tacscalib_sphere_lut.py
This run produced 12 figures in total - see them all
Ops used (notes): calib_pack_load · contact_radius_ring · field_position_sweep · gradient_lut_build · gradient_lut_invert · integrate_normals · invert · lights_fit_from_sphere · median · membrane_predict_rgb · normal_error_map · normals_to_angles · poly_lut_invert · reflect · sphere_cap_height · sphere_normals_known · surface_normals · text_box
No.2026.204 —— Reading Peg-in-Hole Insertion through Two Fingertip Membranes — Contact Wrench, Whitney’s Contact States, Wall Friction and Wrist Stiffness from Shear Images; at the Wedging Boundary the Wrench Alone Is Blind
| The capstone of the physics-simulation × Fullseye series (pegsim 2026.195, pegfail 2026.201) and of the three vision-based tactile exhibits (tacsim, tacslip, tactorque). Elastic membranes are mounted on the two fingertips; the contact wrench the peg receives from the hole is recovered from the two membrane images alone, and Whitney’s contact states (none / chamfer / one point / two points, and wedging or jamming once stalled) are called by learning-free rules. In the same insertion the wrist stiffness k is identified from wrist-camera deflection × tactile force, and the symmetry of the peg shape (n-fold) and of the apparatus (two fingers are not rotationally symmetric) is measured by equivariance gates. New module pegtactile, 19 ops, plus 2 added to existing modules (tacsim.contact_radius_fit_pixelwise = contact radius without radial bins; tacslip.mindlin_fit_vector = a two-coefficient Mindlin fit for directed shear) and 4 mujoco facades. Ground truth comes from outside on four fronts. (1) The theorem: Whitney 1982 (paywalled and unread; the equations are from the author’s own MIT OCW 2.875 Class 3 slides): the two-point depth l₂(θ) = (2R − r(cosθ + secθ))/tanθ and the wedging boundary θ = c/μ. (2) Contact-mechanics closed forms (Johnson 1985): Hertz, Cattaneo–Mindlin, Cerruti, no-slip torsion and the full-slip torque (since 2026-10-06 torsion is synthesised and read with a numerical partial-slip solution whose two limits are these; the 0.4.0 no-slip reading over-reads partial-slip images by +33 % at half the full-slip torque and the gates missed it because the synthesis was no-slip too — gate 2b). (3) Group actions (rotate the shape or the scene and the answer rotates by the same amount). (4) MuJoCo’s contact points and forces, the wrist force/torque sensor and the set wrist-spring values (–full). MuJoCo has no membrane, so the pad loads are a statics map that distributes the exposure-averaged contact wrench plus gravity to the two pads. ★The wedging boundary is the blind spot of a wrench-only rule: where the slope c/θ of the line from mouth to tip equals μ, the edge of the tip’s friction cone passes through the mouth contact and a two-point wrench is indistinguishable from a single mouth contact (2 of 36 closed-form cases, θ 3°, μ 0.8). Adding Whitney’s geometry (force two-point when depth ≥ W + l₂(θ)) gives 36/36. ★Rotating the scene by 90° moves the tilting moment from a shear couple to pad torsion: reading torsion keeps the agreement at 97.6 → 96.8 %; dropping it gives 47.6 %. Figures: the two membrane images and their readings, a GIF of Whitney’s closed-form insertion read through the membranes, the radial-bin trap, the wrench-only blind spot, shape orientation (Fourier phase vs second moments); with –full: an insertion GIF (hole cross-section, wrist camera, both membranes, state band), time series of four runs, wrist stiffness F = kΔx, the two-point onset, and the agreement after a 90° rotation. 11 gates (numpy, 3.5 s) plus 12 with –full (3 heavy numpy + 9 MuJoCo): statics round trip 4.4e-16; membrane round trip P 0.011 %, q 2.8 mN (4.4 mN over 20 cases), torsion 0.015 mN·m, direction 0.12°; false shear at zero load 12.1 mN on a regular marker grid → 0.7 mN with jitter; slope error of P̂ 8.5 % with bins → 0.018 % per pixel; Whitney’s 36 cases 34 with the wrench only → 36 with geometry; two-point μ within 0.0008 (normal force 0.6 N); n-fold symmetry 0/3/4/6/1; Fourier-phase orientation 0.001–0.018° (keyed 0.59°) vs second moments off by 10–59°; wrist RGB-D equivariance 3.2 µm (0.000 µm under the mirror); MuJoCo: map vs force sensor 0.41 mN and 0.023 mN·m, tactile wrench | ΔF | median 2.7 / max 7.0 mN, state agreement 97.7 % (98.2 % with the true wrench), two-point onset within 0.04 mm of the closed form, wall μ 0.292 from one-point and 0.2998 from two-point sliding (set 0.3), wedging / jamming 2/2, wrist camera 1.2 µm, k_t 599.9–601.1 N/m (set 600), k_r 1.496–1.512 N·m/rad (set 1.5). Honestly: MuJoCo has no membrane, so the pad loads come from a statics map (symmetric left/right split assumed, peg inertia ignored — 11.7 mN vertical lies outside it). Synthesis and inversion use the same closed-form family, so errors of the membrane model (finite thickness, large deformation) are invisible to these gates (tacslip’s finite-element comparison covers that). k is identified only in two-point intervals. Each condition is run once. There is no MuJoCo insertion of square or hexagonal pegs (symmetry is gated on the perception ops only). Traps we hit: pixel locking of a regular marker grid, radial-bin contact radii that skew the slope of P̂ by 40 % and k by +3.7 % through the two-pad difference, instantaneous contact forces are impulses (averaged over the exposure), and without pruning the candidate points a two-point line of action reads as one point. |

| *↑ Reading Peg-in-Hole Insertion through Two Fingertip Membranes — Contact Wrench, Whitney’s Contact States, Wall Friction and Wrist Stiffness from Shear Images; at the Wedging Boundary the Wrench Alone Is Blind ―― The capstone of the physics-simulation × Fullseye series (pegsim 2026.195, pegfail 2026.201) and of the three vision-based tactile exhibits (tacsim, tacslip, tactorque). Elastic membranes are mounted on the two fingertips; the contact wrench the peg receives from the hole is recovered from the two membrane images alone, and Whitney’s contact states (none / chamfer / one point / two points, and wedging or jamming once stalled) are called by learning-free rules. In the same insertion the wrist stiffness k is identified from wrist-camera deflection × tactile force, and the symmetry of the peg shape (n-fold) and of the apparatus (two fingers are not rotationally symmetric) is measured by equivariance gates. New module pegtactile, 19 ops, plus 2 added to existing modules (tacsim.contact_radius_fit_pixelwise = contact radius without radial bins; tacslip.mindlin_fit_vector = a two-coefficient Mindlin fit for directed shear) and 4 mujoco facades. Ground truth comes from outside on four fronts. (1) The theorem: Whitney 1982 (paywalled and unread; the equations are from the author’s own MIT OCW 2.875 Class 3 slides): the two-point depth l₂(θ) = (2R − r(cosθ + secθ))/tanθ and the wedging boundary θ = c/μ. (2) Contact-mechanics closed forms (Johnson 1985): Hertz, Cattaneo–Mindlin, Cerruti, no-slip torsion and the full-slip torque (since 2026-10-06 torsion is synthesised and read with a numerical partial-slip solution whose two limits are these; the 0.4.0 no-slip reading over-reads partial-slip images by +33 % at half the full-slip torque and the gates missed it because the synthesis was no-slip too — gate 2b). (3) Group actions (rotate the shape or the scene and the answer rotates by the same amount). (4) MuJoCo’s contact points and forces, the wrist force/torque sensor and the set wrist-spring values (–full). MuJoCo has no membrane, so the pad loads are a statics map that distributes the exposure-averaged contact wrench plus gravity to the two pads. ★The wedging boundary is the blind spot of a wrench-only rule: where the slope c/θ of the line from mouth to tip equals μ, the edge of the tip’s friction cone passes through the mouth contact and a two-point wrench is indistinguishable from a single mouth contact (2 of 36 closed-form cases, θ 3°, μ 0.8). Adding Whitney’s geometry (force two-point when depth ≥ W + l₂(θ)) gives 36/36. ★Rotating the scene by 90° moves the tilting moment from a shear couple to pad torsion: reading torsion keeps the agreement at 97.6 → 96.8 %; dropping it gives 47.6 %. Figures: the two membrane images and their readings, a GIF of Whitney’s closed-form insertion read through the membranes, the radial-bin trap, the wrench-only blind spot, shape orientation (Fourier phase vs second moments); with –full: an insertion GIF (hole cross-section, wrist camera, both membranes, state band), time series of four runs, wrist stiffness F = kΔx, the two-point onset, and the agreement after a 90° rotation. 11 gates (numpy, 3.5 s) plus 12 with –full (3 heavy numpy + 9 MuJoCo): statics round trip 4.4e-16; membrane round trip P 0.011 %, q 2.8 mN (4.4 mN over 20 cases), torsion 0.015 mN·m, direction 0.12°; false shear at zero load 12.1 mN on a regular marker grid → 0.7 mN with jitter; slope error of P̂ 8.5 % with bins → 0.018 % per pixel; Whitney’s 36 cases 34 with the wrench only → 36 with geometry; two-point μ within 0.0008 (normal force 0.6 N); n-fold symmetry 0/3/4/6/1; Fourier-phase orientation 0.001–0.018° (keyed 0.59°) vs second moments off by 10–59°; wrist RGB-D equivariance 3.2 µm (0.000 µm under the mirror); MuJoCo: map vs force sensor 0.41 mN and 0.023 mN·m, tactile wrench | ΔF | median 2.7 / max 7.0 mN, state agreement 97.7 % (98.2 % with the true wrench), two-point onset within 0.04 mm of the closed form, wall μ 0.292 from one-point and 0.2998 from two-point sliding (set 0.3), wedging / jamming 2/2, wrist camera 1.2 µm, k_t 599.9–601.1 N/m (set 600), k_r 1.496–1.512 N·m/rad (set 1.5). Honestly: MuJoCo has no membrane, so the pad loads come from a statics map (symmetric left/right split assumed, peg inertia ignored — 11.7 mN vertical lies outside it). Synthesis and inversion use the same closed-form family, so errors of the membrane model (finite thickness, large deformation) are invisible to these gates (tacslip’s finite-element comparison covers that). k is identified only in two-point intervals. Each condition is run once. There is no MuJoCo insertion of square or hexagonal pegs (symmetry is gated on the perception ops only). Traps we hit: pixel locking of a regular marker grid, radial-bin contact radii that skew the slope of P̂ by 40 % and k by +3.7 % through the two-pad difference, instantaneous contact forces are impulses (averaged over the exposure), and without pruning the candidate points a two-point line of action reads as one point.* |

↑ The measurement ―― Whitney の二点接触(θ 3°、μ 0.8 = くさびの境目の近く)を 2 本の指の膜で見た像(等倍 256 px = 16 mm)。矢印はマーカーの変位 ×12、円は読んだ接触円。真値の荷重 L: P 4.093 N・q (-0.000, 0.344) N、R: P 3.907 N・q (-0.000, 0.398) N。左右でせん断の v 成分が逆向き = モーメントは偶力で運ばれる。 (figure labels are in Japanese; the numbers are the same)

↑ 同じ二点接触の接触レンチ。

↑ 二点接触(閉形式)をレンチだけの規則に通すと、口と先端を結ぶ線の傾き c/θ が μ に等しい線(破線、Whitney のくさびの境目そのもの)の近くでだけ口の一点と読む(12 組中 2 組)。

↑ 走行 B の接触力の大きさと把持点まわりの M_y(破線 = MuJoCo の露光平均、実線 = 膜 2 枚から)。

↑ 走行 D の接触力の大きさと把持点まわりの M_y(破線 = MuJoCo の露光平均、実線 = 膜 2 枚から)。
↑ The animation ―― Whitney の閉形式の挿入(θ 3°、μ 0.3)を膜 2 枚で読む動く図: 先端が壁に一点で触れたまま深くなり、深さ W + l₂(θ) = 8.63 mm で胴が口の縁にも触れて二点へ。上の文字の色 = 膜からの判定が真値と一致(全 14 コマ)。
↑ The animation ―― 挿入の動く図(θ 3°、横ずれ 0.6 mm、48 コマ = 0.08 s ごと): 左 = 穴の断面(板を半透明、緑の円 = MuJoCo の接触点、大きさ ∝ 力、桃の × = 膜 2 枚から読んだ接触点)、中 = 手首カメラ、右 = 2 本の指の膜(矢印 ×12)。下の帯 = 状態(灰 無接触・青 面取り・橙 一点・赤 二点)の MuJoCo と触覚。
py -3.11 examples/poc_peg_insertion_tactile.py
Source: examples/poc_peg_insertion_tactile.py
This run produced 14 figures in total - see them all
Ops used (notes): arrow · blob_features · blob_label · contact_radius_fit · contact_radius_fit_pixelwise · contact_state_from_wrench · ellipse · equivariance_check · friction_from_single_contact · hertz_force · hertz_sphere · membrane_recover · pad_context · pad_loads_to_peg_wrench · pad_params · pad_tactile_frame · pad_tactile_read · peg_offset_from_rgbd · peg_params · peg_synthetic_rgbd · peg_wrench_to_pad_loads · project_points · stall_verdict · symmetric_peg_shape … (+8)
No.2026.208 —— Cutting a Peg’s Rotation Search to 1/n with Its Symmetry — Inserting Square, Hexagonal and Keyed Pegs Checked by Group Identities, Closed Forms and MuJoCo; Friction Shrinks the Hexagon’s Chamfer Window from 20.9° to 6.8°
The physics-simulation × Fullseye series continues (soft-wrist peg insertion, failure classification, two-finger membranes). The subject is research that uses symmetry for learning (Symmetry-aware RL, ICRA 2024, arXiv:2402.18002; the abstract was read as the primary source); here the group identities themselves are the gates, building the parts that remain without learning. Regular n-gon prisms (n = 3, 4, 6) and a keyed square with one corner cut by 1.8 mm (symmetry n = 1) are inserted into holes of the same shape offset outward by 0.2 mm (45° chamfer, 0.5 mm). New module pegsym, 15 ops plus 6 mujoco facades. (1) Reading orientation: images are rectified to a top view of the plane (the hole mouth from the wrist camera, the peg end face from an upward camera), and the complex Fourier phase of the contour gives the angle modulo 2π/n. Second moments are isotropic for n ≥ 3 and carry no orientation (a trap). Synthetic equivariance over 40 angles per period: 0.054° for regular polygons, 0.19° keyed; from MuJoCo images the relative angle is within 0.05° (regular) and 0.70° keyed (bias from a hole that is not similar). (2) Rotation window (derived): φ = π/n − arccos((A + δ + W)cos(π/n)/A) (written with atan2) matches a linear program with free translation (second implementation) to 2.8e-11 rad; windows are 4.75° triangle, 8.72° square, 20.85° hexagon. (3) The friction limit (derived, found in MuJoCo): only the hexagon captured just 7.25° in MuJoCo. For a vertex resting on the mouth to slide down the chamfer the peg must turn, and the moment balance about the axis says it turns only if sin²β > (√(1 + 8μ²) − 1)/2. Within 0.5° of MuJoCo at six points μ = 0–0.5 (μ = 0.3: closed form 6.76°, MuJoCo 7.25°). (4) Number of tries: the closed-form expectation of sweeping one period with steps at most twice the window agrees within 3 % with an error grid judged by a linear program on the mouth (triangle 6.97 / 6.96, square 3.36 / 3.29, hexagon 1.31 / 1.29, keyed 10.98 / 11.02). Blind searches in MuJoCo (12 hole orientations × 4 shapes) match the predicted tries in 47 / 48, with means of 3.50 (square) and 11.00 (keyed). Using the image reading as the estimate inserts 16 / 16 on the first try; rebuilding the hole rotated by an extra 2πk/n gives the same tries (6 / 6). (5) Two-point contact of polygons: no closed form was found, so an exact solution was built from a linear program on convex-hull vertices plus bisection. A square tilted about an axis parallel to a face matches Whitney’s cylinder formula to 3.4e-11 m and the small-angle limit of eq. (2.28) of Goli et al. 2024 (R. Soc. Open Sci.) to 1.00000; a second implementation with MuJoCo’s distance function agrees within 6.5 µm of lateral clearance. (6) Spiral: at first the search skipped turns near the centre and left 64 / 11,285 holes in the cover → arc length is now accumulated on a fine grid. With steps meeting the sufficient condition there are no holes, and the expected count is within 3.6 % of the swept-area approximation. Figures: a GIF of three rotating shapes and their readings, tries vs symmetry, window margin, two-point depth vs tilt direction, spiral cover; with –full: a GIF of the MuJoCo blind search, window vs friction, and the rectified wrist and upward views. 10 gates (default, 1.8 s) plus 7 with –full (42 s with figures). Honestly: the peg orientation is read by a fixed upward camera mid-process (the wrist camera alone cannot see the end face). The friction limit is derived for a 45° chamfer, quasi-statics and a weak spring about the axis; for the square at μ ≥ 0.5 MuJoCo is 0.7° wider (shown as a breakdown, not gated). Sturges’s square-peg wedging was not read. The nested count for searching translation and rotation together is an independence approximation and is not gated.
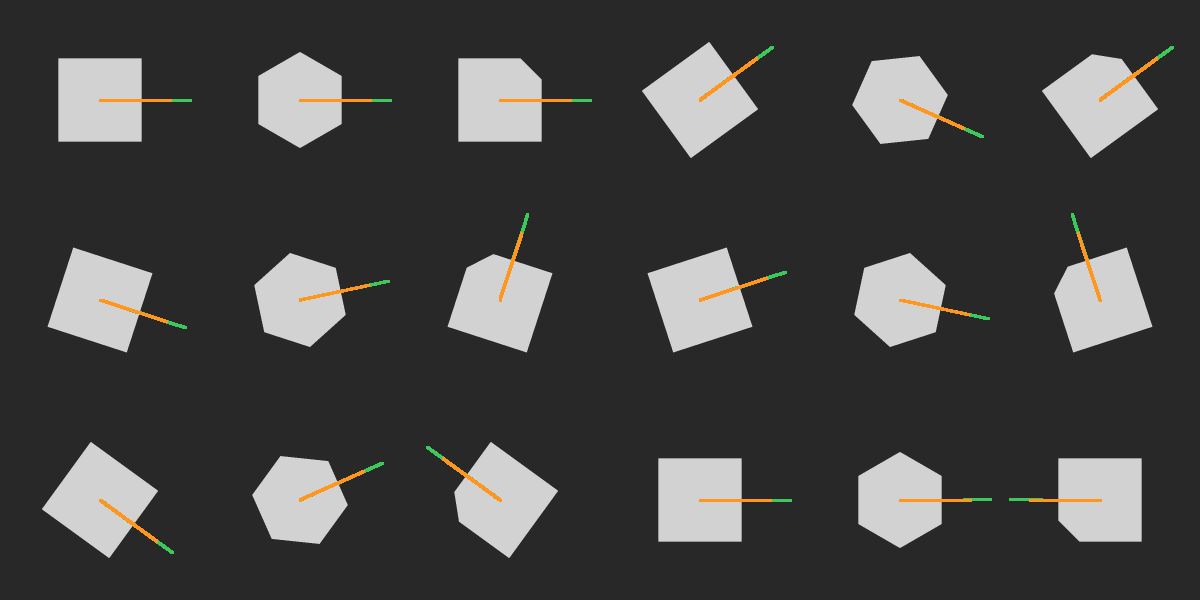
↑ Cutting a Peg’s Rotation Search to 1/n with Its Symmetry — Inserting Square, Hexagonal and Keyed Pegs Checked by Group Identities, Closed Forms and MuJoCo; Friction Shrinks the Hexagon’s Chamfer Window from 20.9° to 6.8° ―― The physics-simulation × Fullseye series continues (soft-wrist peg insertion, failure classification, two-finger membranes). The subject is research that uses symmetry for learning (Symmetry-aware RL, ICRA 2024, arXiv:2402.18002; the abstract was read as the primary source); here the group identities themselves are the gates, building the parts that remain without learning. Regular n-gon prisms (n = 3, 4, 6) and a keyed square with one corner cut by 1.8 mm (symmetry n = 1) are inserted into holes of the same shape offset outward by 0.2 mm (45° chamfer, 0.5 mm). New module pegsym, 15 ops plus 6 mujoco facades. (1) Reading orientation: images are rectified to a top view of the plane (the hole mouth from the wrist camera, the peg end face from an upward camera), and the complex Fourier phase of the contour gives the angle modulo 2π/n. Second moments are isotropic for n ≥ 3 and carry no orientation (a trap). Synthetic equivariance over 40 angles per period: 0.054° for regular polygons, 0.19° keyed; from MuJoCo images the relative angle is within 0.05° (regular) and 0.70° keyed (bias from a hole that is not similar). (2) Rotation window (derived): φ = π/n − arccos((A + δ + W)cos(π/n)/A) (written with atan2) matches a linear program with free translation (second implementation) to 2.8e-11 rad; windows are 4.75° triangle, 8.72° square, 20.85° hexagon. (3) The friction limit (derived, found in MuJoCo): only the hexagon captured just 7.25° in MuJoCo. For a vertex resting on the mouth to slide down the chamfer the peg must turn, and the moment balance about the axis says it turns only if sin²β > (√(1 + 8μ²) − 1)/2. Within 0.5° of MuJoCo at six points μ = 0–0.5 (μ = 0.3: closed form 6.76°, MuJoCo 7.25°). (4) Number of tries: the closed-form expectation of sweeping one period with steps at most twice the window agrees within 3 % with an error grid judged by a linear program on the mouth (triangle 6.97 / 6.96, square 3.36 / 3.29, hexagon 1.31 / 1.29, keyed 10.98 / 11.02). Blind searches in MuJoCo (12 hole orientations × 4 shapes) match the predicted tries in 47 / 48, with means of 3.50 (square) and 11.00 (keyed). Using the image reading as the estimate inserts 16 / 16 on the first try; rebuilding the hole rotated by an extra 2πk/n gives the same tries (6 / 6). (5) Two-point contact of polygons: no closed form was found, so an exact solution was built from a linear program on convex-hull vertices plus bisection. A square tilted about an axis parallel to a face matches Whitney’s cylinder formula to 3.4e-11 m and the small-angle limit of eq. (2.28) of Goli et al. 2024 (R. Soc. Open Sci.) to 1.00000; a second implementation with MuJoCo’s distance function agrees within 6.5 µm of lateral clearance. (6) Spiral: at first the search skipped turns near the centre and left 64 / 11,285 holes in the cover → arc length is now accumulated on a fine grid. With steps meeting the sufficient condition there are no holes, and the expected count is within 3.6 % of the swept-area approximation. Figures: a GIF of three rotating shapes and their readings, tries vs symmetry, window margin, two-point depth vs tilt direction, spiral cover; with –full: a GIF of the MuJoCo blind search, window vs friction, and the rectified wrist and upward views. 10 gates (default, 1.8 s) plus 7 with –full (42 s with figures). Honestly: the peg orientation is read by a fixed upward camera mid-process (the wrist camera alone cannot see the end face). The friction limit is derived for a 45° chamfer, quasi-statics and a weak spring about the axis; for the square at μ ≥ 0.5 MuJoCo is 0.7° wider (shown as a breakdown, not gated). Sturges’s square-peg wedging was not read. The nested count for searching translation and rotation together is an independence approximation and is not gated.

↑ The measurement ―― 線 = 窓 5° を共通にした時の閉形式 E(n)、破線 = 対称を知らない探索の E を n で割ったもの。点 = この装置(窓は形ごとに違う)の閉形式と、一様な誤差の格子で口への線形計画が判定した平均。キー付きは n = 1。 (figure labels are in Japanese; the numbers are the same)

↑ 平行移動も自由にした時の口の中の最良の余裕(線形計画)。

↑ 傾き 3° の二点接触の深さ(厳密、凸包の頂点の線形計画)を内接円の円柱の Whitney の式で割ったもの。

↑ Archimedes のらせん。

↑ 面取りが回して入れる最大の向きの誤差。
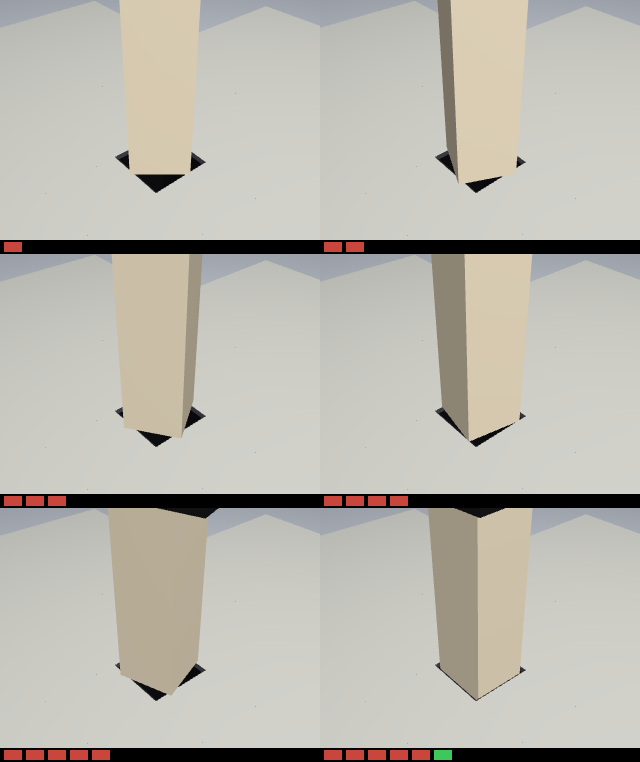
↑ The animation ―― 正方形のペグの盲目の回転探索(MuJoCo、斜め上の固定カメラ)。候補は 90° の 1 周期を 6 等分(刻み 15.0°、面取りの窓 ±8.72°)。下の帯 = 試行(赤 = 面取りか襟で止まった、緑 = 入った)。6 回目で入り、予言も 6 回。
py -3.11 examples/poc_peg_symmetry_search.py
Source: examples/poc_peg_symmetry_search.py
This run produced 8 figures in total - see them all
Ops used (notes): pegsym_scene_mjcf · plane_topview · polygon_coverage_image · polygon_fit_check · polygon_offset · polygon_peg · polygon_two_point_depth · polygon_yaw_read · relative_yaw_from_images · rotation_search_plan · rotation_window · search_expected_tries · spiral_expected_tries · spiral_search_points · symmetry_fold
No.2026.212 —— Registration That Does Not Move by a Single Bit When the Points Are Shuffled — FP64 Reductions by the Ozaki Scheme, with the Error Falling in Steps under a Guaranteed Bound; Slow on the CPU, and GPU Speed Is Left to cuBLAS Emulation
| The same 200,000-point cloud, with only the point order shuffled, is fed to Kabsch. An ordinary FP64 matrix product (DGEMM) moves its low bits with the summation order, so 11 shuffles gave 12 different rotations (largest difference 1.7e-15). The new module ozakimm (6 ops) splits the reduction into exact integer partial products (Ozaki-I = fixed-point slices of 7 bits, Ozaki-II = Chinese remainder theorem) and returns one set of bits regardless of point order or BLAS thread count 1/2/4/8. Each extra slice drops the error by about 2⁻⁷ until it reaches the FP64 level (the reference is the exact product computed with Python integers), and the slice count is chosen from a guaranteed error bound (9 / 11 / 13 slices for φ = 0.5 / 2 / 4). The bound is never violated over 9,216 elements. Scaling the input by a power of two scales the answer exactly, so the defect reported in arXiv 2606.29129 for the old fast mode — the answer breaking under a mere constant factor — is absent. The ICP family (five functions in registration / match3d / gicp) gained reproducible=True: aligning a 20,000-point wavy surface in 5 point orders gives 5 different poses by default for every one of them and a single pose with reproducible=True (difference from the default | ΔR | ≤ 3.3e-15; the whole ICP is 2-5 times slower, so the default stays as it was). Honestly: it is not faster on the CPU (11-60 times slower than DGEMM for square matrices; 0.68 ms → 170 ms for the 3×3 cross-covariance of 200,000 points). To make FP64 fast on a GPU, cuBLAS 13.4 FP64 emulation (opt-in) reached 17.8-23.8 TFLOPS at n = 8192 on one local machine (native 1.67; 13.3 fell back to native for inputs with a wide exponent span). cuBLAS does not guarantee bitwise reproducibility while emulating, so: speed from cuBLAS, reproducibility from here. |

| *↑ Registration That Does Not Move by a Single Bit When the Points Are Shuffled — FP64 Reductions by the Ozaki Scheme, with the Error Falling in Steps under a Guaranteed Bound; Slow on the CPU, and GPU Speed Is Left to cuBLAS Emulation ―― The same 200,000-point cloud, with only the point order shuffled, is fed to Kabsch. An ordinary FP64 matrix product (DGEMM) moves its low bits with the summation order, so 11 shuffles gave 12 different rotations (largest difference 1.7e-15). The new module ozakimm (6 ops) splits the reduction into exact integer partial products (Ozaki-I = fixed-point slices of 7 bits, Ozaki-II = Chinese remainder theorem) and returns one set of bits regardless of point order or BLAS thread count 1/2/4/8. Each extra slice drops the error by about 2⁻⁷ until it reaches the FP64 level (the reference is the exact product computed with Python integers), and the slice count is chosen from a guaranteed error bound (9 / 11 / 13 slices for φ = 0.5 / 2 / 4). The bound is never violated over 9,216 elements. Scaling the input by a power of two scales the answer exactly, so the defect reported in arXiv 2606.29129 for the old fast mode — the answer breaking under a mere constant factor — is absent. The ICP family (five functions in registration / match3d / gicp) gained reproducible=True: aligning a 20,000-point wavy surface in 5 point orders gives 5 different poses by default for every one of them and a single pose with reproducible=True (difference from the default | ΔR | ≤ 3.3e-15; the whole ICP is 2-5 times slower, so the default stays as it was). Honestly: it is not faster on the CPU (11-60 times slower than DGEMM for square matrices; 0.68 ms → 170 ms for the 3×3 cross-covariance of 200,000 points). To make FP64 fast on a GPU, cuBLAS 13.4 FP64 emulation (opt-in) reached 17.8-23.8 TFLOPS at n = 8192 on one local machine (native 1.67; 13.3 fell back to native for inputs with a wide exponent span). cuBLAS does not guarantee bitwise reproducibility while emulating, so: speed from cuBLAS, reproducibility from here.* |

↑ The measurement ―― Ozaki-II は積の回数 = 法の数。φ が広いと同じ法の数では FP64 に届かない(φ=4 で 20 法 4.9e-16)。 (figure labels are in Japanese; the numbers are the same)

↑ 点の順を入れ替えるだけで、普通の FP64 の回転は 12 通りに分かれた(最大の差 1.7e-15)。

↑ 違う結果の数(1 = どの条件でも同じビット)。

↑ 手元の 1 台での測定(2026-10-05)。

↑ 手元の 1 台での測定(2026-10-05)。
py -3.11 examples/poc_reproducible_icp.py
Source: examples/poc_reproducible_icp.py
This run produced 7 figures in total - see them all
Ops used (notes): cross_covariance_reproducible · estimate_normals · fp64_emulation_probe · gicp · icp_point2plane · icp_point2point_3d · kabsch_reproducible · matmul_ozaki · matmul_reproducible · ozaki_error_bound
No.2026.133 —— Where Is the Public Camera Looking — The Orientation of a Fixed Camera Whose Only Published Fact Is Its Position, from the Picture Itself
Public fixed cameras (road, weather, tourism) publish their position but not their orientation, or only a coarse one (a road direction code, an id hash, a manual gizmo); without the orientation a frame cannot be placed on a map, a DEM or a 3-D city. The new geocam family (7 ops, numpy + scipy) recovers the (yaw, pitch, roll) of a camera at a known position from the picture itself, with no learning, from two independent cues that check each other. (1) Skyline: the 360-degree ridge rendered from a DEM at the camera position (dem_skyline, with earth curvature and refraction and the horizon dip as the floor outside the DEM) is matched against the sky/terrain boundary extracted by dynamic programming (skyline_extract, Lie et al. 2005); camera_orientation_from_skyline returns the whole residual curve over yaw and the margin to the runner-up valley. (2) Sun: the apparent sun position is a closed form of time and place (sun_position, NOAA, checked against equinox and solstice values); two or more saturated sun discs picked from time-stamped frames (sun_pixel_position, which refuses clouds and sky bands by their fill ratio) fix the rotation exactly as the SVD solution of Wahba’s problem (camera_orientation_from_sun). On a synthetic camera with a known pose (synthetic DEM, sky, a cloud, a foreground pole, noise, known intrinsics) the skyline route errs by 0.058 / 0.030 / 0.006 deg, the sun route by 0.002 / 0.001 / 0.009 deg (5 frames; the first and last frame alone give a yaw error of 0.001 deg), and the two routes agree to 0.061 deg. Controls: a road-direction prior of the kind public metadata gives is off by 7.5 deg, and on a flat DEM the ridge is the same in every direction so the op returns ambiguous instead of being silently 137 deg wrong. Prior work: Lalonde et al. IJCV 2010 (sun and sky, 3 deg on 22 webcams) and Baatz et al. ECCV 2012 (skylines, the large-scale position-unknown version). Honest breakdown: synthetic only (real data - Fintraffic weather cameras + NLS elevation in Finland, Statens vegvesen + Kartverket DTM10 in Norway - is the next step and raw frames are never committed), the intrinsics K are required (an error in K turns into pitch and roll), skylines need mountains and the sun needs to be in the picture.
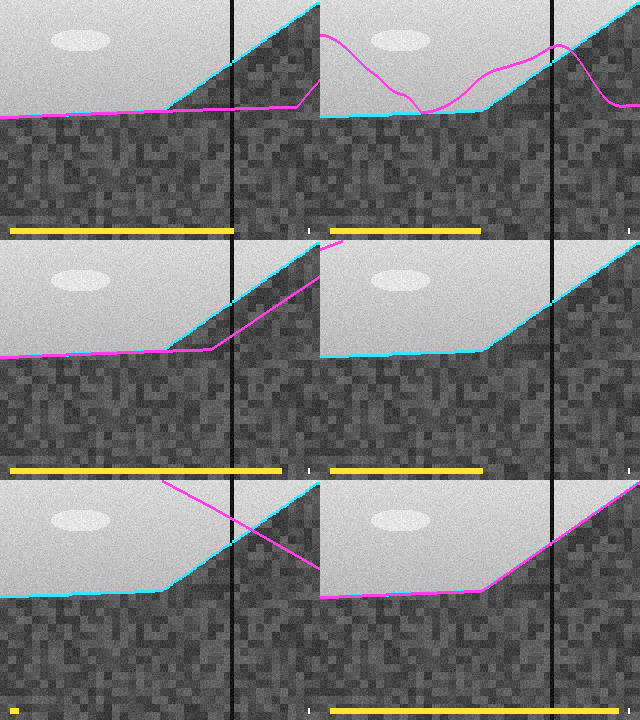
↑ Where Is the Public Camera Looking — The Orientation of a Fixed Camera Whose Only Published Fact Is Its Position, from the Picture Itself ―― Public fixed cameras (road, weather, tourism) publish their position but not their orientation, or only a coarse one (a road direction code, an id hash, a manual gizmo); without the orientation a frame cannot be placed on a map, a DEM or a 3-D city. The new geocam family (7 ops, numpy + scipy) recovers the (yaw, pitch, roll) of a camera at a known position from the picture itself, with no learning, from two independent cues that check each other. (1) Skyline: the 360-degree ridge rendered from a DEM at the camera position (dem_skyline, with earth curvature and refraction and the horizon dip as the floor outside the DEM) is matched against the sky/terrain boundary extracted by dynamic programming (skyline_extract, Lie et al. 2005); camera_orientation_from_skyline returns the whole residual curve over yaw and the margin to the runner-up valley. (2) Sun: the apparent sun position is a closed form of time and place (sun_position, NOAA, checked against equinox and solstice values); two or more saturated sun discs picked from time-stamped frames (sun_pixel_position, which refuses clouds and sky bands by their fill ratio) fix the rotation exactly as the SVD solution of Wahba’s problem (camera_orientation_from_sun). On a synthetic camera with a known pose (synthetic DEM, sky, a cloud, a foreground pole, noise, known intrinsics) the skyline route errs by 0.058 / 0.030 / 0.006 deg, the sun route by 0.002 / 0.001 / 0.009 deg (5 frames; the first and last frame alone give a yaw error of 0.001 deg), and the two routes agree to 0.061 deg. Controls: a road-direction prior of the kind public metadata gives is off by 7.5 deg, and on a flat DEM the ridge is the same in every direction so the op returns ambiguous instead of being silently 137 deg wrong. Prior work: Lalonde et al. IJCV 2010 (sun and sky, 3 deg on 22 webcams) and Baatz et al. ECCV 2012 (skylines, the large-scale position-unknown version). Honest breakdown: synthetic only (real data - Fintraffic weather cameras + NLS elevation in Finland, Statens vegvesen + Kartverket DTM10 in Norway - is the next step and raw frames are never committed), the intrinsics K are required (an error in K turns into pitch and roll), skylines need mountains and the sun needs to be in the picture.
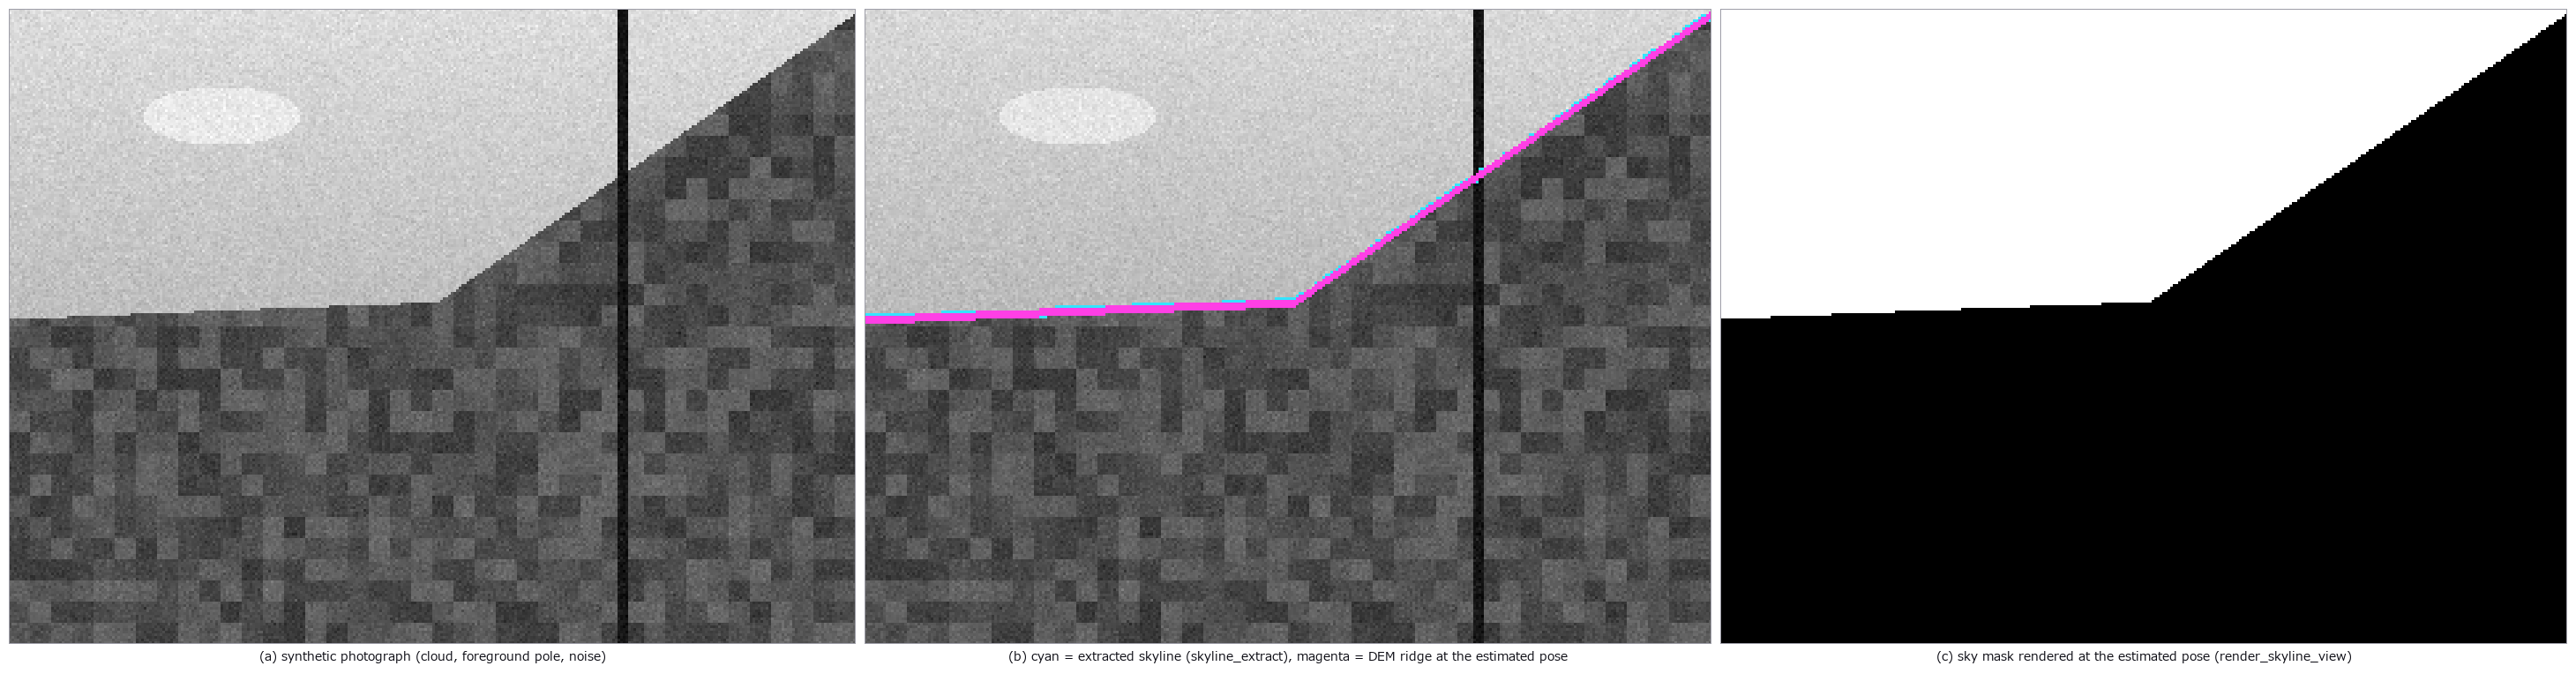
↑ The measurement ―― the DEM ridge drawn at the estimated yaw / pitch / roll lies on the extracted skyline; errors 0.06 / 0.03 / 0.01 deg (figure labels are in Japanese; the numbers are the same)
↑ the op returns the whole residual curve so that the ambiguity is visible: a runner-up valley at 15 deg is 1.28 deg worse; the flat DEM curve is level
↑ the sun’s path over the day where it is above the ridge (yellow, projected with the pose estimated from the sun) and the 5 sun discs picked by sun_pix…
↑ both routes recover the pose to well under a degree and agree with each other; the public-metadata prior is off by ten degrees and the flat-ground cas…
py -3.11 examples/poc_public_camera_heading.py
Source: examples/poc_public_camera_heading.py
This run produced 5 figures in total - see them all
Ops used (notes): camera_orientation_from_skyline · camera_orientation_from_sun · dem_skyline · project · render_skyline_view · skyline_extract · sun_pixel_position · sun_position
No.2026.134 —— Where Is the Public Camera Looking, for Real — Hunting the Sun in 807 Road Cameras, Fixing the Heading from One Sunset and Checking It Against the Road
| The synthetic PoC (poc_public_camera_heading) got away with ‘the sun is a small saturated disc’; real road cameras did not. Probing the 24 hours of 20-21 September from Finland’s 807 Fintraffic weather cameras (CC BY 4.0, no key) at sun elevations of 2-12 degrees, the look-alone gate (sun_pixel_position) called station-name text, signs, white cars and lens droplets the sun (24/24 wrong on the first probe), the sun is not a disc but a bloom whose size depends on exposure and which the station-name band clips, and the cameras look down at the road with sky in the top third only. Two ops were added to geocam: sun_bloom_fit (a Kasa circle fitted to the unclipped rim of the largest saturated blob; the centroid sits 12 px off on average, away from the cut) and camera_orientation_from_sun_candidates (RANSAC over per-frame candidates for the one blob that moves at the sun’s rate in a fixed camera, with road-camera priors | roll | <= 12 deg, pitch -40..0 deg, HFOV 25-120 deg rejecting unphysical hypotheses, the focal length searched at the same time, and no votes from below-horizon times). Over 807 stations x 24 h exactly one sunset could be tracked (E18, Hamina; official metadata says direction UNKNOWN): from 5 frames (15:01-16:01 UTC) yaw 267.9, pitch -4.6, roll 0.9 deg, f 1439 px (HFOV 48 deg), residual 0.34 deg. Independent check: the lane vanishing point (medoid over several daytime frames) turned into a world bearing with the same pose is 272.7 deg against 275.3 deg for the E18 segment in OpenStreetMap - 2.5 deg apart. The weak degrees of freedom are not hidden: under leave-one-out yaw moves 1.3 deg but roll 10 deg and f 2 % (the limit of a one-hour low-elevation arc). On the same frames the look-alone gate said ‘sun’ 22 times: 3 exact, 2 on the sun but off-centre, 17 something else. Raw frames are never committed; only the aggregate (times, circle fits, vanishing point, road bearing) ships. Sources: Fintraffic / Digitraffic (CC BY 4.0), OpenStreetMap (ODbL). |
| *↑ Where Is the Public Camera Looking, for Real — Hunting the Sun in 807 Road Cameras, Fixing the Heading from One Sunset and Checking It Against the Road ―― The synthetic PoC (poc_public_camera_heading) got away with ‘the sun is a small saturated disc’; real road cameras did not. Probing the 24 hours of 20-21 September from Finland’s 807 Fintraffic weather cameras (CC BY 4.0, no key) at sun elevations of 2-12 degrees, the look-alone gate (sun_pixel_position) called station-name text, signs, white cars and lens droplets the sun (24/24 wrong on the first probe), the sun is not a disc but a bloom whose size depends on exposure and which the station-name band clips, and the cameras look down at the road with sky in the top third only. Two ops were added to geocam: sun_bloom_fit (a Kasa circle fitted to the unclipped rim of the largest saturated blob; the centroid sits 12 px off on average, away from the cut) and camera_orientation_from_sun_candidates (RANSAC over per-frame candidates for the one blob that moves at the sun’s rate in a fixed camera, with road-camera priors | roll | <= 12 deg, pitch -40..0 deg, HFOV 25-120 deg rejecting unphysical hypotheses, the focal length searched at the same time, and no votes from below-horizon times). Over 807 stations x 24 h exactly one sunset could be tracked (E18, Hamina; official metadata says direction UNKNOWN): from 5 frames (15:01-16:01 UTC) yaw 267.9, pitch -4.6, roll 0.9 deg, f 1439 px (HFOV 48 deg), residual 0.34 deg. Independent check: the lane vanishing point (medoid over several daytime frames) turned into a world bearing with the same pose is 272.7 deg against 275.3 deg for the E18 segment in OpenStreetMap - 2.5 deg apart. The weak degrees of freedom are not hidden: under leave-one-out yaw moves 1.3 deg but roll 10 deg and f 2 % (the limit of a one-hour low-elevation arc). On the same frames the look-alone gate said ‘sun’ 22 times: 3 exact, 2 on the sun but off-centre, 17 something else. Raw frames are never committed; only the aggregate (times, circle fits, vanishing point, road bearing) ships. Sources: Fintraffic / Digitraffic (CC BY 4.0), OpenStreetMap (ODbL).* |
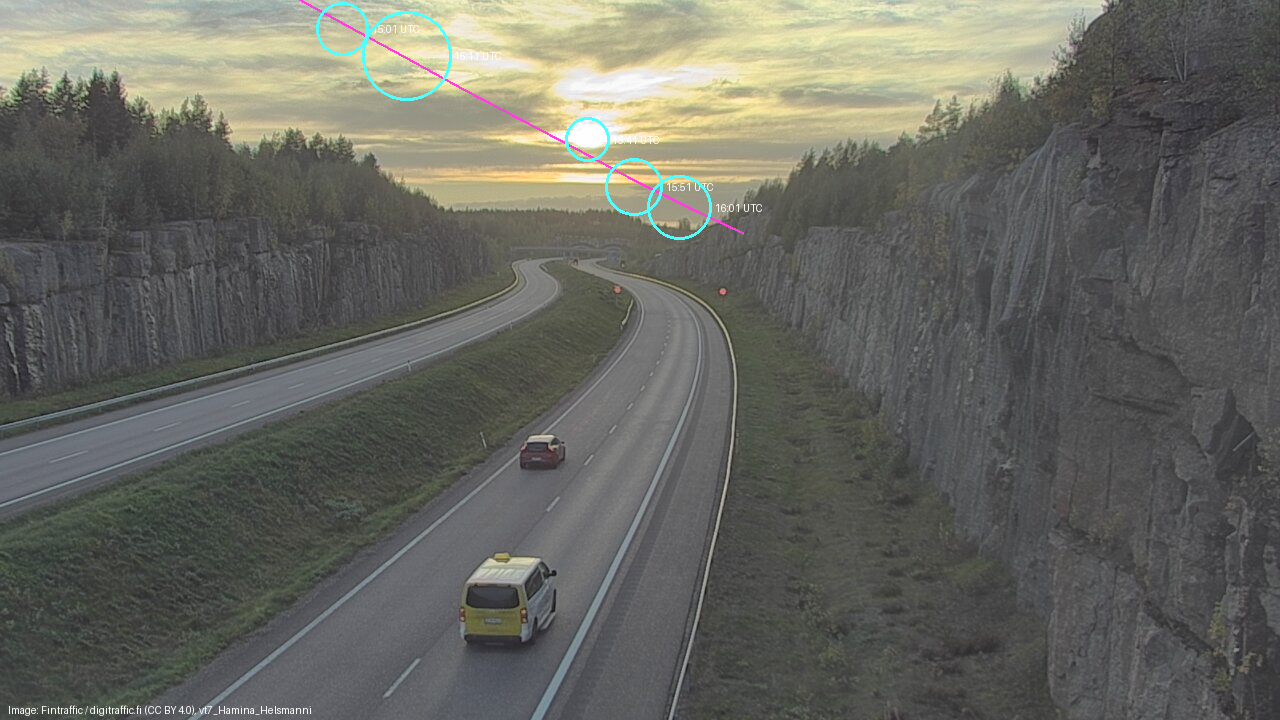
↑ The measurement ―― the sunset seen by C0362200 (E18, Hamina, Finland; metadata says direction UNKNOWN): the sun’s path for the evening drawn from the fitted pose (magenta) and the 5 blooms fitted with a circle (cyan); yaw 267.9, pitch -4.6, roll 0.9, HFOV 48 (figure labels are in Japanese; the numbers are the same)

↑ what the look-alone detector (sun_pixel_position, built for synthetic discs) called the sun in the same camera: 22 picks, 3 exactly the sun, 2 on the…
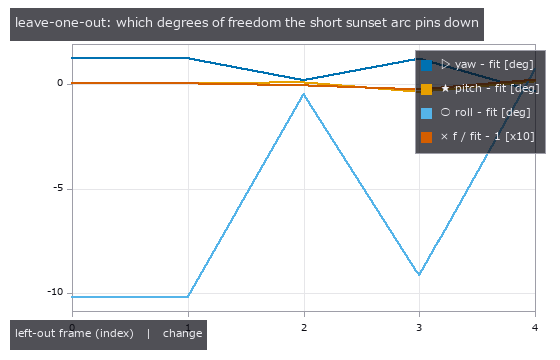
↑ refit with each sun frame removed: yaw barely moves, roll and the focal length are the weak directions of a 1-hour low-elevation arc — this is why the…

↑ for blooms cut by the station-name band the centroid sits 12.4 px (mean) away from the circle fitted to the unclipped rim; the fit uses the circle

↑ one camera out of 807 stations gave a sun track of 4 or more frames on 2026-09-20/21 (2 more had 3 frames and were left out); the vanishing point of i…
py -3.11 examples/poc_public_camera_heading_real.py
Source: examples/poc_public_camera_heading_real.py
This run produced 6 figures in total - see them all
Ops used (notes): bloom · camera_orientation_from_sun_candidates · ellipse · project · sun_position
No.2026.247 —— Calibrating a Thin-Film Model to Real Images — and Giving No Number to What the Data Do Not Determine
Fit the coefficients of a thin-film forward model to real images, and give no number to a coefficient the data do not determine (sim-to-real calibration with the simcal ops, planned and screened with multivar). Model: transfer matrix (filmoptics) x black-body illuminant (spectralrad) x CIE 1931 to sRGB x gain, gamma and vignetting. Planning: seven knobs on an L18 array; Morris screening puts illumination x gain into one combination (sensitivity ratio 1.0000) and a 500 nm film seen at one wavelength fixes only A^1 d^0.93 (optical path n d); for the 98 nm film the interface reflectance dominates and the exponent departs from n d, stated. Core, public measured data (Schwarz et al. 2024, CC BY 4.0): fitting thickness, Cauchy A and B, NA and gain to the 100 % coverage microspectroscopy gives no point estimate (local collinearity gamma > 10) but a 95 % profile-likelihood interval of [94.6, 99.0] nm (width 4.4 nm) that contains the paper’s 98.5 nm reference; the noise comes from a separate measurement (bare silicon) and all six over-fitting gates pass on held-out wavelengths. The normal-incidence model with the table index gives a narrow [93.02, 93.07] nm that misses the reference and is rejected by the absolute chi-square gate (chi2/nu 1.98). On the real micrograph only the colour temperature and the vignetting are determined; thickness, index, dispersion, gain and gamma are combinations - a point versus grooves in the chi-square landscape. Fixing the index gives d = 86.65 nm within 0.2 nm but 12 % low, and the absolute gate (chi2/nu 11.7) and the residual PCA (two components) reject it: the camera’s spectral sensitivities are missing from the model. Synthetic: 40 of 40 seeds within 3 CRLB; the residual PCA finds a dispersion-free model at 500 nm and four angles. Honest limit: a constant index with free A is not rejectable on a 98 nm film (B has only an upper limit). Four probes flip the gates. Nothing learned, 17 gates.

↑ Calibrating a Thin-Film Model to Real Images — and Giving No Number to What the Data Do Not Determine ―― Fit the coefficients of a thin-film forward model to real images, and give no number to a coefficient the data do not determine (sim-to-real calibration with the simcal ops, planned and screened with multivar). Model: transfer matrix (filmoptics) x black-body illuminant (spectralrad) x CIE 1931 to sRGB x gain, gamma and vignetting. Planning: seven knobs on an L18 array; Morris screening puts illumination x gain into one combination (sensitivity ratio 1.0000) and a 500 nm film seen at one wavelength fixes only A^1 d^0.93 (optical path n d); for the 98 nm film the interface reflectance dominates and the exponent departs from n d, stated. Core, public measured data (Schwarz et al. 2024, CC BY 4.0): fitting thickness, Cauchy A and B, NA and gain to the 100 % coverage microspectroscopy gives no point estimate (local collinearity gamma > 10) but a 95 % profile-likelihood interval of [94.6, 99.0] nm (width 4.4 nm) that contains the paper’s 98.5 nm reference; the noise comes from a separate measurement (bare silicon) and all six over-fitting gates pass on held-out wavelengths. The normal-incidence model with the table index gives a narrow [93.02, 93.07] nm that misses the reference and is rejected by the absolute chi-square gate (chi2/nu 1.98). On the real micrograph only the colour temperature and the vignetting are determined; thickness, index, dispersion, gain and gamma are combinations - a point versus grooves in the chi-square landscape. Fixing the index gives d = 86.65 nm within 0.2 nm but 12 % low, and the absolute gate (chi2/nu 11.7) and the residual PCA (two components) reject it: the camera’s spectral sensitivities are missing from the model. Synthetic: 40 of 40 seeds within 3 CRLB; the residual PCA finds a dispersion-free model at 500 nm and four angles. Honest limit: a constant index with free A is not rejectable on a 98 nm film (B has only an upper limit). Four probes flip the gates. Nothing learned, 17 gates.

↑ The measurement ―― Si 上の SiO₂(基準 98.5 nm)の実測の反射率に、5 本のつまみの模型(実線)と直入射・材料表の n の模型(破線)を合わせた。どちらも見た目はよく重なる —— 違いは残差を雑音の床 σ = 0.00054(裸の Si の別の測定から)で割ると見える(次の図)。 (figure labels are in Japanese; the numbers are the same)
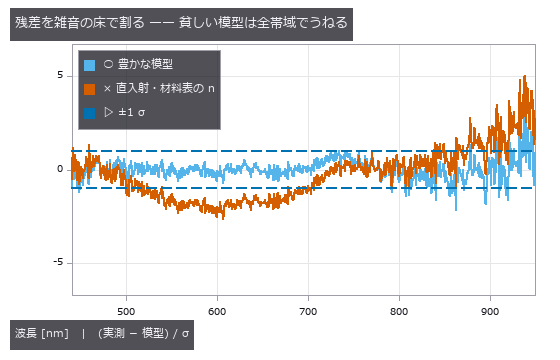
↑ 豊かな模型の χ²/ν は 0.29、直入射・材料表の n は 1.98(絶対の χ² の門で p < 1e-3 → 拒否)。

↑ 膜厚を固定して A・B・NA・利得を合わせ直したときの χ² の増え方(プロファイル尤度)。

↑ 実測と同じ波長・同じ雑音 σ で、膜厚 98.5 nm・利得 1 を作って合わせた。

↑ 材料表の n を固定し、膜厚・色温度・利得・ガンマ・周辺減光を区画(40 px 角)の平均に合わせた: d = 86.6 nm(基準 98.5 nm と -12 %)、T = 6224 K、γ = 2.51。
py -3.11 examples/poc_simcal_thin_film.py
Source: examples/poc_simcal_thin_film.py
This run produced 9 figures in total - see them all
Ops used (notes): axes_frame · axes_transform · blackbody_spectrum · color_bar · doe_decode · doe_orthogonal_array · gamma · gaussian · multilayer_reflectance · mv_confounding · mv_pca · nice_ticks · plot_series · simcal_discrepancy · simcal_fit · simcal_identifiability · simcal_model · simcal_observe · simcal_report · simcal_screen · simcal_simulate · simcal_uncertainty · simcal_validate · spectrum_to_srgb … (+2)
The Colour and Separation Wing — There Is No Method That Works, Only Conditions Under Which One Does
Estimating the illuminant to restore colour, peeling the layers of a painting with multiple wavelengths, separating specular reflection with polarisation. The 13 exhibits here synthesise linear radiance from known spectral reflectances, known illuminants and the Fresnel equations, then compare the separation against that truth.
The conclusion in every case was that the failure axes are orthogonal. Max-RGB is best when a white patch is present and gets 8x worse when the single brightest patch is removed; grey-world shrugs off saturation but loses once chromatic content exceeds 20 %; under a reference illuminant every method loses to doing nothing; adding bands does not win, adding near-infrared does.
The shared warning is to convert to linear radiance before calling anything. Pass sRGB-gamma values and no exception is raised; the separation simply degrades in silence. Failure without an exception is the most common pattern in the whole museum.
No.2026.032 —— Peeling Layers With Many Wavelengths — Underdrawing, Ground, Glaze and Fading, Truth in Hand
A spectral cube of ground, underdrawing, glaze and fading stacked in layers, then unmixed. Splitting the visible range into 16 bands does no better than RGB (recall 0.118 versus 0.119); what won was adding near-infrared. The same detector scores an AUC of 1.000 on ultramarine, 0.630 on azurite and 0.013 on losses — averaged, all of that vanishes. Restoring the unfaded colour barely beat the null, ΔE00 16.79 → 16.46.
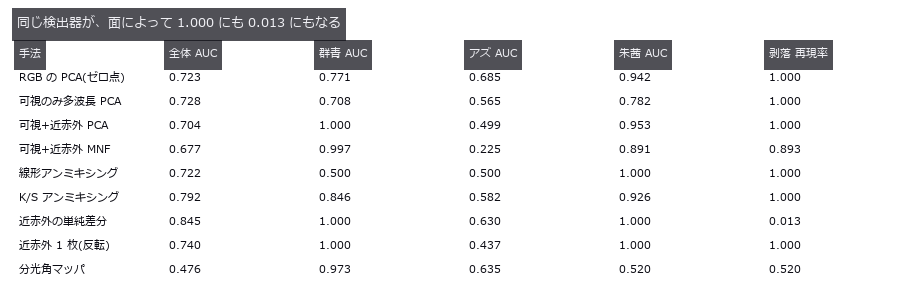
↑ Peeling Layers With Many Wavelengths — Underdrawing, Ground, Glaze and Fading, Truth in Hand ―― A spectral cube of ground, underdrawing, glaze and fading stacked in layers, then unmixed. Splitting the visible range into 16 bands does no better than RGB (recall 0.118 versus 0.119); what won was adding near-infrared. The same detector scores an AUC of 1.000 on ultramarine, 0.630 on azurite and 0.013 on losses — averaged, all of that vanishes. Restoring the unfaded colour barely beat the null, ΔE00 16.79 → 16.46.
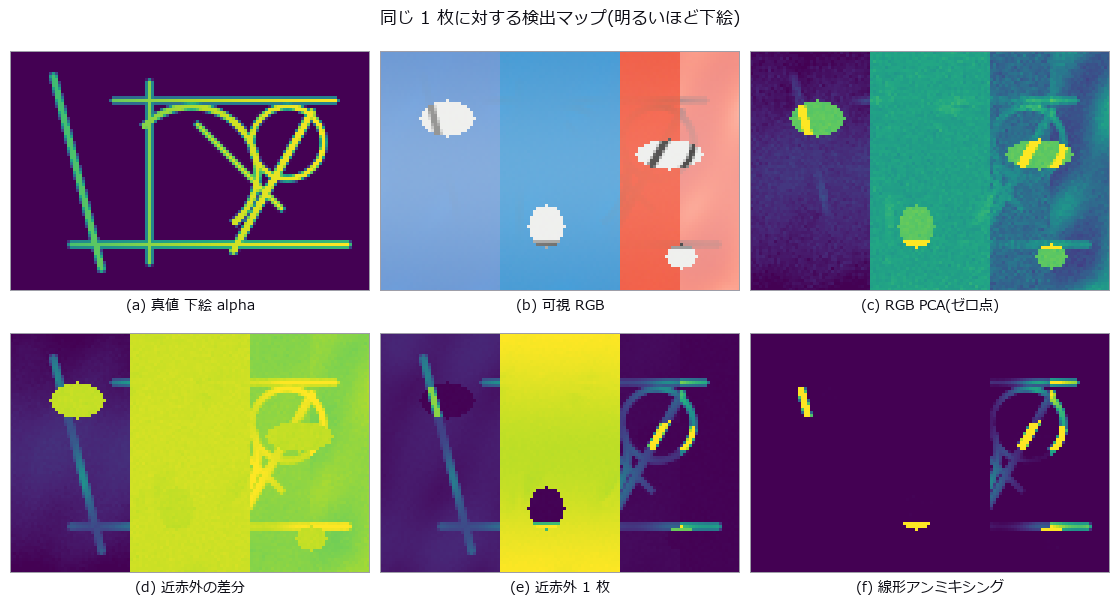
↑ The measurement ―― 近赤外の差分は剥落部(楕円)で消え、近赤外 1 枚は面ごとに水準が違う。塗り分けは 1–99 分位でクリップした表示のみ。 (figure labels are in Japanese; the numbers are the same)
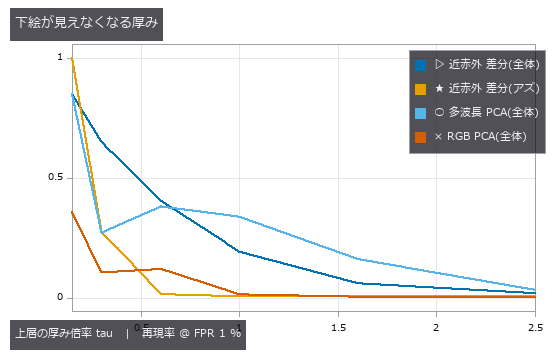
↑ 半分を割るのは tau 0.30–0.60 のあいだ。

↑ ゼロ点の線より下に来た復元が 1 本も無い。
py -3.11 examples/poc_pigment_unmixing.py
Source: examples/poc_pigment_unmixing.py
This run produced 4 figures in total - see them all
Ops used (notes): delta_e_map · linear_to_srgb · spectrum_to_srgb · threshold
No.2026.107 —— Separating a Real Immunostain by Colour — The Watchdog Was Blind to Exactly the Error It Should Catch
Colour deconvolution of a real immunostain (haematoxylin plus DAB). On synthetic data it separates perfectly — recompose one stain at unit concentration, solve again, and recovery is 1.0000 with 0.0000 crosstalk — so anyone looking only at synthesis concludes the problem is solved. On the real slide the haematoxylin concentration runs down to -4.446 and 11.51 % of pixels are negative, which is physically impossible: a negative concentration means the dye emitted light. Rotating the stain vectors within their plane by plus or minus twenty degrees moves the haematoxylin median from 0.0471 to 0.1348, a factor of 2.86, and DAB from 0.3590 to 0.1836 — while the residual channel, the quantity everyone reads as goodness of fit, stays at 0.0345 with a total spread of 3.3e-16. The geometry says why: the plane the two stains span is unchanged by a rotation inside it, so the component orthogonal to that plane cannot move. The negative fraction of the rotated stain is equally blind, fixed at 11.51 %, because its dual vector changes length but not direction. Only the partner moves, from 0.00 % at minus twenty degrees to 30.38 % at plus twenty: the watchdog has to watch the other stain, not itself, and being monotone it bounds the error from one side only. The round trip through recompose closes to 1e-06, which refutes none of this.
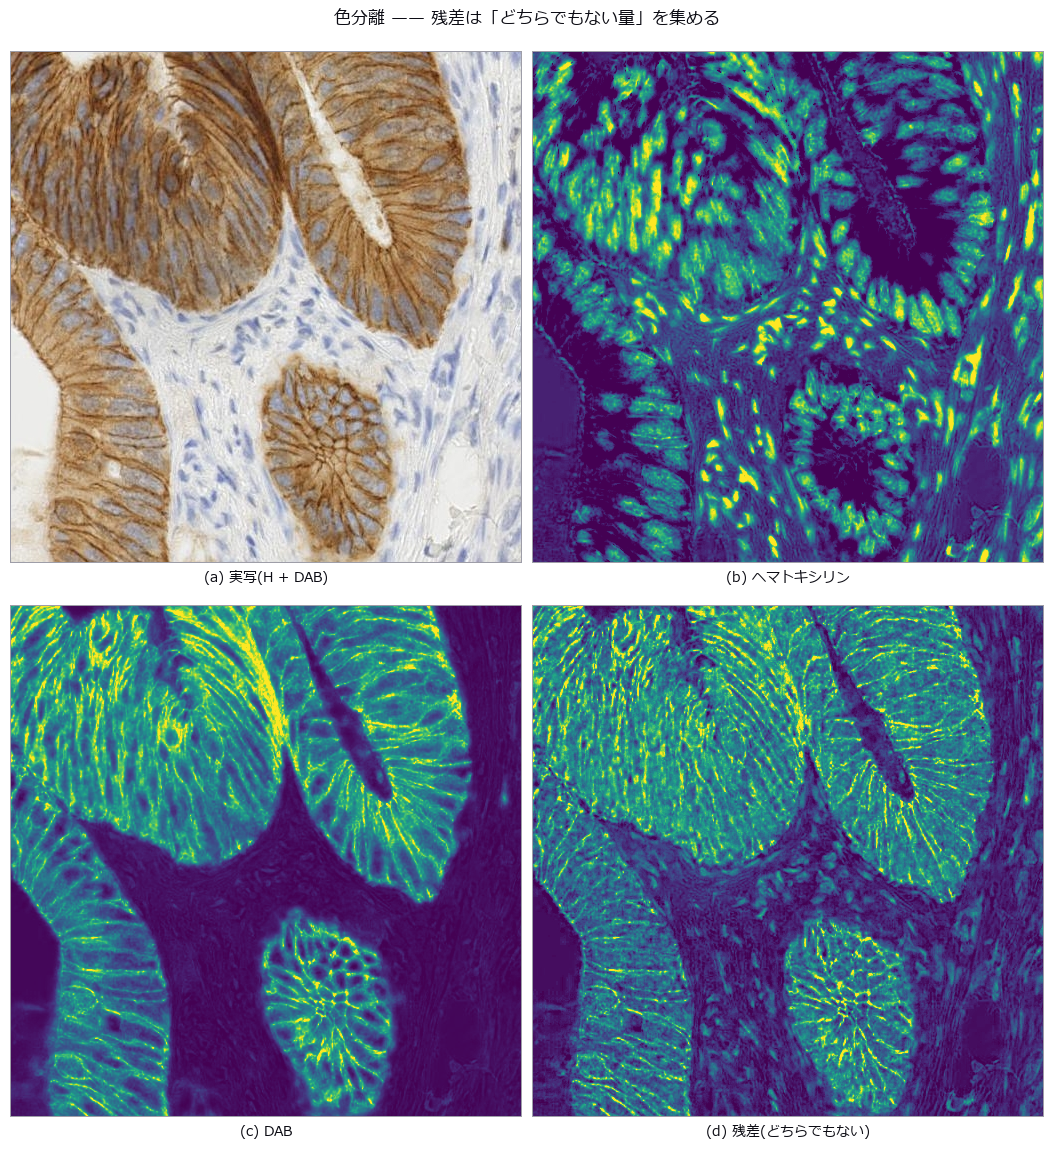
↑ Separating a Real Immunostain by Colour — The Watchdog Was Blind to Exactly the Error It Should Catch ―― Colour deconvolution of a real immunostain (haematoxylin plus DAB). On synthetic data it separates perfectly — recompose one stain at unit concentration, solve again, and recovery is 1.0000 with 0.0000 crosstalk — so anyone looking only at synthesis concludes the problem is solved. On the real slide the haematoxylin concentration runs down to -4.446 and 11.51 % of pixels are negative, which is physically impossible: a negative concentration means the dye emitted light. Rotating the stain vectors within their plane by plus or minus twenty degrees moves the haematoxylin median from 0.0471 to 0.1348, a factor of 2.86, and DAB from 0.3590 to 0.1836 — while the residual channel, the quantity everyone reads as goodness of fit, stays at 0.0345 with a total spread of 3.3e-16. The geometry says why: the plane the two stains span is unchanged by a rotation inside it, so the component orthogonal to that plane cannot move. The negative fraction of the rotated stain is equally blind, fixed at 11.51 %, because its dual vector changes length but not direction. Only the partner moves, from 0.00 % at minus twenty degrees to 30.38 % at plus twenty: the watchdog has to watch the other stain, not itself, and being monotone it bounds the error from one side only. The round trip through recompose closes to 1e-06, which refutes none of this.
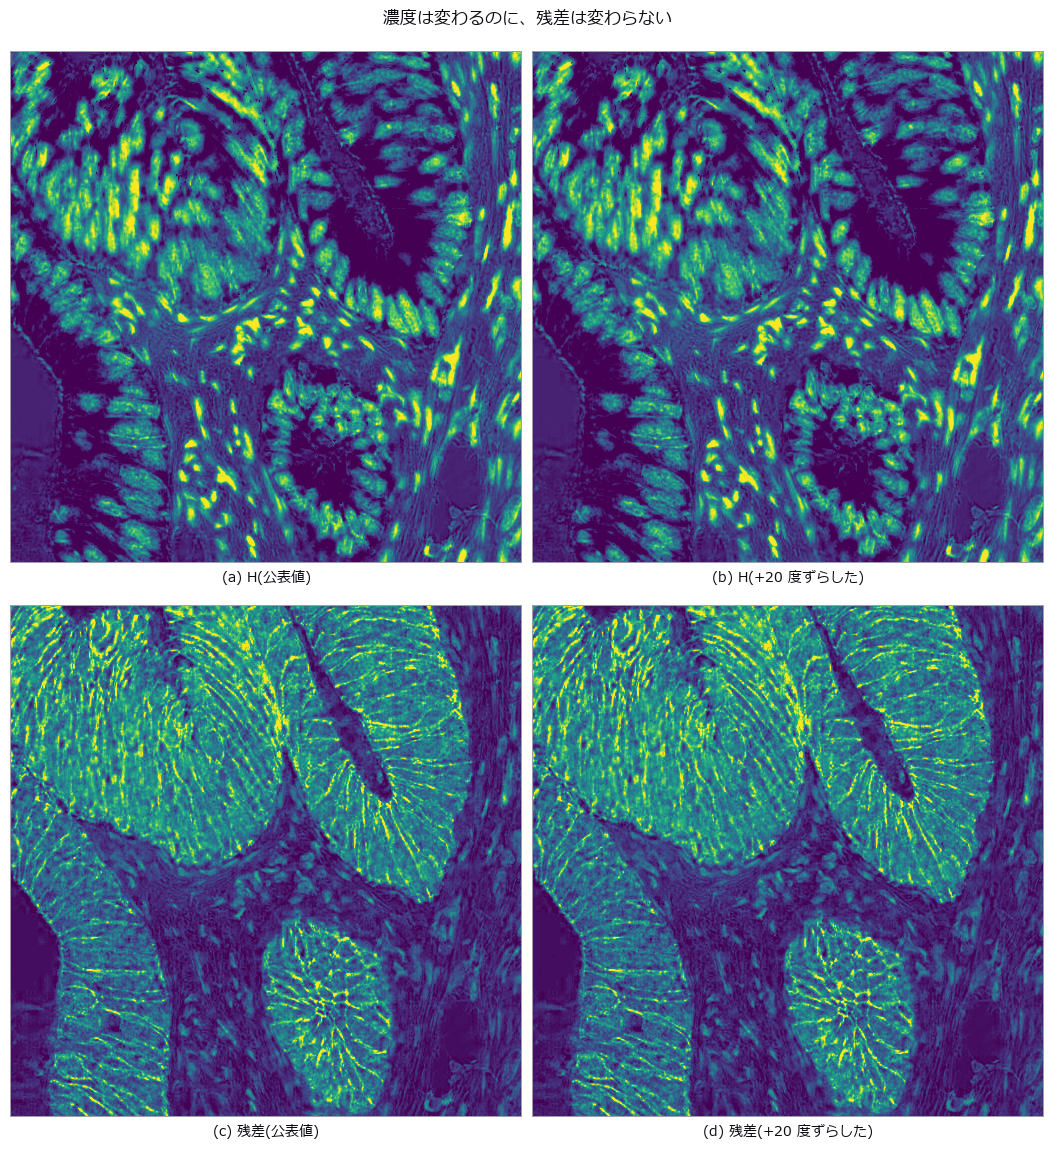
↑ The measurement ―― H の中央値は 0.0656 -> 0.1348。残差の絶対中央値は 0.0345 のまま。 (figure labels are in Japanese; the numbers are the same)
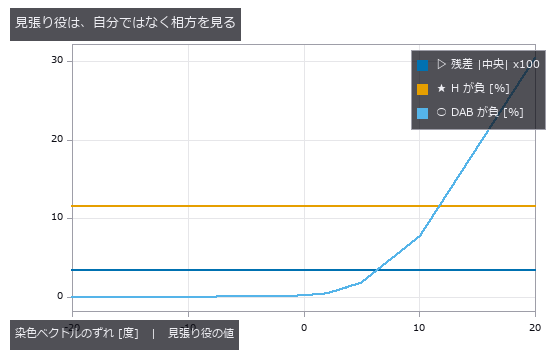
↑ 残差と自分の負率は平坦。
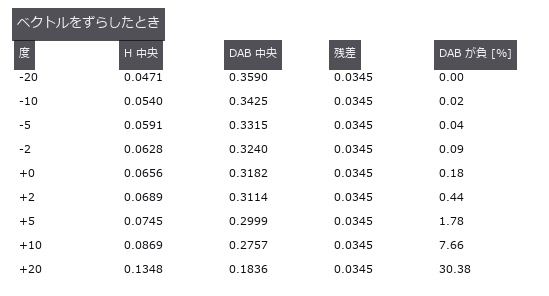
↑ 濃度は 2.9 倍動くのに残差は 4 桁目まで同じ。
py -3.11 examples/poc_real_stain_unmix.py
Source: examples/poc_real_stain_unmix.py
This run produced 4 figures in total - see them all
No.2026.051 —— Colour Constancy (White Balance) — No Method Works, Only Conditions Do
Linear RGB synthesised from 24 known spectral reflectances and known illuminants, with illuminant estimation scored by recovery angular error. Max-RGB is best at a median of 1.06 degrees over 11 illuminants, but removing the single brightest patch takes it to 8.45 degrees, and tripling exposure to saturate 43 % of pixels takes it to 13.61 degrees, identical to doing nothing. Even a diagonal correction with the true illuminant leaves a mean ΔE00 of 5.07 at 2500 K.
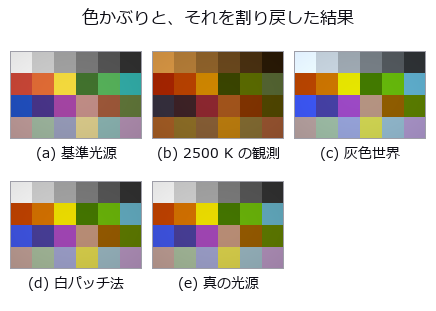
↑ Colour Constancy (White Balance) — No Method Works, Only Conditions Do ―― Linear RGB synthesised from 24 known spectral reflectances and known illuminants, with illuminant estimation scored by recovery angular error. Max-RGB is best at a median of 1.06 degrees over 11 illuminants, but removing the single brightest patch takes it to 8.45 degrees, and tripling exposure to saturate 43 % of pixels takes it to 13.61 degrees, identical to doing nothing. Even a diagonal correction with the true illuminant leaves a mean ΔE00 of 5.07 at 2500 K.
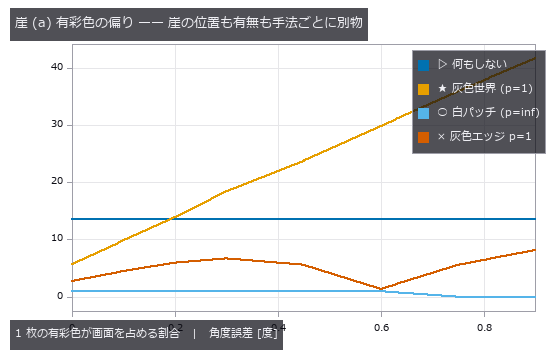
↑ The measurement ―― 灰色世界はゼロ点(何もしない)の線を 0.1〜0.2 の間で上抜けする = そこから先は回すだけ損。白パッチ法には崖が無い。 (figure labels are in Japanese; the numbers are the same)
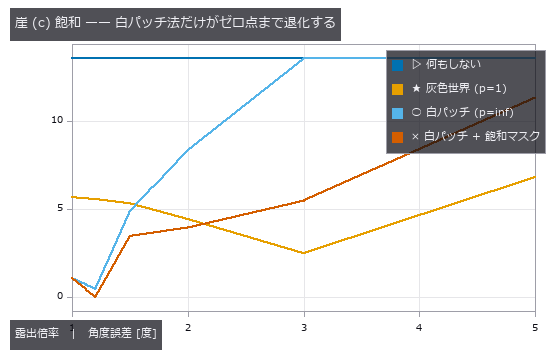
↑ 露出 3 以上で白パッチ法の線が「何もしない」に重なる(max が (1,1,1) に張り付く)。
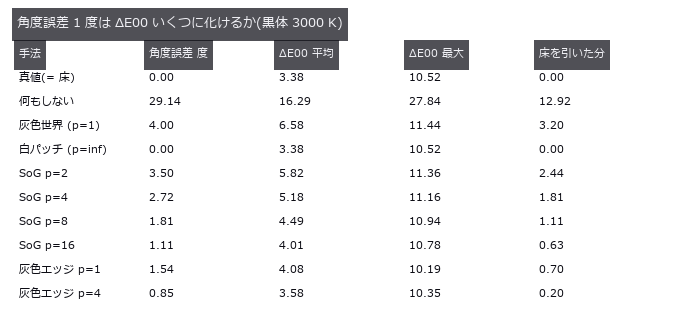
↑ 最右列が推定誤差の実費。
py -3.11 examples/poc_white_balance.py
Source: examples/poc_white_balance.py
This run produced 4 figures in total - see them all
Ops used (notes): delta_e_map · gauss_filter · illuminant_from_dichromatic_planes · laplace · linear_to_srgb · mean_image · prewitt_amp · roberts · sobel_amp · spectrum_to_srgb
No.2026.229 —— A Material Optical-Property Library — 86 Glasses, Crystals, Semiconductors, Metals, Liquids and Plastics in One Table, Scored on Catalogue Values and a Second Implementation
So that the observing optics (lenses, windows, mirrors, films) and the observed object (wafer, mould, solder) can read the same material table, 86 glasses, crystals, semiconductors, metals, liquids and plastics are put into one record type. Sixteen new ops (materials, category matprop of opsoptics): material_table / material_record, material_optical_constants (n, k, α, ε and normal reflectance at one wavelength, with the source), material_dispersion / material_extinction / material_absorption / material_transmittance / material_reflectance (all as pairs (λ nm, value), the same shape as source and QE curves), abbe_number / glass_map, thermo_optic_coefficient (catalogue formula A), plate_focus_shift (focus shift and longitudinal spherical aberration of a plane-parallel plate), silicon_free_carrier_absorption (Schroder 1978), material_from_sellmeier / material_from_curves and read_glass_catalog_agf (the user’s own .agf, all 13 dispersion formulas of that format). The numbers are the primary literature of the refractiveindex.info database (CC0) only; vendor catalogues are not bundled. The n_d / V_d of all 46 glasses agree with the catalogue values to 4e-6 / 0.005, and the second implementation optiland 0.6.3 agrees at 23 points to 5e-10. Silicon (Green 2008) reproduces the three-decade drop k(1.0 µm) 5.09e-4 to k(1.2 µm) 2.1e-7, so a 775 µm wafer transmits 0.3 % at 1.0 µm and 52 % at 1.2 µm (closed form to 1e-9). Silver reflects 0.982 at 500 nm, aluminium dips to 0.866 at 820 nm, gold rises from 0.475 at 500 nm to 0.971 at 700 nm, and the colours come from the colour-matching functions, not from paint. Polycarbonate disperses 2.3 times more than BK7-class glass, which has dn/dT 1.62e-6 /K at the e line. Step 2 makes the lens (raytrace), mirror (glassmirror) and scene (optscene.scene_material) ops read the same table: lenses of other makers’ glasses and plastics match the thick-lens closed form at the F, d and C lines to 1e-14 mm, and axial colour follows 1/V_d within 3 % for five materials; the 20 Sellmeier sets raytrace had copied by hand are the same curves to 4e-16. Finding: the first table used REELS-derived data for W and Pt, with 550 nm reflectances of 0.84 / 0.93 against 0.50 / 0.64-0.73 from other measurements; W now uses Weaver, Pt Tselin 2024, and a gate checks against an independent dataset. Nothing learned, nothing calibrated, 46 gates.
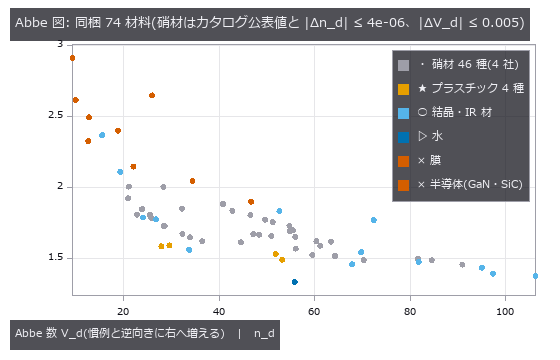
↑ A Material Optical-Property Library — 86 Glasses, Crystals, Semiconductors, Metals, Liquids and Plastics in One Table, Scored on Catalogue Values and a Second Implementation ―― So that the observing optics (lenses, windows, mirrors, films) and the observed object (wafer, mould, solder) can read the same material table, 86 glasses, crystals, semiconductors, metals, liquids and plastics are put into one record type. Sixteen new ops (materials, category matprop of opsoptics): material_table / material_record, material_optical_constants (n, k, α, ε and normal reflectance at one wavelength, with the source), material_dispersion / material_extinction / material_absorption / material_transmittance / material_reflectance (all as pairs (λ nm, value), the same shape as source and QE curves), abbe_number / glass_map, thermo_optic_coefficient (catalogue formula A), plate_focus_shift (focus shift and longitudinal spherical aberration of a plane-parallel plate), silicon_free_carrier_absorption (Schroder 1978), material_from_sellmeier / material_from_curves and read_glass_catalog_agf (the user’s own .agf, all 13 dispersion formulas of that format). The numbers are the primary literature of the refractiveindex.info database (CC0) only; vendor catalogues are not bundled. The n_d / V_d of all 46 glasses agree with the catalogue values to 4e-6 / 0.005, and the second implementation optiland 0.6.3 agrees at 23 points to 5e-10. Silicon (Green 2008) reproduces the three-decade drop k(1.0 µm) 5.09e-4 to k(1.2 µm) 2.1e-7, so a 775 µm wafer transmits 0.3 % at 1.0 µm and 52 % at 1.2 µm (closed form to 1e-9). Silver reflects 0.982 at 500 nm, aluminium dips to 0.866 at 820 nm, gold rises from 0.475 at 500 nm to 0.971 at 700 nm, and the colours come from the colour-matching functions, not from paint. Polycarbonate disperses 2.3 times more than BK7-class glass, which has dn/dT 1.62e-6 /K at the e line. Step 2 makes the lens (raytrace), mirror (glassmirror) and scene (optscene.scene_material) ops read the same table: lenses of other makers’ glasses and plastics match the thick-lens closed form at the F, d and C lines to 1e-14 mm, and axial colour follows 1/V_d within 3 % for five materials; the 20 Sellmeier sets raytrace had copied by hand are the same curves to 4e-16. Finding: the first table used REELS-derived data for W and Pt, with 550 nm reflectances of 0.84 / 0.93 against 0.50 / 0.64-0.73 from other measurements; W now uses Weaver, Pt Tselin 2024, and a gate checks against an independent dataset. Nothing learned, nothing calibrated, 46 gates.

↑ The measurement ―― 4 つの公開カタログ(記号 A〜D)の Sellmeier 式とべき級数の分散式を同じレコード型で評価した。硝材コードは n_d − 1 の小数 3 桁と V_d × 10(係数の出どころは公開の硝材カタログ値)。 (figure labels are in Japanese; the numbers are the same)
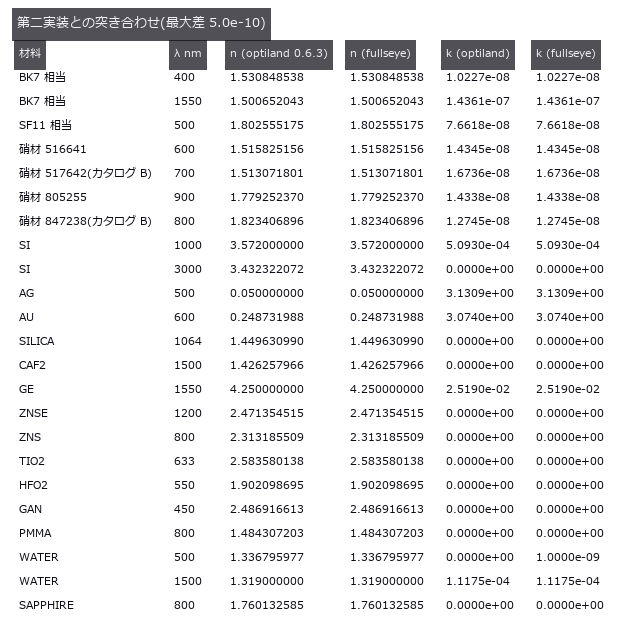
↑ 同じ一次文献を optiland(MIT)が別のコードで評価した値。
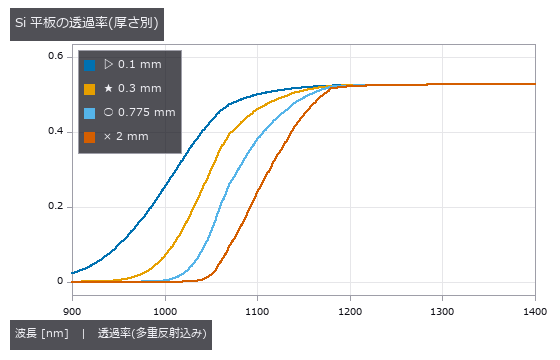
↑ 吸収端の上は厚さに関わらず 0、下は (1−R)²/(1−R²) ≈ 0.53 に漸近(n ≈ 3.5 の Fresnel 損失)。

↑ n,k → 分光反射率 → CIE 等色関数 → sRGB。

↑ R = ±50 mm・厚さ 4 mm の両凸レンズ。
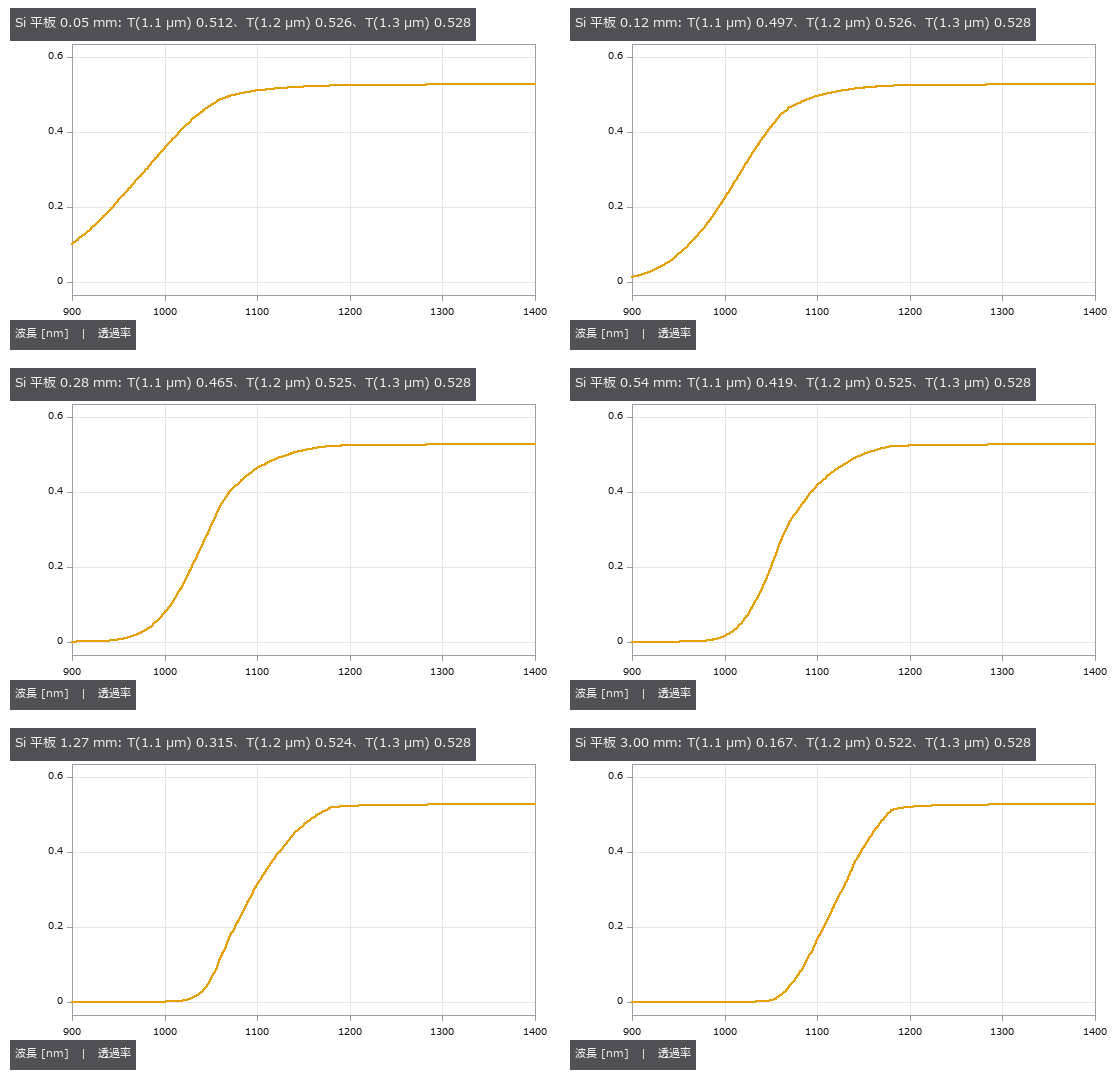
↑ The animation ―― 厚さ 0.05 → 3 mm: 吸収端が長波長側へ押され、1.1 µm の肩が消えていく。薄いダイなら 1.0 µm 台でも透け、厚いウェハは 1.2 µm 以上。
py -3.11 examples/poc_material_optical_library.py
Source: examples/poc_material_optical_library.py
This run produced 17 figures in total - see them all
Ops used (notes): abbe_number · acoustic_impedance_mismatch · chromatic_shift · fresnel_conductor · glass · glass_catalog · glass_map · lens_system · material_absorption · material_acoustic · material_dispersion · material_extinction · material_from_curves · material_from_sellmeier · material_optical_constants · material_record · material_reflectance · material_table · material_transmittance · metal_mirror_rgb · metal_optical_constants · paraxial_trace · plate_focus_shift · read_glass_catalog_agf … (+7)
No.2026.230 —— Near-Infrared Inspection Through a Silicon Wafer — Choosing the LED Wavelength from the Source × Wafer × Sensor Integral
The back side of a silicon die is inspected with near-infrared light, where silicon is transparent; but those wavelengths are also where a silicon sensor stops responding, so the same absorption edge is a window for the object and a wall for the sensor. One Si record of the material table (Green 2008) is used for both the wafer transmittance and the photodiode QE. Nine new ops (spectralrad, category spectral of opsoptics), all returning pairs (λ nm, value) like the material curves: blackbody, CIE illuminant A, LED, band-pass, Si photodiode QE, energy-to-photon conversion, curve product, integral and summary. CIE A matches its table to 1.6e-6, the blackbody obeys Wien and Stefan–Boltzmann, and the QE matches its closed form to 4e-19. The best LED peak moves to longer wavelengths as the wafer thickens (50 µm: 935 nm, 775 µm: 1065 nm). The usual 1050 nm LED is within 5 % of the best for a thick wafer but yields 3.4 times fewer electrons through a 50 µm die; 1200 nm, where the wafer is most transparent, gives 28 times fewer with a silicon sensor. A deeper collecting sensor (3 to 50 µm) gives 16 times more signal without moving the optimum, which the wafer sets. A CNR of 20 through 775 µm needs 1.2e6 photons per open pixel, and the CNR measured in the images matches e/√(e + read²) within 10 %. Lowering the focus mechanically by the wafer thickness misses by t(1 − 1/n) = 557 µm (W20 = 2.6 waves, diffraction PSF) and widens edges eightfold. Chapter 6 (2026-10-15) puts the same wafer and back-side wiring into a 3-D scene and images it with rays through optscene’s wavelength integral (the LED spectrum split into 15 wavelengths, silicon n and k from the material table, a telecentric lens, the silicon sensor’s QE). The open pixels match an independently written integral ∫LED·λ·(1 − R)²e^{−αt}·QE to 0.3 % (2.8 % at 1200 nm), the wafer is opaque at 850 nm (5e-9), and the wiring shadows fall on exactly the pixels the geometry predicts. Nothing learned, nothing calibrated, 26 gates.
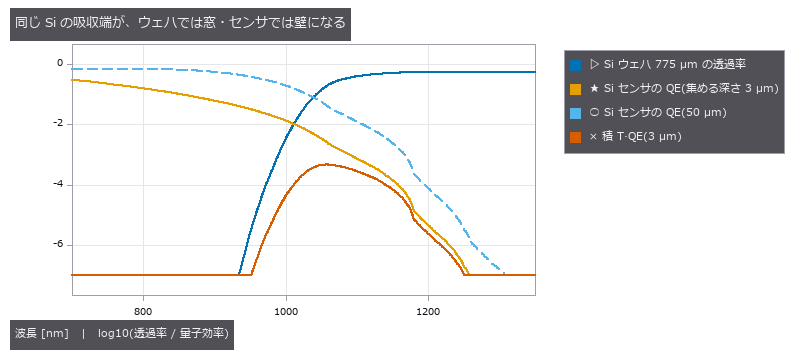
↑ Near-Infrared Inspection Through a Silicon Wafer — Choosing the LED Wavelength from the Source × Wafer × Sensor Integral ―― The back side of a silicon die is inspected with near-infrared light, where silicon is transparent; but those wavelengths are also where a silicon sensor stops responding, so the same absorption edge is a window for the object and a wall for the sensor. One Si record of the material table (Green 2008) is used for both the wafer transmittance and the photodiode QE. Nine new ops (spectralrad, category spectral of opsoptics), all returning pairs (λ nm, value) like the material curves: blackbody, CIE illuminant A, LED, band-pass, Si photodiode QE, energy-to-photon conversion, curve product, integral and summary. CIE A matches its table to 1.6e-6, the blackbody obeys Wien and Stefan–Boltzmann, and the QE matches its closed form to 4e-19. The best LED peak moves to longer wavelengths as the wafer thickens (50 µm: 935 nm, 775 µm: 1065 nm). The usual 1050 nm LED is within 5 % of the best for a thick wafer but yields 3.4 times fewer electrons through a 50 µm die; 1200 nm, where the wafer is most transparent, gives 28 times fewer with a silicon sensor. A deeper collecting sensor (3 to 50 µm) gives 16 times more signal without moving the optimum, which the wafer sets. A CNR of 20 through 775 µm needs 1.2e6 photons per open pixel, and the CNR measured in the images matches e/√(e + read²) within 10 %. Lowering the focus mechanically by the wafer thickness misses by t(1 − 1/n) = 557 µm (W20 = 2.6 waves, diffraction PSF) and widens edges eightfold. Chapter 6 (2026-10-15) puts the same wafer and back-side wiring into a 3-D scene and images it with rays through optscene’s wavelength integral (the LED spectrum split into 15 wavelengths, silicon n and k from the material table, a telecentric lens, the silicon sensor’s QE). The open pixels match an independently written integral ∫LED·λ·(1 − R)²e^{−αt}·QE to 0.3 % (2.8 % at 1200 nm), the wafer is opaque at 850 nm (5e-9), and the wiring shadows fall on exactly the pixels the geometry predicts. Nothing learned, nothing calibrated, 26 gates.

↑ The measurement ―― 最良のピーク: 50 µm → 935 nm、150 µm → 1000 nm、300 µm → 1030 nm、775 µm → 1065 nm。薄いダイは吸収端の手前の 1.0 µm 台でも透け、センサが感じる短い側が勝つ。厚いウェハは吸収端の肩まで押し出される。 (figure labels are in Japanese; the numbers are the same)

↑ 775 µm の Si ウェハの裏の配線を、同じ光子数(開口 1 画素に 1.2e+06)の 3 つの LED で撮った。

↑ 左: ウェハの厚さだけ機械的に下げた焦点(像は 557 µm ずれ、W20 = 2.6 波長、回折の PSF で計算)。

↑ 同じ 775 µm のウェハと裏の配線を 3-D のシーンに置き、光線で撮った(optscene の波長積分、テレセンのレンズ、Si センサ、第 4 章と同じ光子数)。
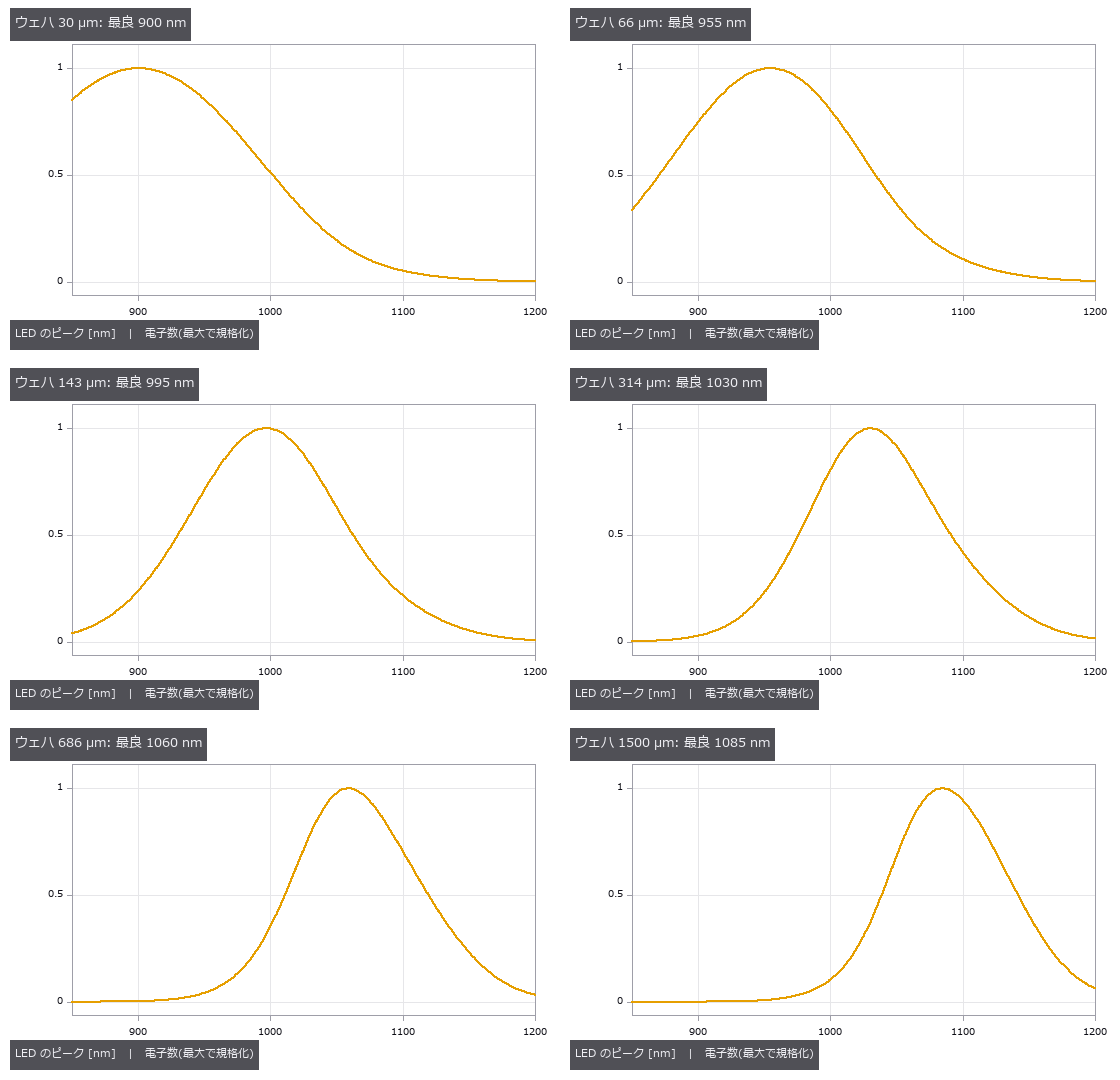
↑ The animation ―― ウェハを 30 µm から 1.5 mm まで厚くすると、最良の LED が長波長へ滑っていく。
py -3.11 examples/poc_nir_silicon_transmission.py
Source: examples/poc_nir_silicon_transmission.py
This run produced 6 figures in total - see them all
Ops used (notes): bandpass_spectrum · blackbody_spectrum · camera_rays · cie_illuminant_a · defocus_from_shift · energy_to_photons · gaussian · layout_capture · led_spectrum · lens_spec · light_spec · material_optical_constants · material_transmittance · plate_focus_shift · pupil_blur · render_optscene · scene_box · scene_material · sensor_spec · silicon_photodiode_qe · spectral_integral · spectral_integral_table · spectral_product · spectral_stats … (+2)
No.2026.231 —— Optical Fibres and Light Guides — From the Material Table’s Fused Silica to Modes, Dispersion, Mode Field and Illumination Efficiency
Inspection light travels in light guides (fibre bundles) and interferometric or spectroscopic light in single-mode fibre; both are set by the dispersion of the glass (the material table) and the guiding equations. Seven new ops (fiberoptics, category fiber of opsoptics): group index, material dispersion, numerical aperture, V number, LP_lm modes from the weakly guiding characteristic equation, the LP01 mode field diameter and light-guide efficiency. Fused silica has group index 1.4626 at 1.55 µm, its material-dispersion zero at 1272.8 nm and D = 21.9 ps/(nm km) at 1.55 µm, all within the published ranges. The mode count switches from 2 to 6 within 0.001 of the Bessel zero 2.4048, reaches 456 at V = 30 against V²/2 = 450, and the LP01 b(V) agrees with the Rudolph-Neumann fit to 0.24 %. LP02 is bound only exponentially weakly just above its cutoff and becomes resolvable in floating point about 0.05 above it, a limit now written into the operator. The mode field diameter agrees with Marcuse’s 1977 fit to 0.8 %, while the second-moment definition is 11 % larger at V = 1.2, so an MFD means nothing without its definition. A core radius of 4.1 µm and NA 0.12 give a cutoff of 1285 nm and an MFD of 9.06 µm at 1310 nm, inside the ITU-T G.652 range of 8.6 to 9.5 µm. A Lambertian LED fills a bundle of smaller NA as (NA_bundle/NA_source)², and the chain LED, 2 m light guide, 775 µm silicon wafer and silicon sensor yields 2.2e-4 electrons per photon. Nothing learned, nothing calibrated, 17 gates.

↑ Optical Fibres and Light Guides — From the Material Table’s Fused Silica to Modes, Dispersion, Mode Field and Illumination Efficiency ―― Inspection light travels in light guides (fibre bundles) and interferometric or spectroscopic light in single-mode fibre; both are set by the dispersion of the glass (the material table) and the guiding equations. Seven new ops (fiberoptics, category fiber of opsoptics): group index, material dispersion, numerical aperture, V number, LP_lm modes from the weakly guiding characteristic equation, the LP01 mode field diameter and light-guide efficiency. Fused silica has group index 1.4626 at 1.55 µm, its material-dispersion zero at 1272.8 nm and D = 21.9 ps/(nm km) at 1.55 µm, all within the published ranges. The mode count switches from 2 to 6 within 0.001 of the Bessel zero 2.4048, reaches 456 at V = 30 against V²/2 = 450, and the LP01 b(V) agrees with the Rudolph-Neumann fit to 0.24 %. LP02 is bound only exponentially weakly just above its cutoff and becomes resolvable in floating point about 0.05 above it, a limit now written into the operator. The mode field diameter agrees with Marcuse’s 1977 fit to 0.8 %, while the second-moment definition is 11 % larger at V = 1.2, so an MFD means nothing without its definition. A core radius of 4.1 µm and NA 0.12 give a cutoff of 1285 nm and an MFD of 9.06 µm at 1310 nm, inside the ITU-T G.652 range of 8.6 to 9.5 µm. A Lambertian LED fills a bundle of smaller NA as (NA_bundle/NA_source)², and the chain LED, 2 m light guide, 775 µm silicon wafer and silicon sensor yields 2.2e-4 electrons per photon. Nothing learned, nothing calibrated, 17 gates.
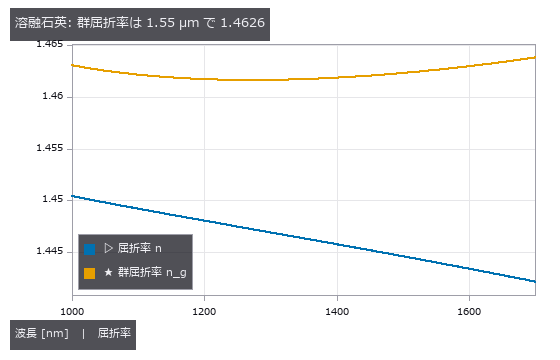
↑ The measurement ―― パルスの包絡は c/n_g で進む。材料表の溶融石英(Malitson 1965)から差分で求めた。 (figure labels are in Japanese; the numbers are the same)
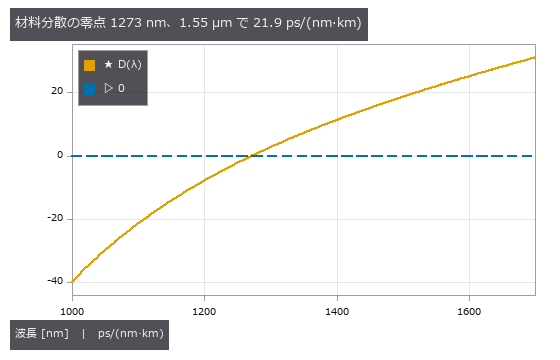
↑ 零点より短い波長は正常分散(青が遅い)、長い波長は異常分散。

↑ V が小さいほど場がクラッドへ染み出し、指数関数の裾が 2 次モーメントを押し上げる。
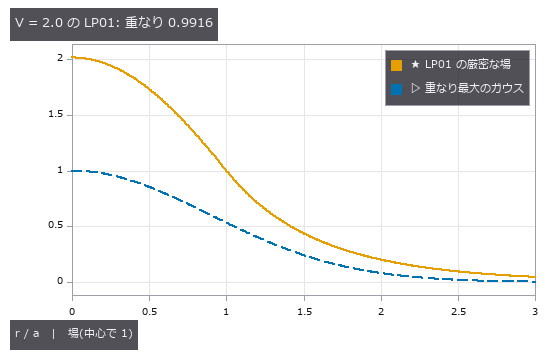
↑ コアの中は J0、外は K0。

↑ 光源より NA の小さい束は、立体角の比 (NA_束/NA_光源)² しか受け取らない。
py -3.11 examples/poc_fiber_light_guide.py
Source: examples/poc_fiber_light_guide.py
This run produced 6 figures in total - see them all
Ops used (notes): energy_to_photons · fiber_bundle_coupling · fiber_lp_modes · fiber_mode_field_diameter · fiber_numerical_aperture · fiber_v_number · led_spectrum · material_dispersion · material_group_index · material_gvd · material_transmittance · silicon_photodiode_qe · spectral_integral · spectral_product
No.2026.249 —— Reading a Lens Design File (.zmx), Analysing It, Fixing It and Writing It Back — Scored Against Two Other Readers and a Round Trip
The plain-text prescription (.zmx) that commercial sequential ray-tracing programs save becomes a raytrace prescription, goes through real rays, Seidel sums, PSF (point spread function), MTF (modulation transfer function) and optimisation, and is written back in the same format. Four new ops (lensfile, category lensfile of opsoptics): read, pick a field / wavelength, write, and a keyword inventory. Every keyword is classified as read, ignored (with a reason) or unsupported; unsupported surfaces (coordinate breaks, ideal lenses, toroids …), an r² aspheric term and glass names that exist in the material table only as an alias are refused, and approximations are imported only with allow_partial and are marked. Against what ray-optics (BSD-3) and optiland (MIT) computed from the very same files with their own readers, first-order data agree to 6e-16 on four designs, the Seidel sums to 6e-8 and 14 real rays to 3e-8 mm on the image. Swapping the middle element of the triplet to a 648/338 flint blows the RMS spot from 13.9 to 332 µm; lensopt on the six curvatures brings it back to 14.1 µm at the original 50.02 mm focal length, and the written .zmx reads back identically. Building this exposed and fixed a defect in raytrace: the conic intersection took the root with the smallest |
t | , so a concave surface after a long air gap turned every ray into a ‘vignetted’ one. No learning, no calibration, 21 gates. |
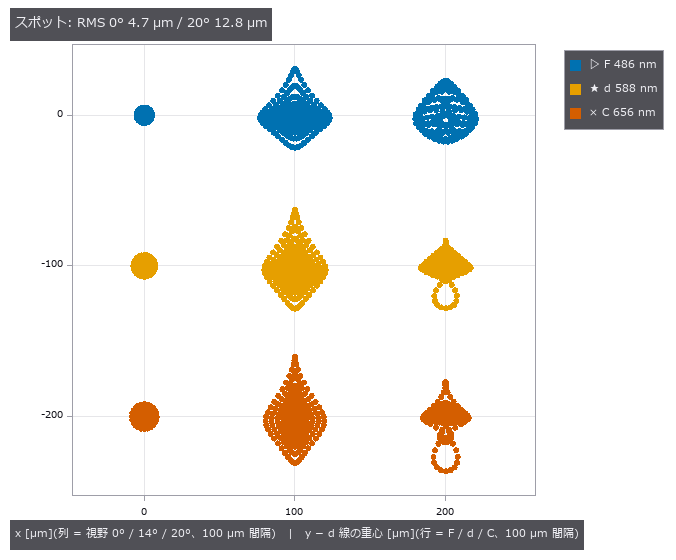
*↑ Reading a Lens Design File (.zmx), Analysing It, Fixing It and Writing It Back — Scored Against Two Other Readers and a Round Trip ―― The plain-text prescription (.zmx) that commercial sequential ray-tracing programs save becomes a raytrace prescription, goes through real rays, Seidel sums, PSF (point spread function), MTF (modulation transfer function) and optimisation, and is written back in the same format. Four new ops (lensfile, category lensfile of opsoptics): read, pick a field / wavelength, write, and a keyword inventory. Every keyword is classified as read, ignored (with a reason) or unsupported; unsupported surfaces (coordinate breaks, ideal lenses, toroids …), an r² aspheric term and glass names that exist in the material table only as an alias are refused, and approximations are imported only with allow_partial and are marked. Against what ray-optics (BSD-3) and optiland (MIT) computed from the very same files with their own readers, first-order data agree to 6e-16 on four designs, the Seidel sums to 6e-8 and 14 real rays to 3e-8 mm on the image. Swapping the middle element of the triplet to a 648/338 flint blows the RMS spot from 13.9 to 332 µm; lensopt on the six curvatures brings it back to 14.1 µm at the original 50.02 mm focal length, and the written .zmx reads back identically. Building this exposed and fixed a defect in raytrace: the conic intersection took the root with the smallest |
t | , so a concave surface after a long air gap turned every ray into a ‘vignetted’ one. No learning, no calibration, 21 gates.* |
Terms: PSF — The spatial response of an imaging system to a point object, describing how that point is blurred in the image.; MTF — The magnitude of the optical transfer function, showing how image contrast is transferred at each spatial frequency.
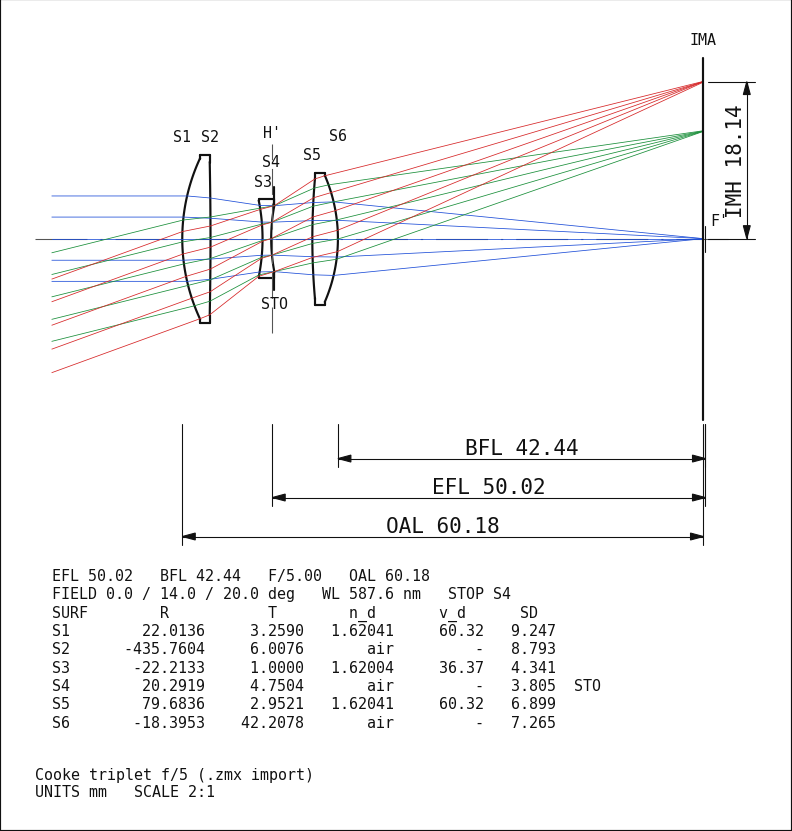
↑ The measurement ―― 読み込んだ処方の子午断面図(optdraw)。視野 0・14・20° の実光線 5 本ずつ、寸法は EFL・BFL・全長・像高。 (figure labels are in Japanese; the numbers are the same)
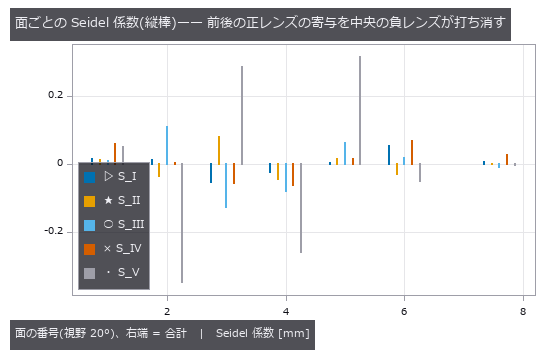
↑ S_I 球面、S_II コマ、S_III 非点、S_IV ペッツバール、S_V 歪曲。
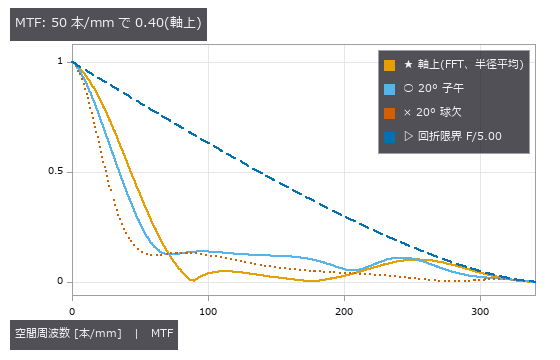
↑ 実収差の瞳(OPD)から PSF を FFT で作り、その FFT が MTF。
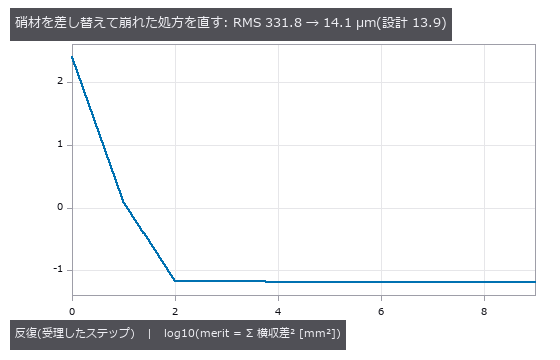
↑ 中央の負レンズを重いフリント 648/338 に差し替えて崩れた三枚玉を、6 面の曲率を変数に EFL を元の値に固定して直す。
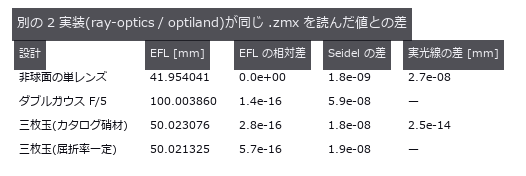
↑ 記録値(tests/data/lensfile/second_recorded.json)。
py -3.11 examples/poc_lens_file_roundtrip.py
Source: examples/poc_lens_file_roundtrip.py
This run produced 6 figures in total - see them all
Ops used (notes): drawing_raster · lens_file_read · lens_file_report · lens_file_system · lens_file_write · lens_section_drawing · lens_system · merit_function · mtf50 · mtf_diffraction · noncoaxial_example · noncoaxial_layout · noncoaxial_system · optimize_lens · paraxial_trace · psf_to_mtf · ray_bundle · seidel_coefficients · spot_diagram · trace_rays · with_wavelength
No.2026.261 —— A Zoom Lens as Differences of One Prescription — Scored Against the Two-Thin-Lens Closed Form and a Round Trip Through the Design File’s Multi-Configuration Table
Several configurations that differ only in a spacing or a curvature, such as wide, standard and tele, are held as differences of one prescription instead of copies. Five new ops (lensconfig, category lensconfig of opsoptics): resolve all configurations, resolve one, the operand-by-configuration table, one metric (EFL, back focal length, RMS spot, MTF, encircled energy) per configuration, and append a configuration. lens_file_read / lens_file_write read and write the MNUM table of the design file (.zmx) with its THIC / CRVT / GLSS / PRAM rows; the row layout was checked on 24 public zoom-lens files. For two thin lenses (f1 = 100, f2 = 60 mm) at separations 10 / 20 / 30 mm the EFL and back focal length match the closed form f1 f2 / (f1 + f2 - d) to 1e-9, and for one ideal lens whose f changes per configuration the encircled energy is the Airy 83.8 % (worst difference 1e-4). A Cooke triplet with the gap between the first two lenses changed (the image distance refocused per configuration) has EFL 50.26 / 50.02 / 49.79 mm and on-axis RMS spot 3.6 / 12.0 / 26.2 um. Written to a .zmx with an MNUM table and read back, every overridden value and the EFL agree to 1e-12 per configuration and write-read-write gives the same table. A system whose aperture, field or wavelength differs between configurations cannot be carried by the verified rows, so the writer refuses it instead of dropping the difference. Learning 0, calibration 0, 14 gates.
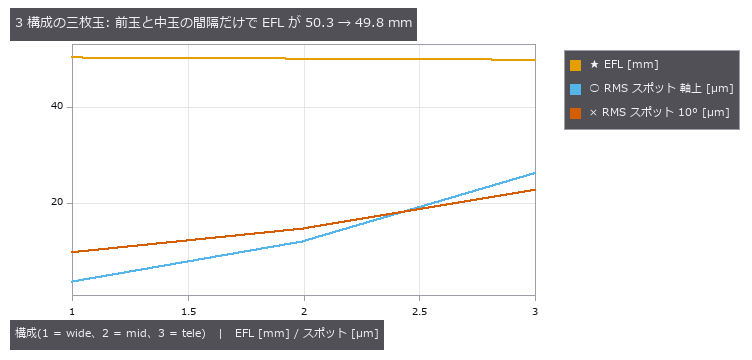
↑ A Zoom Lens as Differences of One Prescription — Scored Against the Two-Thin-Lens Closed Form and a Round Trip Through the Design File’s Multi-Configuration Table ―― Several configurations that differ only in a spacing or a curvature, such as wide, standard and tele, are held as differences of one prescription instead of copies. Five new ops (lensconfig, category lensconfig of opsoptics): resolve all configurations, resolve one, the operand-by-configuration table, one metric (EFL, back focal length, RMS spot, MTF, encircled energy) per configuration, and append a configuration. lens_file_read / lens_file_write read and write the MNUM table of the design file (.zmx) with its THIC / CRVT / GLSS / PRAM rows; the row layout was checked on 24 public zoom-lens files. For two thin lenses (f1 = 100, f2 = 60 mm) at separations 10 / 20 / 30 mm the EFL and back focal length match the closed form f1 f2 / (f1 + f2 - d) to 1e-9, and for one ideal lens whose f changes per configuration the encircled energy is the Airy 83.8 % (worst difference 1e-4). A Cooke triplet with the gap between the first two lenses changed (the image distance refocused per configuration) has EFL 50.26 / 50.02 / 49.79 mm and on-axis RMS spot 3.6 / 12.0 / 26.2 um. Written to a .zmx with an MNUM table and read back, every overridden value and the EFL agree to 1e-12 per configuration and write-read-write gives the same table. A system whose aperture, field or wavelength differs between configurations cannot be carried by the verified rows, so the writer refuses it instead of dropping the difference. Learning 0, calibration 0, 14 gates.
Terms: MTF — The magnitude of the optical transfer function, showing how image contrast is transferred at each spatial frequency.; Airy pattern — The diffraction image of a circular aperture. The Airy-disc radius to the first dark ring is 1.22 λF.
py -3.11 examples/poc_zoom_configurations.py
Source: examples/poc_zoom_configurations.py
This run produced 1 figures in total - see them all
Ops used (notes): encircled_energy · lens_add_configuration · lens_configuration_metrics · lens_configuration_table · lens_configurations · lens_file_read · lens_file_write · lens_system · lens_with_configuration · paraxial_trace
No.2026.262 —— Glass Substitution and Multi-Start Search — Scored Against the Thin-Achromat Closed Form and the Third-Order Best-Form Bending
A model glass (n_d, V_d) is swapped for a catalogue glass, and the local optimiser is run from many starting points to collect the local optima. Three new ops (lensglobal, category lensglobal of opsoptics): glass_nearest (the k nearest catalogue glasses in the Abbe plane, distance nd_vd or partial_dispersion with a P_g,F term), lens_substitute_glasses (replace the model glasses of a system by the k-th nearest catalogue glass; beyond the tolerance it is a ValueError and nothing is swapped partially) and lens_global_search (multi-start; the local optimiser is lensopt.optimize_lens itself, the merit is not re-implemented; every local optimum is returned in merit order, coinciding ones are flagged as duplicates, the same seed gives the same result). Each of 8 catalogue glasses is its own nearest neighbour at distance 0, and a model glass made from it is swapped back to its name. The powers of a thin achromat (crown 1.5168 / 64.17, flint 1.6200 / 36.37) from the closed form phi1 = phi V1/(V1 - V2), phi2 = -phi V2/(V1 - V2) are achromatic to 1e-12, and after the swap the F-C power difference becomes phi1’/V1’ + phi2’/V2’ (+5.9e-5 of the power for the nearest pair, -4.5e-3 for k = 2); the traced value agrees with the hand computation to 4e-11 relative. Three external truths for the search. (a) Bending a singlet: the best shape factor at apertures 5 / 3 mm, 0.7374 / 0.7383, extrapolated in ap^2 gives 0.7388, within 1e-3 of the third-order q* = 2(n^2 - 1)/(n + 2) = 0.7397. (b) A thin achromat: all 8 starts reach the closed-form powers to 9.8e-9 relative and collapse into one optimum. (c) A three-curvature achromat: 19 of 20 starts fall into the shallow optimum (merit 1.18e-5) and one reaches the deep one (5.04e-6); a single start stays in the shallow one. Honest note: the local optimiser’s default EFL weight is too stiff for a small-aperture system and stalls at merit 5e-10, so (b) was run with efl_weight = 1. Learning 0, calibration 0, 10 gates.

↑ Glass Substitution and Multi-Start Search — Scored Against the Thin-Achromat Closed Form and the Third-Order Best-Form Bending ―― A model glass (n_d, V_d) is swapped for a catalogue glass, and the local optimiser is run from many starting points to collect the local optima. Three new ops (lensglobal, category lensglobal of opsoptics): glass_nearest (the k nearest catalogue glasses in the Abbe plane, distance nd_vd or partial_dispersion with a P_g,F term), lens_substitute_glasses (replace the model glasses of a system by the k-th nearest catalogue glass; beyond the tolerance it is a ValueError and nothing is swapped partially) and lens_global_search (multi-start; the local optimiser is lensopt.optimize_lens itself, the merit is not re-implemented; every local optimum is returned in merit order, coinciding ones are flagged as duplicates, the same seed gives the same result). Each of 8 catalogue glasses is its own nearest neighbour at distance 0, and a model glass made from it is swapped back to its name. The powers of a thin achromat (crown 1.5168 / 64.17, flint 1.6200 / 36.37) from the closed form phi1 = phi V1/(V1 - V2), phi2 = -phi V2/(V1 - V2) are achromatic to 1e-12, and after the swap the F-C power difference becomes phi1’/V1’ + phi2’/V2’ (+5.9e-5 of the power for the nearest pair, -4.5e-3 for k = 2); the traced value agrees with the hand computation to 4e-11 relative. Three external truths for the search. (a) Bending a singlet: the best shape factor at apertures 5 / 3 mm, 0.7374 / 0.7383, extrapolated in ap^2 gives 0.7388, within 1e-3 of the third-order q = 2(n^2 - 1)/(n + 2) = 0.7397. (b) A thin achromat: all 8 starts reach the closed-form powers to 9.8e-9 relative and collapse into one optimum. (c) A three-curvature achromat: 19 of 20 starts fall into the shallow optimum (merit 1.18e-5) and one reaches the deep one (5.04e-6); a single start stays in the shallow one. Honest note: the local optimiser’s default EFL weight is too stiff for a small-aperture system and stalls at merit 5e-10, so (b) was run with efl_weight = 1. Learning 0, calibration 0, 10 gates.*
py -3.11 examples/poc_lens_global_search.py
Source: examples/poc_lens_global_search.py
This run produced 1 figures in total - see them all
Ops used (notes): glass · glass_map · glass_nearest · lens_global_search · lens_substitute_glasses · lens_system · paraxial_trace · with_wavelength
No.2026.265 —— Designing a Triplet from a Table of Requirements — A Merit Function with Edge-Thickness, Centre-Thickness and Air-Gap Bounds, Scored Against Closed Forms and an Independent Implementation
A designer’s merit function is a table of requirements: “edge thickness at least 1 mm here, EFL 50 mm, a small wavefront”. Keep that table as rows, each with a target, a weight and, for a bound, a one-sided form, and say what pulls the optimiser as a percentage per row. Six new ops (lensmerit, category lensmerit of opsoptics): merit_operands_list (name, meaning, unit and arguments of 32 operands; the 7th slice added ANGM / RSAN for afocal systems) / merit_evaluate (per row value, target, weight, contribution (w (value - target))^2 and share; a bound row contributes 0 while it holds) / merit_default (whole-pupil ray rows plus the EFL hold; spot or wavefront, chief-ray or centroid reference) / merit_boundary_operands (edge thickness of every glass, centre-thickness and air-gap bounds) / optimize_lens_operands (the variables, damped least squares and step sizes of lensopt unchanged, plus an outer discrete loop that picks the glass of g<i> from a candidate list) / merit_contributions (which row dominates, as percentages). The edge thickness is t - sag_i(h_i) + sag_(i+1)(h_(i+1)) at the clear semi-diameters of both surfaces, conic and even aspheric terms included. Scored against closed forms: the thin-achromat power split phi1 = phi V1/(V1 - V2), phi2 = -phi V2/(V1 - V2) (an EFFL + AXCL = 0 optimisation lands on it to 1.7e-14 relative), the plano-convex edge thickness to 1.8e-15, the real ray height and angle of incidence after a refracting sphere against Snell’s law to 1.1e-13, the working F-number of an ideal lens against f/2h to 1.2e-7. The default table (spot, chief-ray reference) equals lensopt.merit_function to 0.0 relative (the gate is 1e-9). Against the recorded numbers of an independent implementation (an MIT-licensed open-source library) the EFL agrees to 1.4e-14, the real ray positions at the image to 1.8e-14 mm and the on-axis OPD to 8.5e-11 waves; the off-axis OPD differs by 0.03 % of the peak at 14 deg and 0.25 % at 20 deg (a convention: the other implementation’s reference sphere has the distance from the image point to the exit-pupil centre as its radius, raytrace.opd_samples the axial distance only). A Cooke-type triplet (the classic 40-degree radii moved by 7-10 %, thin edges, EFL 58 mm) is optimised with a table of wavefront (3 fields x F, d, C) + an EFL hold of 50 mm + bounds (edge thickness >= 1 mm, centre thickness 2-8 mm, air gap >= 0.5 mm): merit 1.03e5 -> 33.9 (1/3041), EFL 57.98 -> 50.0015 mm, edge thickness 1.83 / 2.38 / 0.10 -> 3.37 / 3.78 / 1.00 mm, RMS spot (on axis, 8.4 deg, 12 deg) 25 / 13 / 22 -> 5.8 / 8.4 / 12 um. The dominant row moves from the EFL hold (82 %) to the wavefront row at 12 deg (71 %). From a start whose negative lens has the wrong glass (a crown), with axial- and lateral-colour rows added, the continuous variables alone leave the axial colour at -1.02 mm (glass cannot be fixed by continuous variables). Letting g2 choose among 6 model glasses picks a dense flint: AXCL -1.02 -> -0.059 mm (1/17), LACL at 12 deg -0.051 -> -3.3e-4 mm (1/154), merit 1.26e4 -> 47 (1/265). Honest notes: with bound weight 10 the centre thickness stopped 0.06 mm short, so 100 is used; the optimisation spends its 40 iterations at the active edge bound (1.001 mm); the reduced CI budget (one outer loop) ends at merit 45.6, AXCL 1/18 and LACL 1/167. Learning 0, calibration 0, 25 gates.

↑ Designing a Triplet from a Table of Requirements — A Merit Function with Edge-Thickness, Centre-Thickness and Air-Gap Bounds, Scored Against Closed Forms and an Independent Implementation ―― A designer’s merit function is a table of requirements: “edge thickness at least 1 mm here, EFL 50 mm, a small wavefront”. Keep that table as rows, each with a target, a weight and, for a bound, a one-sided form, and say what pulls the optimiser as a percentage per row. Six new ops (lensmerit, category lensmerit of opsoptics): merit_operands_list (name, meaning, unit and arguments of 32 operands; the 7th slice added ANGM / RSAN for afocal systems) / merit_evaluate (per row value, target, weight, contribution (w (value - target))^2 and share; a bound row contributes 0 while it holds) / merit_default (whole-pupil ray rows plus the EFL hold; spot or wavefront, chief-ray or centroid reference) / merit_boundary_operands (edge thickness of every glass, centre-thickness and air-gap bounds) / optimize_lens_operands (the variables, damped least squares and step sizes of lensopt unchanged, plus an outer discrete loop that picks the glass of g<i> from a candidate list) / merit_contributions (which row dominates, as percentages). The edge thickness is t - sag_i(h_i) + sag_(i+1)(h_(i+1)) at the clear semi-diameters of both surfaces, conic and even aspheric terms included. Scored against closed forms: the thin-achromat power split phi1 = phi V1/(V1 - V2), phi2 = -phi V2/(V1 - V2) (an EFFL + AXCL = 0 optimisation lands on it to 1.7e-14 relative), the plano-convex edge thickness to 1.8e-15, the real ray height and angle of incidence after a refracting sphere against Snell’s law to 1.1e-13, the working F-number of an ideal lens against f/2h to 1.2e-7. The default table (spot, chief-ray reference) equals lensopt.merit_function to 0.0 relative (the gate is 1e-9). Against the recorded numbers of an independent implementation (an MIT-licensed open-source library) the EFL agrees to 1.4e-14, the real ray positions at the image to 1.8e-14 mm and the on-axis OPD to 8.5e-11 waves; the off-axis OPD differs by 0.03 % of the peak at 14 deg and 0.25 % at 20 deg (a convention: the other implementation’s reference sphere has the distance from the image point to the exit-pupil centre as its radius, raytrace.opd_samples the axial distance only). A Cooke-type triplet (the classic 40-degree radii moved by 7-10 %, thin edges, EFL 58 mm) is optimised with a table of wavefront (3 fields x F, d, C) + an EFL hold of 50 mm + bounds (edge thickness >= 1 mm, centre thickness 2-8 mm, air gap >= 0.5 mm): merit 1.03e5 -> 33.9 (1/3041), EFL 57.98 -> 50.0015 mm, edge thickness 1.83 / 2.38 / 0.10 -> 3.37 / 3.78 / 1.00 mm, RMS spot (on axis, 8.4 deg, 12 deg) 25 / 13 / 22 -> 5.8 / 8.4 / 12 um. The dominant row moves from the EFL hold (82 %) to the wavefront row at 12 deg (71 %). From a start whose negative lens has the wrong glass (a crown), with axial- and lateral-colour rows added, the continuous variables alone leave the axial colour at -1.02 mm (glass cannot be fixed by continuous variables). Letting g2 choose among 6 model glasses picks a dense flint: AXCL -1.02 -> -0.059 mm (1/17), LACL at 12 deg -0.051 -> -3.3e-4 mm (1/154), merit 1.26e4 -> 47 (1/265). Honest notes: with bound weight 10 the centre thickness stopped 0.06 mm short, so 100 is used; the optimisation spends its 40 iterations at the active edge bound (1.001 mm); the reduced CI budget (one outer loop) ends at merit 45.6, AXCL 1/18 and LACL 1/167. Learning 0, calibration 0, 25 gates.
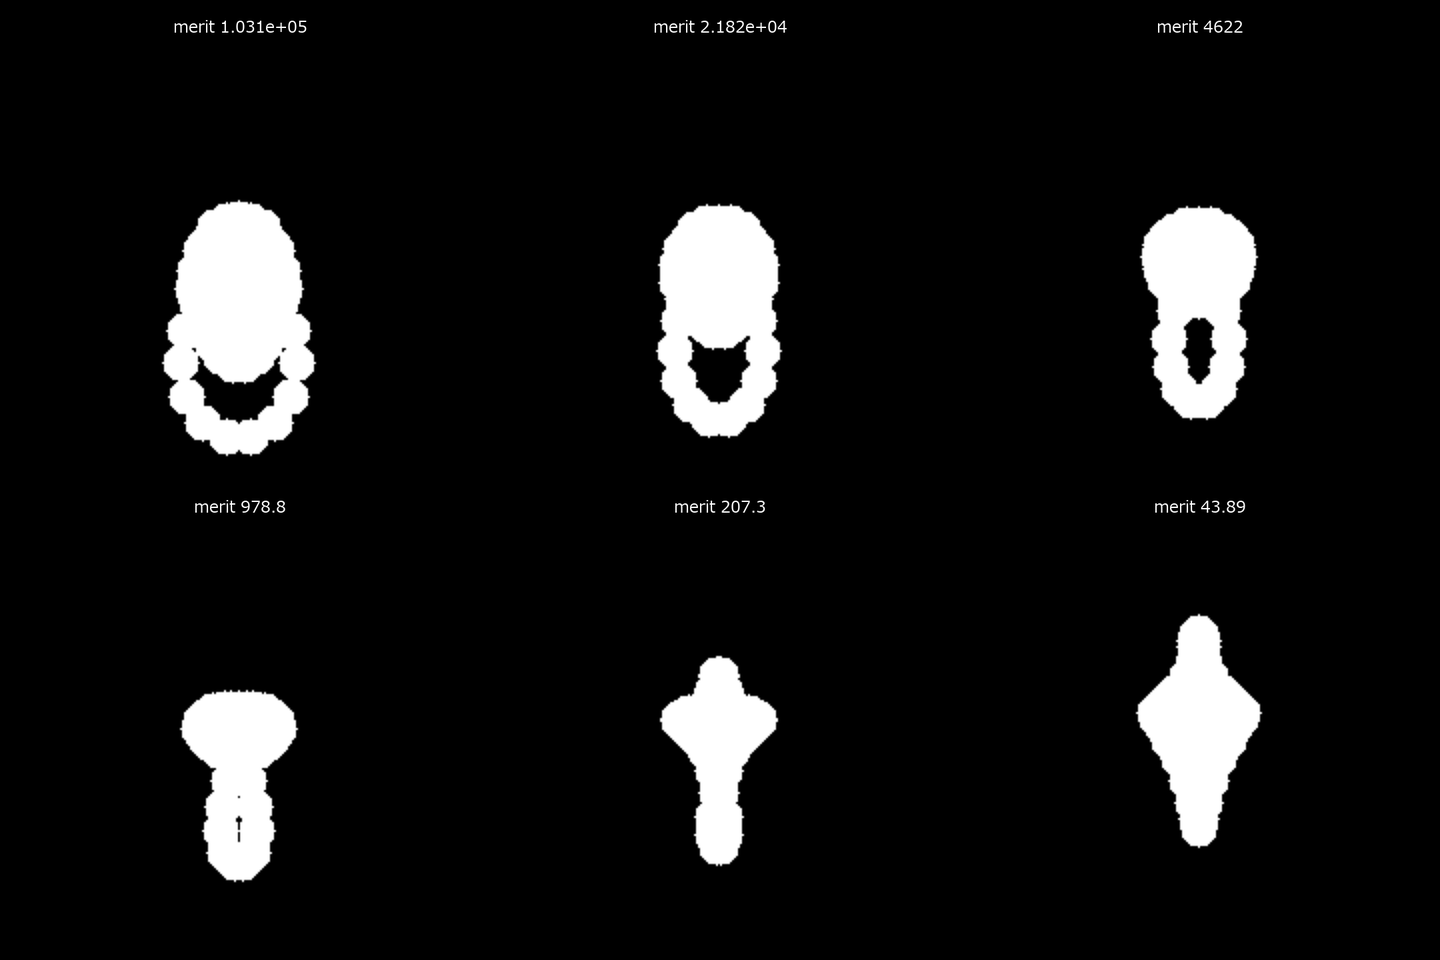
↑ The measurement ―― 最適化に伴い12度視野のスポットが収束する。 (figure labels are in Japanese; the numbers are the same)
py -3.11 examples/poc_lens_merit_operands.py
Source: examples/poc_lens_merit_operands.py
This run produced 2 figures in total - see them all
Ops used (notes): lens_system · merit_boundary_operands · merit_contributions · merit_default · merit_evaluate · merit_function · merit_operands_list · optimize_lens_operands · paraxial_trace · ray_bundle · text_box · with_wavelength
No.2026.267 —— Keeping a Design’s Relations as Solves — A Double-Gauss Type Whose Focus and F-Number Follow the Stop, Afocal Telescopes, a Curved Image Surface and Odd Aspheres
A design is a bundle of relations, not a list of numbers. Keep “the image plane is the paraxial focus”, “F/# is 5” and “this surface is concentric with the previous one” as rules on the surface, so that changing the stop radius or a glass lets the rest settle again. Nine new ops (lenssolve, category lenssolve of opsoptics): lens_apply_solves (a copy with every solve resolved) / lens_solve_set / lens_solve_clear / lens_solves_list (rule, solved value, achieved quantity and error) / afocal_system / lens_afocal_report (angular magnification, exit pupil and angular aberration per field in arcminutes) / lens_image_surface / lens_petzval_radius / lens_zmx_solves_roundtrip. A rule sits in solve of the surface dict (R / t next to it hold the solved value) and every raytrace trace resolves it first. raytrace gained an image-surface curvature image_R, afocal, and the aspheric terms a2 (r^2) and odd (r^i, i = 1..8); lensmerit gained the angular magnification ANGM and the angular spot RSAN. Scored against closed forms: the chief-ray height and marginal-ray angle solves equal the hand solution of one linear equation (error 0), the F/# solve has two roots (positive and negative power) and matches both closed-form roots to 3e-17, the aplanatic surface images its object point exactly (spot RMS 3.4e-16 mm; an ordinary R = -3 mm surface 0.51 mm), a concentric ball does not bend a ray aimed at its centre (2.2e-16). A double-Gauss type (an F/# = 5 solve on the front curvature of the last element, a paraxial-image solve on the image distance) re-settles as the stop radius moves from 5.0 to 7.6 mm: the F/# stays 5 (error 8.9e-16) and the image distance follows the paraxial focus (4.4e-16); the last curvature moves R 79 -> 768 mm, the EFL 78.9 -> 119.9 mm, the image distance 47.5 -> 74.6 mm. The frozen-numbers version drifts from F/# 6.34 to 4.17. Honest limit: holding the F/# while the stop opens without redesigning the other surfaces, the RMS spot at 10 deg is 65.8 -> 25.6 um and worse in between (a solve keeps a relation, not the image quality). The F/# solve has two roots (curvature -0.046711 and +0.005637 /mm); the other is a diverging system of EFL -100 mm. Afocal: the ideal-lens Keplerian (f1 = 100, f2 = 25) and Galilean (f2 = -25) telescopes have angular magnification -4 / +4 exactly (EFL = inf does not raise) and angular aberration below 7.5e-13 arcmin. A real telescope of two achromatic doublets (separation 119.9076 mm, angular magnification -4.026, exit pupil of radius 2.48 mm at 30.4 mm) has angular spot RMS 0.60 / 0.71 / 1.05 / 1.63 / 2.55 arcmin at 0 / 0.25 / 0.5 / 0.75 / 1 deg, an on-axis wavefront of 0.041 waves (diffraction limited) and an angular-magnification distortion of 0.85 % at 1 deg. The afocal flag round-trips through a NOTE line of the .zmx (the format’s own afocal line cannot be established from a real file, so none is invented). Curved image surface: for a thin meniscus (concave to the object, f = 99.8 mm) at zero Seidel astigmatism, the image surface of the Petzval radius -151.68 mm (equal to the thin-lens closed form -N f and to the Seidel sum) shrinks the RMS spot at 0.7 field from 1.94 um on the flat plane to 0.226 um (the best-plane floor is 0.222 um); the field-curvature term goes 1.93 -> 0.046 um (1/42). Odd aspheres: the sag matches the hand-written polynomial to 2.2e-16, the intersection satisfies the surface equation to 2.8e-16, and B = 0 is bit-identical to the even asphere. A conical (r^1) plate focuses rays onto a line 102 mm long instead of a point, and the axis crossings match the Snell closed form to 7.1e-14. One term added to a spherical-aberration corrector plate: r^4 takes the on-axis RMS 14.0 -> 0.030 um (1/467), r^3 to 1.97 um (1/7.1), r^1 to 8.3 um, r^2 to 11.5 um. .zmx: three pickups (CURV c 4 source scale offset, PZUP, PPAR) and three rules written as NOTE lines make write -> read -> write a fixed point (difference 1.4e-14); no solve is frozen and dropped. Limits: only the pickups have a form that real files show, so the other kinds (chief / marginal ray, F/#, concentric, aplanatic) round-trip through NOTE lines; odd terms (r^1 above all) are not smooth at the vertex, the r^1 term has no paraxial power, and the Seidel sums, the non-coaxial tracer and PSF / MTF refuse a2 / odd and afocal. Learning 0, calibration 0, 35 gates.

↑ Keeping a Design’s Relations as Solves — A Double-Gauss Type Whose Focus and F-Number Follow the Stop, Afocal Telescopes, a Curved Image Surface and Odd Aspheres ―― A design is a bundle of relations, not a list of numbers. Keep “the image plane is the paraxial focus”, “F/# is 5” and “this surface is concentric with the previous one” as rules on the surface, so that changing the stop radius or a glass lets the rest settle again. Nine new ops (lenssolve, category lenssolve of opsoptics): lens_apply_solves (a copy with every solve resolved) / lens_solve_set / lens_solve_clear / lens_solves_list (rule, solved value, achieved quantity and error) / afocal_system / lens_afocal_report (angular magnification, exit pupil and angular aberration per field in arcminutes) / lens_image_surface / lens_petzval_radius / lens_zmx_solves_roundtrip. A rule sits in solve of the surface dict (R / t next to it hold the solved value) and every raytrace trace resolves it first. raytrace gained an image-surface curvature image_R, afocal, and the aspheric terms a2 (r^2) and odd (r^i, i = 1..8); lensmerit gained the angular magnification ANGM and the angular spot RSAN. Scored against closed forms: the chief-ray height and marginal-ray angle solves equal the hand solution of one linear equation (error 0), the F/# solve has two roots (positive and negative power) and matches both closed-form roots to 3e-17, the aplanatic surface images its object point exactly (spot RMS 3.4e-16 mm; an ordinary R = -3 mm surface 0.51 mm), a concentric ball does not bend a ray aimed at its centre (2.2e-16). A double-Gauss type (an F/# = 5 solve on the front curvature of the last element, a paraxial-image solve on the image distance) re-settles as the stop radius moves from 5.0 to 7.6 mm: the F/# stays 5 (error 8.9e-16) and the image distance follows the paraxial focus (4.4e-16); the last curvature moves R 79 -> 768 mm, the EFL 78.9 -> 119.9 mm, the image distance 47.5 -> 74.6 mm. The frozen-numbers version drifts from F/# 6.34 to 4.17. Honest limit: holding the F/# while the stop opens without redesigning the other surfaces, the RMS spot at 10 deg is 65.8 -> 25.6 um and worse in between (a solve keeps a relation, not the image quality). The F/# solve has two roots (curvature -0.046711 and +0.005637 /mm); the other is a diverging system of EFL -100 mm. Afocal: the ideal-lens Keplerian (f1 = 100, f2 = 25) and Galilean (f2 = -25) telescopes have angular magnification -4 / +4 exactly (EFL = inf does not raise) and angular aberration below 7.5e-13 arcmin. A real telescope of two achromatic doublets (separation 119.9076 mm, angular magnification -4.026, exit pupil of radius 2.48 mm at 30.4 mm) has angular spot RMS 0.60 / 0.71 / 1.05 / 1.63 / 2.55 arcmin at 0 / 0.25 / 0.5 / 0.75 / 1 deg, an on-axis wavefront of 0.041 waves (diffraction limited) and an angular-magnification distortion of 0.85 % at 1 deg. The afocal flag round-trips through a NOTE line of the .zmx (the format’s own afocal line cannot be established from a real file, so none is invented). Curved image surface: for a thin meniscus (concave to the object, f = 99.8 mm) at zero Seidel astigmatism, the image surface of the Petzval radius -151.68 mm (equal to the thin-lens closed form -N f and to the Seidel sum) shrinks the RMS spot at 0.7 field from 1.94 um on the flat plane to 0.226 um (the best-plane floor is 0.222 um); the field-curvature term goes 1.93 -> 0.046 um (1/42). Odd aspheres: the sag matches the hand-written polynomial to 2.2e-16, the intersection satisfies the surface equation to 2.8e-16, and B = 0 is bit-identical to the even asphere. A conical (r^1) plate focuses rays onto a line 102 mm long instead of a point, and the axis crossings match the Snell closed form to 7.1e-14. One term added to a spherical-aberration corrector plate: r^4 takes the on-axis RMS 14.0 -> 0.030 um (1/467), r^3 to 1.97 um (1/7.1), r^1 to 8.3 um, r^2 to 11.5 um. .zmx: three pickups (CURV c 4 source scale offset, PZUP, PPAR) and three rules written as NOTE lines make write -> read -> write a fixed point (difference 1.4e-14); no solve is frozen and dropped. Limits: only the pickups have a form that real files show, so the other kinds (chief / marginal ray, F/#, concentric, aplanatic) round-trip through NOTE lines; odd terms (r^1 above all) are not smooth at the vertex, the r^1 term has no paraxial power, and the Seidel sums, the non-coaxial tracer and PSF / MTF refuse a2 / odd and afocal. Learning 0, calibration 0, 35 gates.
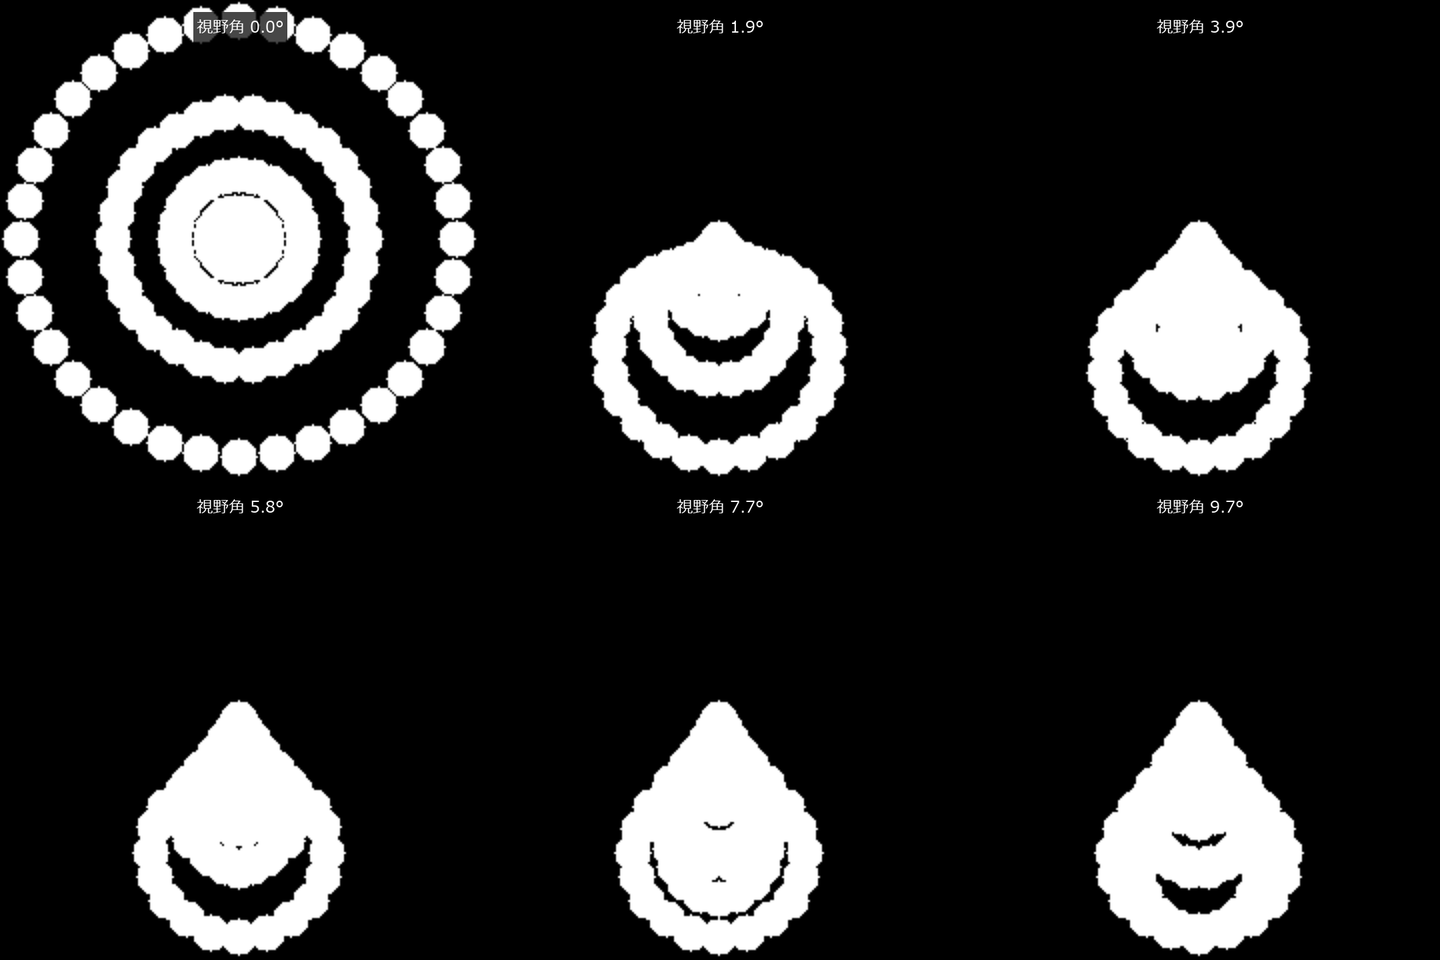
↑ The measurement ―― 解いた曲面像面で視野角を掃引したスポット。 (figure labels are in Japanese; the numbers are the same)
py -3.11 examples/poc_lens_solves_afocal.py
Source: examples/poc_lens_solves_afocal.py
This run produced 2 figures in total - see them all
Ops used (notes): afocal_system · chief_ray · lens_afocal_report · lens_apply_solves · lens_file_read · lens_file_write · lens_image_surface · lens_petzval_radius · lens_solve_clear · lens_solve_set · lens_solves_list · lens_system · lens_zmx_solves_roundtrip · paraxial_trace · ray_bundle · seidel_coefficients · spot_stats · text_box · trace_rays
No.2026.239 —— Sorting Look-Alike Foreign Matter with Hyperspectral NIR — Two Real Datasets (Plastic Flakes, Foreign Objects on Pork Belly) and a Material-Table Simulation of the Failure Modes
Foreign matter the same colour as meat or kernels cannot be told apart by a colour camera. Classifying public real images as spectral data detected debris on pork belly with 1.1 % false alarms. With fewer bands the false alarms grew, so a band set that sufficed on synthetic data did not suffice on real data.

↑ Sorting Look-Alike Foreign Matter with Hyperspectral NIR — Two Real Datasets (Plastic Flakes, Foreign Objects on Pork Belly) and a Material-Table Simulation of the Failure Modes ―― Two public hyperspectral datasets (both CC BY 4.0; fetched and cached, not committed) are classified with Fullseye’s ops (read_envi, spec_continuum_removal, spec_angle_mapper, spec_band_selection_fisher) and scored against their own labels. Shredded plastics, six classes (RODARE 3390, a 400–2500 nm spectral camera): continuum removal + SAM reaches a mean class recall of 0.816 (0.439 on raw reflectance — dark flakes lose to additive baselines). A library from a separate scan of reference samples separates PP / PET / PE at 0.878; this PoC’s material-table physics alone gives 0.628 (chance 0.333). Black plastic reflects 0.03 with a C-H trough one sixth as deep. The test header still carried 450 fwhm values for 360 bands and the fail-closed reader refused it; the wavelength labels were verified on the polymer troughs and only fwhm was fixed in a copy. Foreign objects on pork belly, ten classes (Zenodo 17242553, an InGaAs line-scan spectral camera): split by capture, 656k test pixels; SAM gives AUC 0.92 with 10 % false alarms, LDA on all 184 bands detects 0.92 at 1.1 % false alarms, six Fisher bands give 2.1 % and three give 23 % — three bands sufficed in simulation but not on real data. The simulation (material absorption bands, Kubelka–Munk, halogen × fused-silica lens × InGaAs; eight new ops) covers the failure modes: colour-matched foreign matter at RGB AUC 0.48, kernels at 12 % moisture 98 % rejected, a 200 K lamp drift after the white reference 49 %, and carbon black at 1 wt % burying PP vs PE in single-pixel noise. The gap between simulated 1.000 and real 0.82–0.92 is the size of the inverse crime. Parameters were checked against primary sources (USGS spectra, papers, datasheets): PE band strengths cut 2–3x, PET’s two deepest bands added, and the table’s water k switched to Segelstein 1981.
Terms: SAM — A classifier that compares spectra by the angle between their vectors, making it invariant to a common multiplicative scale.

↑ The measurement ―― 実線: 実データの PP / PET / PE の画素の平均(連続体除去)。破線: この PoC の材料表(吸収帯 + Kubelka–Munk)。谷の位置は合い、深さと幅は合わない(模型の強さは推定)。物理モデルだけをライブラリにした 3 種の再現率 0.628、別撮影の基準試料 0.878。出典: E. Arbash ら, Polymers Hyperspectral Imaging, RODARE (HZDR), doi:10.14278/rodare.3390, CC BY 4.0。改変: 試験ヘッダの fwhm を 360 帯に切り詰め、1100〜2400 nm を切り出し、連続体除去。 (figure labels are in Japanese; the numbers are the same)

↑ 出典: E. Arbash ら, Polymers Hyperspectral Imaging, RODARE (HZDR), doi:10.14278/rodare.3390, CC BY 4.0。

↑ 同じトレイ。

↑ 行 = 真値、列 = 判定。

↑ 露光 = 画素の長さ 0.5 mm / 搬送速度。
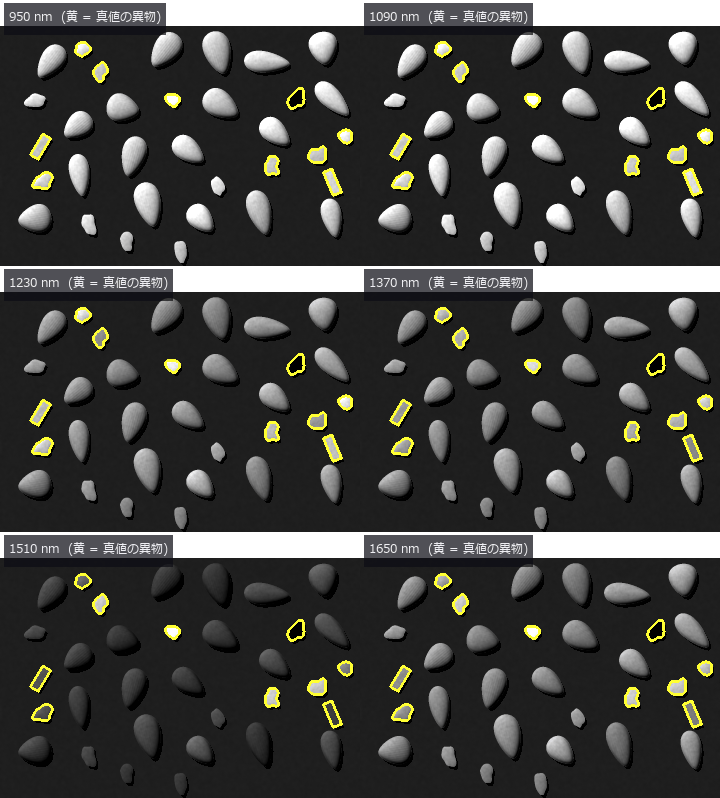
↑ The animation ―― 0.95〜1.65 µm を 20 nm おきに掃く。1.2 µm 付近で樹脂片が明るく、1.45 µm(水)で殻と木片が暗く沈む —— 1 帯域では分からない異物が、帯域を動かすと順に浮かぶ。
py -3.11 examples/poc_hyperspectral_foreign_matter.py
Source: examples/poc_hyperspectral_foreign_matter.py
This run produced 19 figures in total - see them all
Ops used (notes): carbon_black_absorption · hyperspectral_band_weights · hyperspectral_capture · ingaas_photodiode_qe · kubelka_munk_reflectance · material_nir_absorption · median · nir_model_info · spectral_reflectance_from_material · text_box
No.2026.270 —— Verifying Public .zmx Prescriptions Independently and Scoring Them as Inspection Lenses
Four prescriptions are calculated with a separate reader and ray tracer, comparing EFL, BFL, real rays and RMS spots. At infinity focus with a 1 mm entrance pupil and a 256 by 256 sensor of 5.5 um pixels, illumination, distortion, colour shift, MTF and visibility of a three-pixel scratch are scored. The OPD reference-sphere and pupil-mapping convention difference is retained as a figure. No learning, no calibration, two gates.

↑ Verifying Public .zmx Prescriptions Independently and Scoring Them as Inspection Lenses ―― Four prescriptions are calculated with a separate reader and ray tracer, comparing EFL, BFL, real rays and RMS spots. At infinity focus with a 1 mm entrance pupil and a 256 by 256 sensor of 5.5 um pixels, illumination, distortion, colour shift, MTF and visibility of a three-pixel scratch are scored. The OPD reference-sphere and pupil-mapping convention difference is retained as a figure. No learning, no calibration, two gates.
Terms: MTF — The magnitude of the optical transfer function, showing how image contrast is transferred at each spatial frequency.
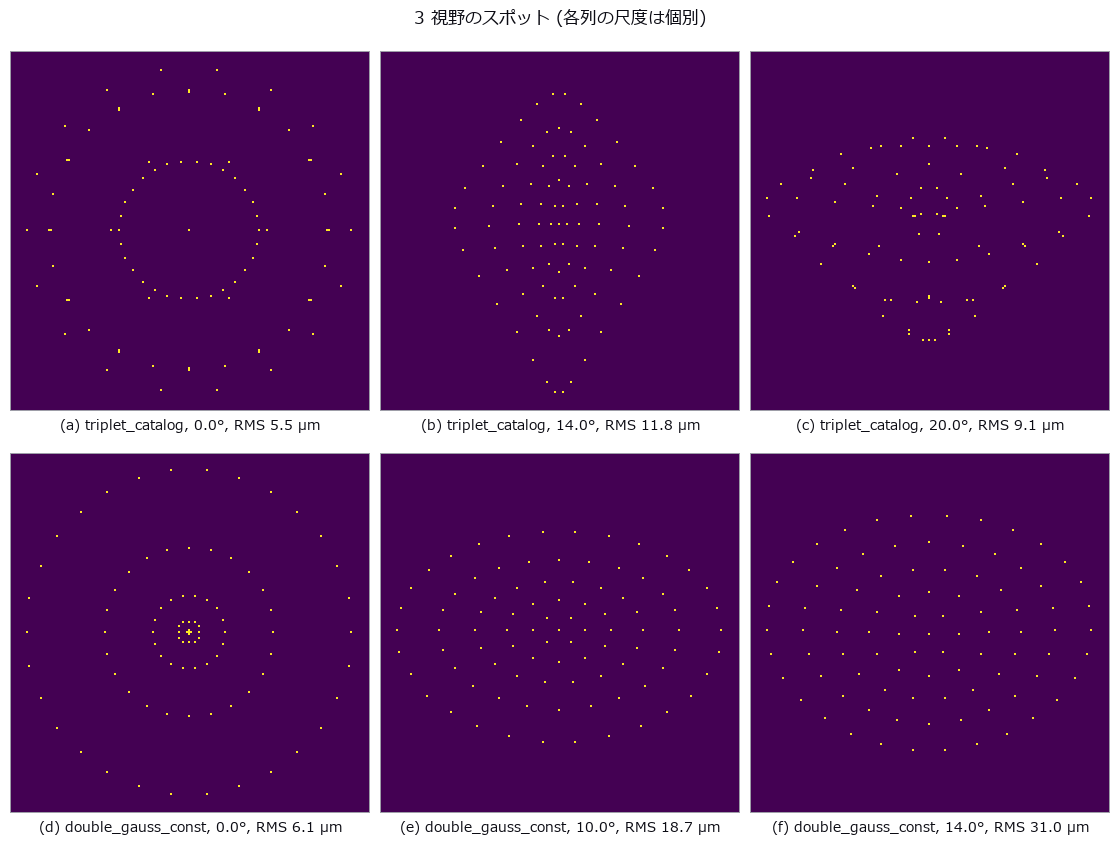
↑ The measurement ―― 2 処方、3 視野。各パネルの RMS は同じ実光線から計算。 (figure labels are in Japanese; the numbers are the same)
| [](https://raw.githubusercontent.com/furuse-kazufumi/fullseye/master/docs/articles/assets/poc/poc_zmx_public_verify/04_inspection_scores.png) |
| *↑ 合格条件は照明≥0.75、 | 歪曲 | ≤2 %、RMS≤1 px、 | 倍率色 | ≤1 px、MTF≥0.2、傷 contrast≥0.1。* |
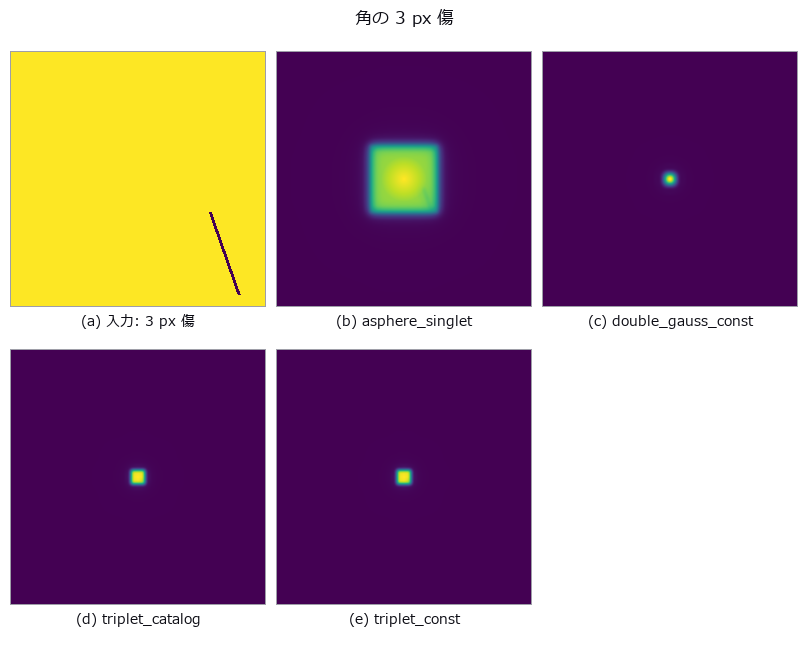
↑ 出力から測った傷 contrast は -0.424〜-0.397。

↑ 光線座標の門とは別に、軸外 OPD は最大 36.22 % 違う。
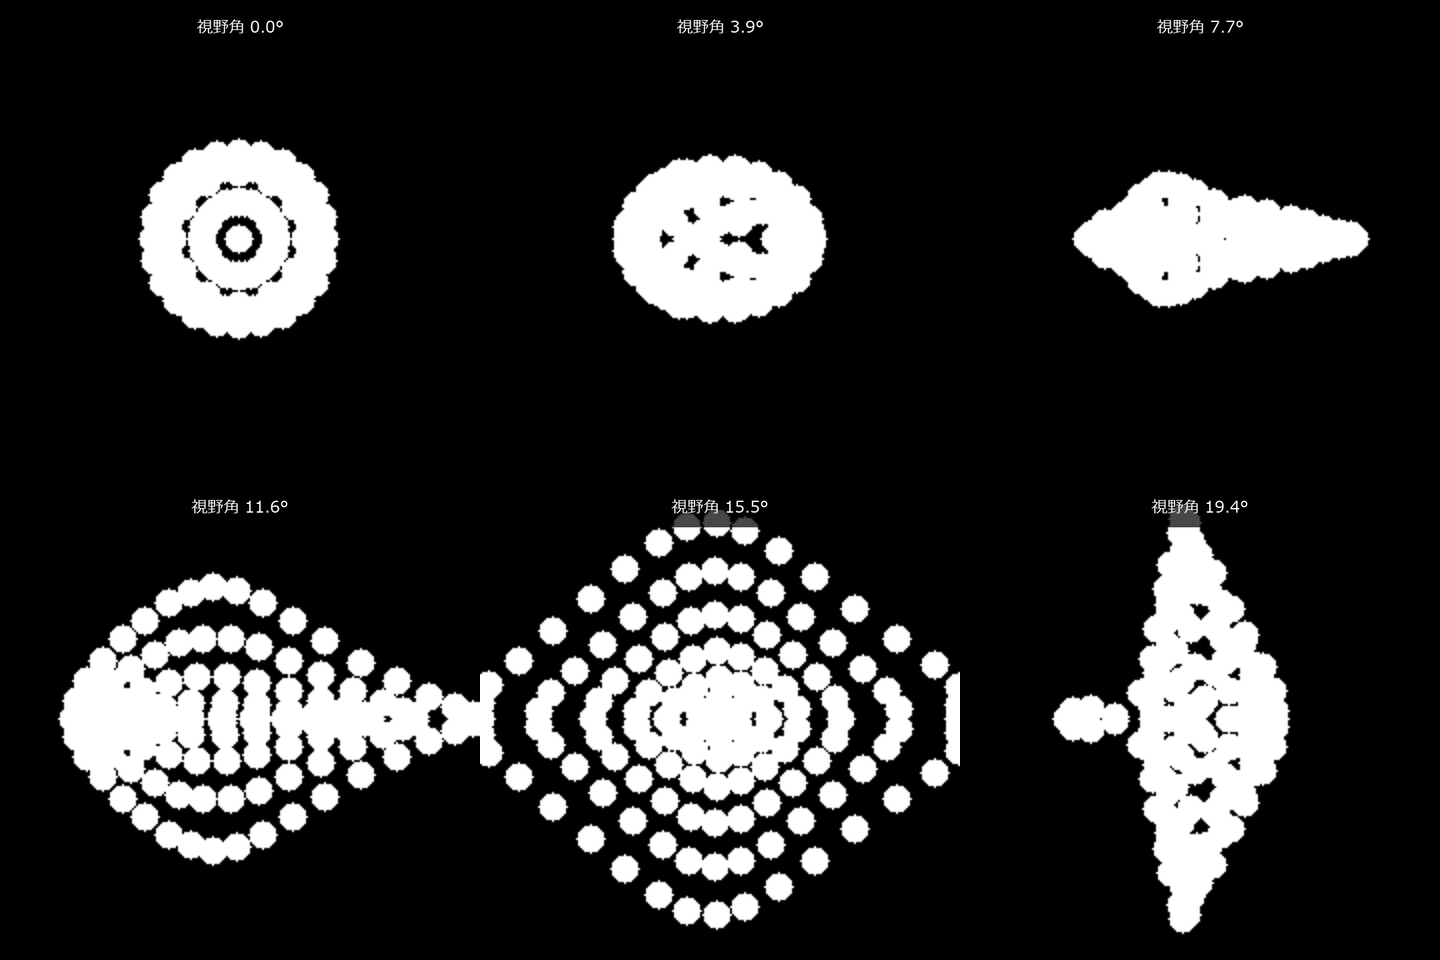
↑ The animation ―― 同じ処方のスポットを軸上から最大視野まで掃引する。
py -3.11 examples/poc_zmx_public_verify.py
Source: examples/poc_zmx_public_verify.py
This run produced 9 figures in total - see them all
Ops used (notes): chromatic_shift · distortion_map · lens_file_read · paraxial_trace · psf_from_opd · psf_to_mtf · ray_bundle · render_through_lens · spot_stats
The Forensics and Documents Wing — One Successful Image Is Not Evidence
Forgery detection and document rectification. Both tend to be presented through ‘the one image where it was found’ or ‘the one page that came out straight’. The 5 exhibits here fix the paste location and quality, the homography and the lighting themselves, then score with a per-pixel ROC and pixel-level geometric error.
The forgery exhibit is on the detection (defensive) side. Forgeries are generated only because scoring a detector needs ground truth, and the generator is kept to the crudest form possible. What the exhibit shows most strongly is the fact that works against the detector: one press of the save button weakens every cue.
The document exhibit puts a number on a hole: two functions with the same name and different models can be swapped without an exception, returning a plausible picture with the keystone still in it. Shadow removal has no free lunch; the flatter the paper, the more of the faint text disappears.
No.2026.015 —— Straightening a Hand-Held Document Photo — Keystone Correction and Shadow Removal Against Ground Truth
A document imaged under a known homography and lighting, rectified, and scored by corner and grid error in pixels. The estimate reaches a grid RMS of 1.091 px (doing nothing: 37.376 px), but swapping in the same-named function with a different model (affine) is 32x worse and raises no exception. Shadow strength 0.45 gives a corner RMS of 6.81 px; 0.55 gives 66.06 px — a cliff.
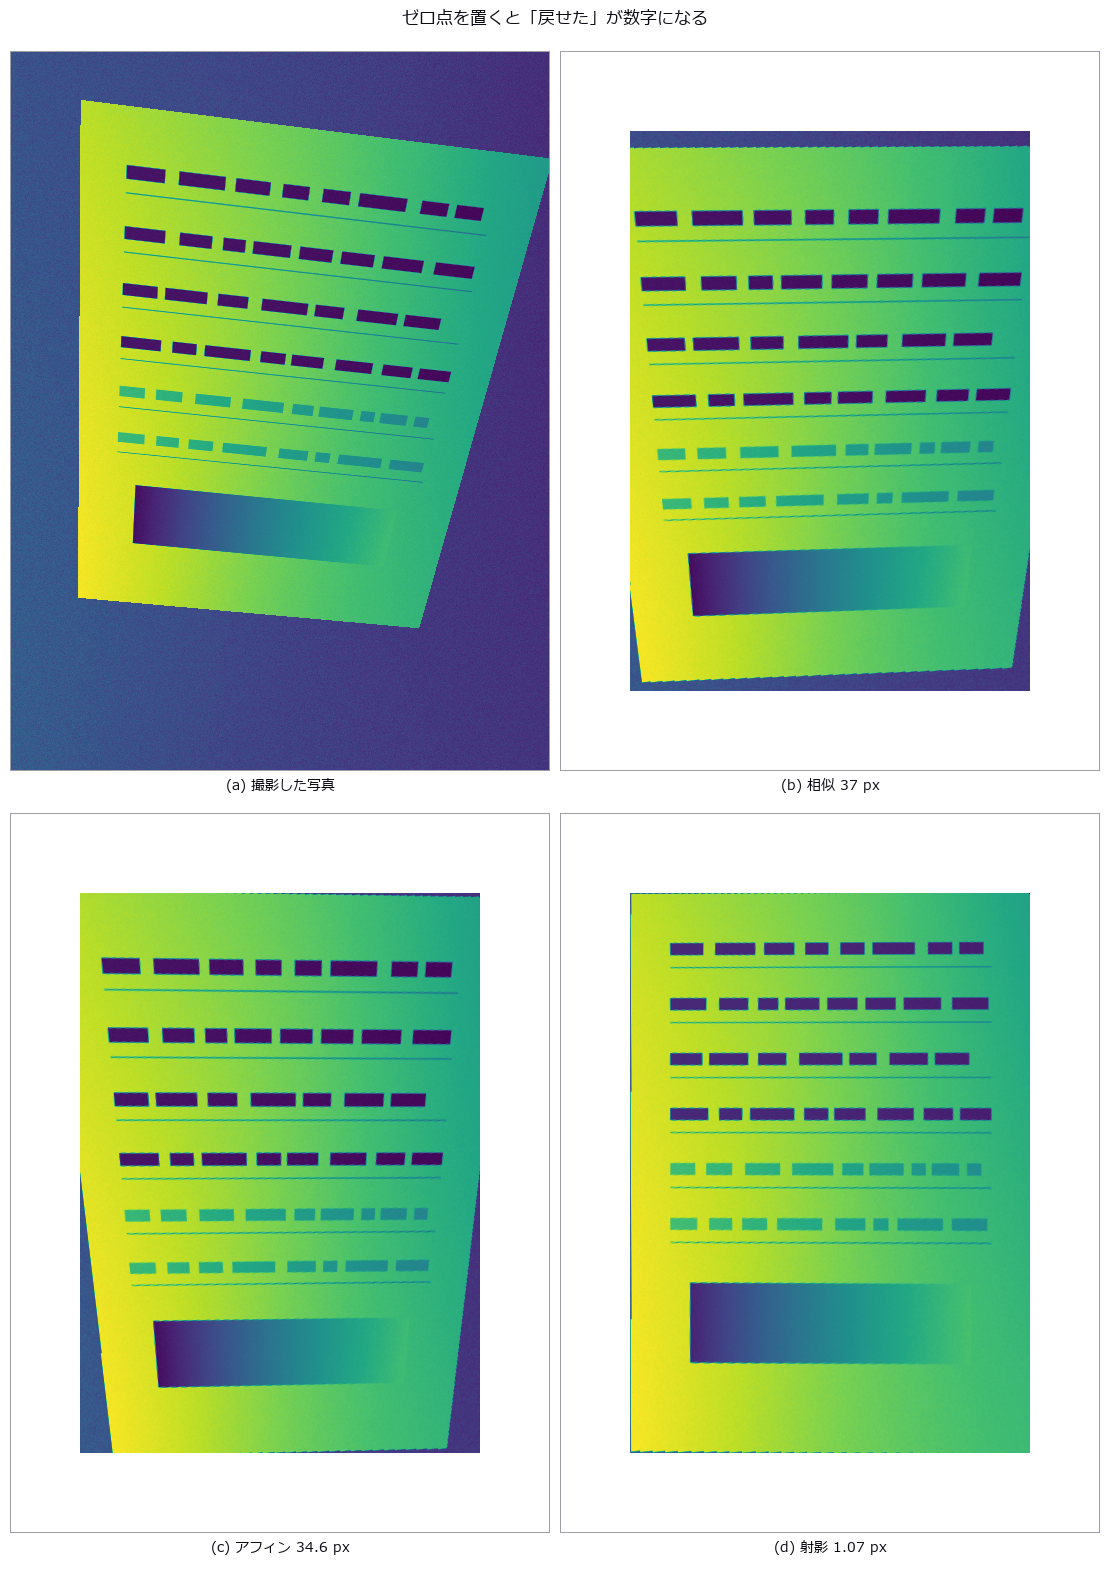
↑ Straightening a Hand-Held Document Photo — Keystone Correction and Shadow Removal Against Ground Truth ―― A document imaged under a known homography and lighting, rectified, and scored by corner and grid error in pixels. The estimate reaches a grid RMS of 1.091 px (doing nothing: 37.376 px), but swapping in the same-named function with a different model (affine) is 32x worse and raises no exception. Shadow strength 0.45 gives a corner RMS of 6.81 px; 0.55 gives 66.06 px — a cliff.
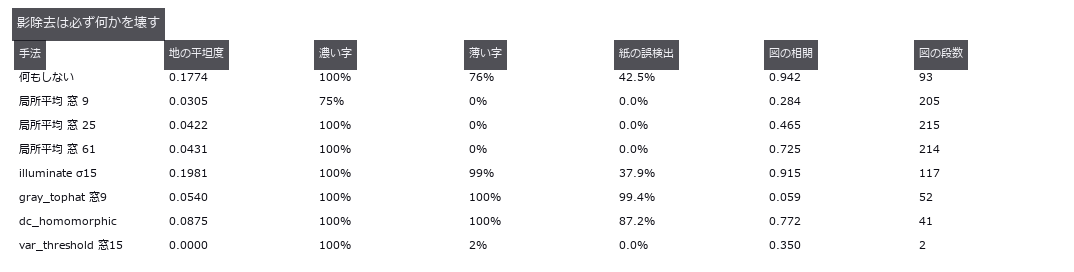
↑ The measurement ―― 平坦・薄字・誤検出なしを同時に満たす行は 1 つも無い。窓 9 が fs.op で届く上限、窓 61 は自前。図の階調は真値で 217 段。 (figure labels are in Japanese; the numbers are the same)
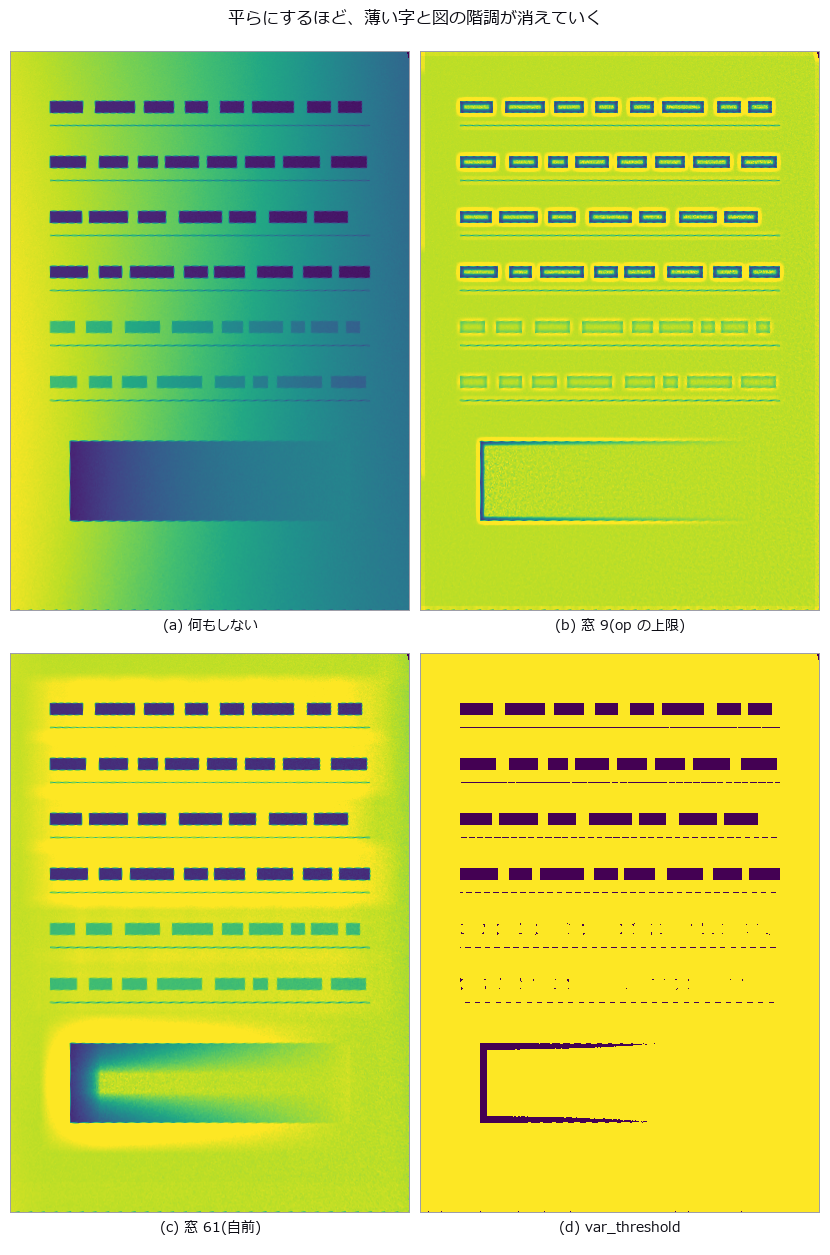
↑ 下寄りの横長の帯が図の階調。
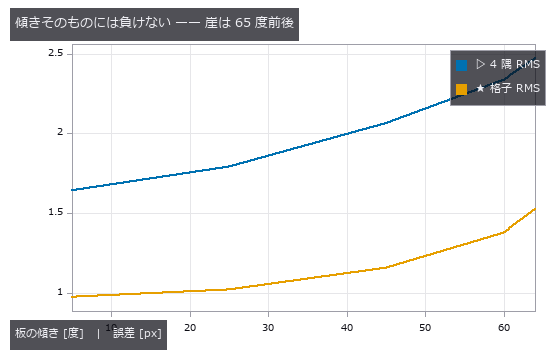
↑ 60 度でも 2 px 台。
py -3.11 examples/poc_document_scan.py
Source: examples/poc_document_scan.py
This run produced 4 figures in total - see them all
Ops used (notes): corner_response · dc_homomorphic · fill_holes · gauss_filter · get_region_contour · gray_tophat · illuminate · illumination_field · image_to_world_plane · mean_image · opening_circle · otsu · project_points · reflect · select_largest · sobel_dir · var_threshold · vector_to_similarity
No.2026.020 —— Forgery Detection as an ROC (true-positive versus false-positive curve) — Not the One Image Found, but Detection at a Fixed False-Positive Rate
Ten forgeries made by pasting a JPEG q60 patch onto a q92 background and saving at q95, scored with a per-pixel ROC (true-positive versus false-positive curve). ELA’s single number points the opposite way from the textbook (paste / background = 0.58x), and an untouched image still yields an AUC of 0.797 from position bias alone. The ghost-valley depth reaches an AUC of 0.997, which falls to 0.975 after one whole-image recompression at q75.

↑ Forgery Detection as an ROC (true-positive versus false-positive curve) — Not the One Image Found, but Detection at a Fixed False-Positive Rate ―― Ten forgeries made by pasting a JPEG q60 patch onto a q92 background and saving at q95, scored with a per-pixel ROC (true-positive versus false-positive curve). ELA’s single number points the opposite way from the textbook (paste / background = 0.58x), and an untouched image still yields an AUC of 0.797 from position bias alone. The ghost-valley depth reaches an AUC of 0.997, which falls to 0.975 after one whole-image recompression at q75.
Terms: ROC — A curve of true-positive rate against false-positive rate as the decision threshold varies, showing a binary detector’s trade-off.
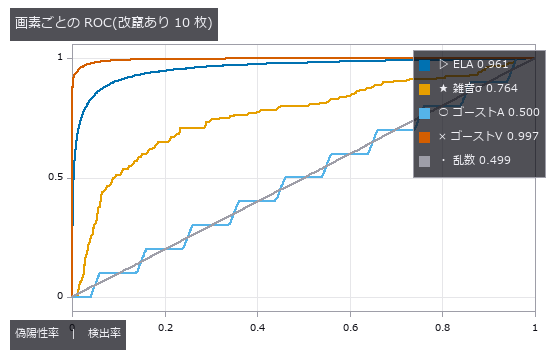
↑ The measurement ―― 凡例の数字は AUC。乱数が対角線に乗ることで測り方に偏りが無いと言える。ゴーストA は乱数と重なる。 (figure labels are in Japanese; the numbers are the same)
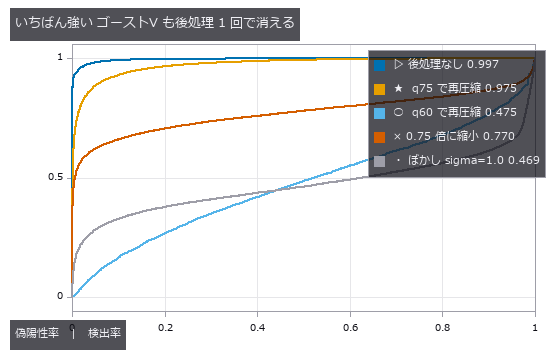
↑ 凡例の数字は AUC。
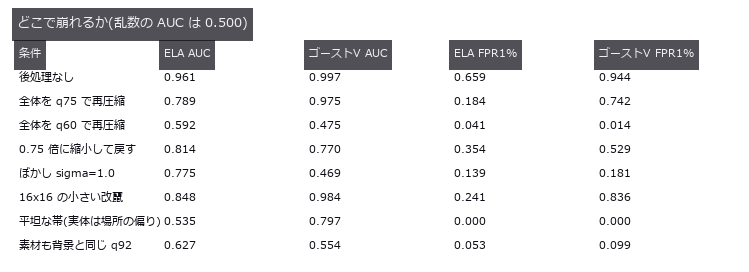
↑ 保存ボタン 1 回(q60 再圧縮)で ゴーストV は乱数以下。
py -3.11 examples/poc_forensics_roc.py
Source: examples/poc_forensics_roc.py
This run produced 4 figures in total - see them all
Ops used (notes): copy_move_regions · error_level_map · jpeg_ghost_map · jpeg_ghost_quality · noise_inconsistency_map · reflect
No.2026.067 —— Craquelure networks — of three indicators, only junction degree breaks under imaging conditions
A Voronoi crack network is drawn in closed form for two ground-truth types — drying cracks (small tortuous cells) and age cracks (large grid-like cells) — with paint blotches, varnish gloss, raking light, blur and noise, then measured with a ridge op → skeleton → junction chain. Truth separates the types on all three indicators (cell diameter 18.0 vs 45.2 px, straightness 0.960 vs 1.000, degree-4 fraction 0.20 vs 0.83), yet the age type’s degree-4 fraction drifts toward the drying value under texture (0.87 → 0.64) and raking light (0.70) while diameter and straightness stay put. Both predicted cliffs failed to appear: recall is still 0.696 at 0.15 px width and false positives only 0.382 at texture contrast 0.64. Raking light widens cracks one-sidedly by +0.37 px and shifts the centreline 0.75 px toward the light.
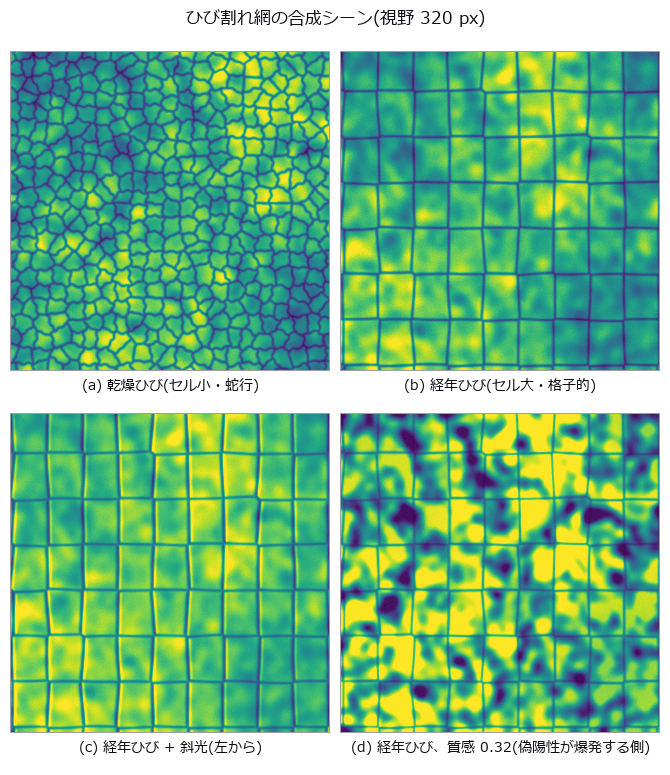
↑ Craquelure networks — of three indicators, only junction degree breaks under imaging conditions ―― A Voronoi crack network is drawn in closed form for two ground-truth types — drying cracks (small tortuous cells) and age cracks (large grid-like cells) — with paint blotches, varnish gloss, raking light, blur and noise, then measured with a ridge op → skeleton → junction chain. Truth separates the types on all three indicators (cell diameter 18.0 vs 45.2 px, straightness 0.960 vs 1.000, degree-4 fraction 0.20 vs 0.83), yet the age type’s degree-4 fraction drifts toward the drying value under texture (0.87 → 0.64) and raking light (0.70) while diameter and straightness stay put. Both predicted cliffs failed to appear: recall is still 0.696 at 0.15 px width and false positives only 0.382 at texture contrast 0.64. Raking light widens cracks one-sidedly by +0.37 px and shifts the centreline 0.75 px toward the light.
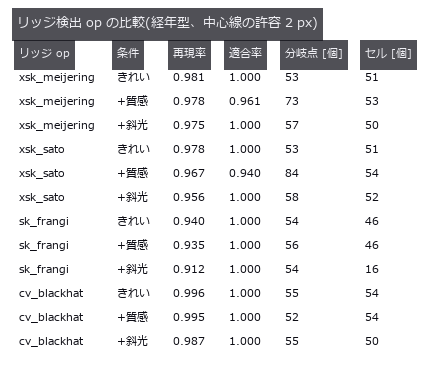
↑ The measurement ―― Frangi は分岐点で応答が落ち、斜光でセルが崩れる。 (figure labels are in Japanese; the numbers are the same)
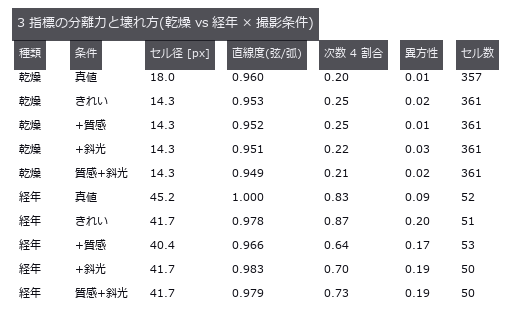
↑ 真値は幾何(ボロノイの頂点・辺)から。
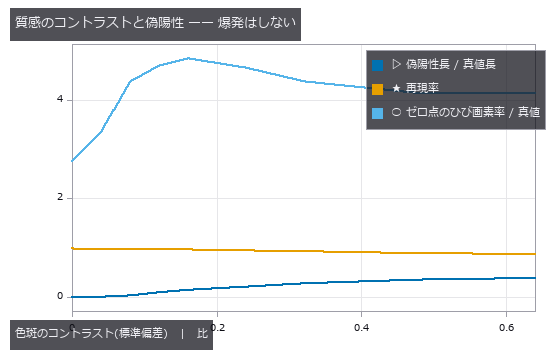
↑ ひびの深さ 0.55。
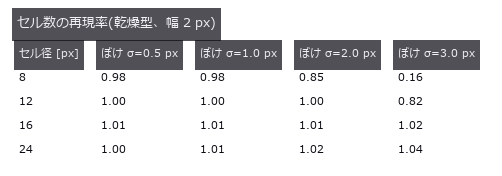
↑ ぼけが大きいほど小さいセルから消える。
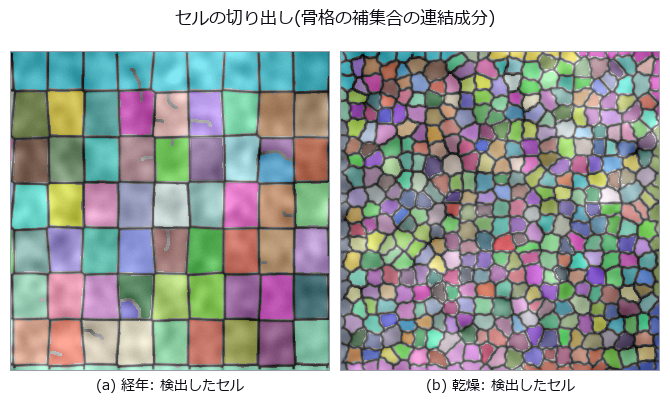
↑ 縁に触れるセルは統計から外す(真値も同じ規約)。
py -3.11 examples/poc_fresco_craquelure.py
Source: examples/poc_fresco_craquelure.py
This run produced 11 figures in total - see them all
Ops used (notes): blob_features · blob_label · blob_overlay · cv_blackhat · distance_transform · hx_split_skeleton_region · hysteresis_threshold · junctions_skeleton · otsu · pruning · r2_endpoints_skeleton · sk_area_opening · sk_frangi · sk_otsu · skeleton · threshold · xsk_meijering · xsk_sato
No.2026.077 —— Camera Fingerprints (PRNU): Which Camera Took This? — The Fingerprint Grows With Frame Count and Dies at the Save Button
Two virtual cameras carry a fixed sensitivity pattern K; the fingerprint is estimated from 30 residuals and matched. Under clean conditions the same camera scores a median PCE of 2192 against 15.7 for the other (AUC 1.000), but JPEG-like quantisation at quality 50 cuts PCE to 3.6 % and a 0.5x downscale to 1.5 % — and what killed it was the residual extractor, not the geometry. A camera with K = 0 still yields a ‘fingerprint’ with PCE 1706 if the same background is shot 30 times: the scene turns into a fingerprint.
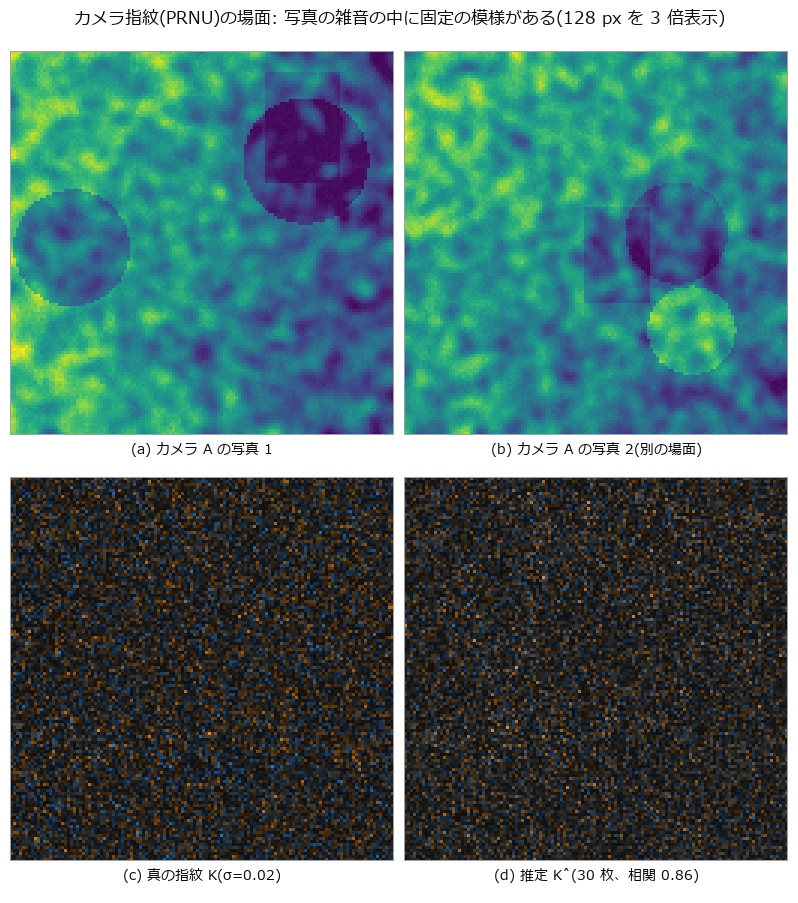
↑ Camera Fingerprints (PRNU): Which Camera Took This? — The Fingerprint Grows With Frame Count and Dies at the Save Button ―― Two virtual cameras carry a fixed sensitivity pattern K; the fingerprint is estimated from 30 residuals and matched. Under clean conditions the same camera scores a median PCE of 2192 against 15.7 for the other (AUC 1.000), but JPEG-like quantisation at quality 50 cuts PCE to 3.6 % and a 0.5x downscale to 1.5 % — and what killed it was the residual extractor, not the geometry. A camera with K = 0 still yields a ‘fingerprint’ with PCE 1706 if the same background is shot 30 times: the scene turns into a fingerprint.
Terms: PRNU — Spatial pixel-to-pixel variation in an image sensor’s response under uniform illumination.; PCE — A camera-fingerprint matching score that normalizes the main correlation peak by the correlation energy away from that peak.
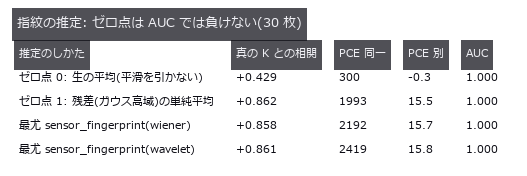
↑ The measurement ―― 場面が毎枚違えば生の平均でも指紋は出る。差は PCE の桁に出る。 (figure labels are in Japanese; the numbers are the same)
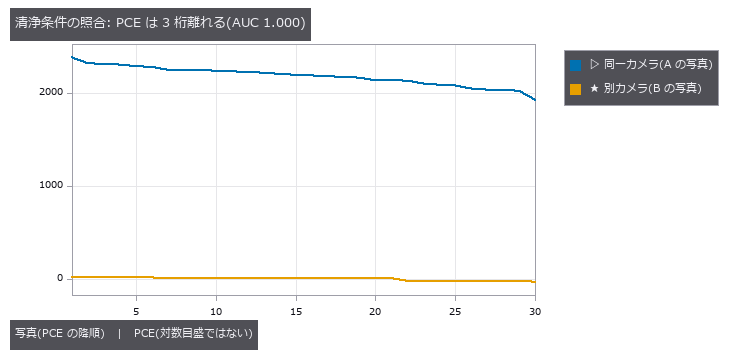
↑ 別カメラのピークは毎回別の位置に立つ((0,0) は 0/30)。

↑ この回の図

↑ 幾何の上限 = K 自身を同じ往復に通した相関²。
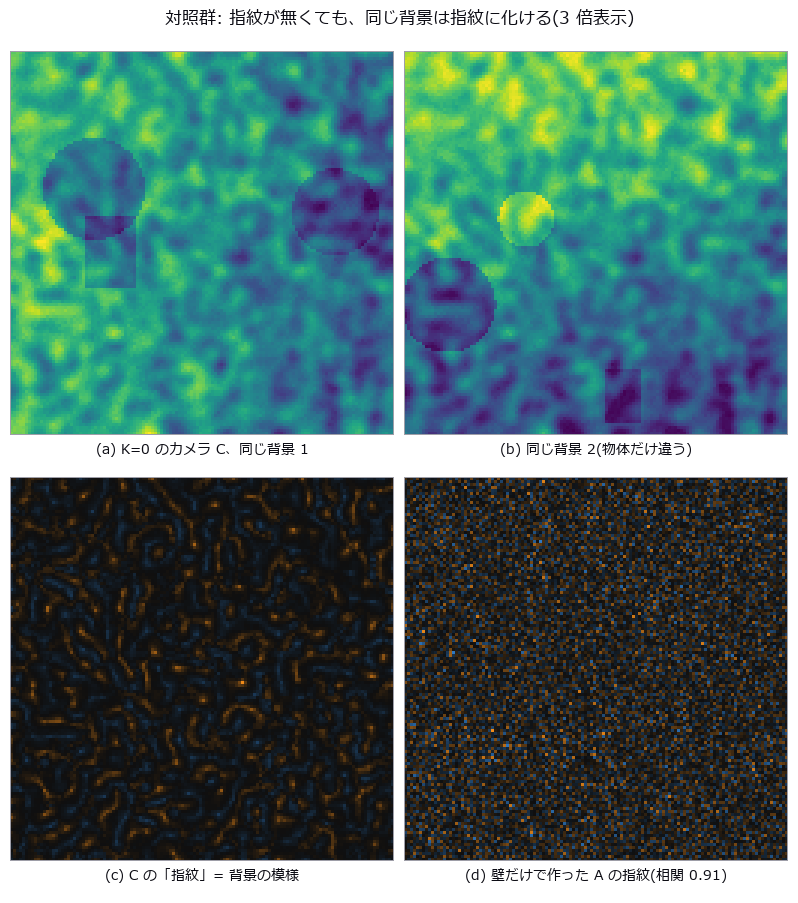
↑ この回の図
py -3.11 examples/poc_prnu_camera_fingerprint.py
Source: examples/poc_prnu_camera_fingerprint.py
This run produced 12 figures in total - see them all
Ops used (notes): aug_jpeg_blocks · evidence_quantile · fingerprint_correlate · gauss_image · median_image · null_distribution · reflect · sensor_fingerprint · sk_nlm · sk_tv · sk_wavelet · xsp_dct_denoise · xsp_wiener
No.2026.276 —— Physical Consistency of Footage — Ballistic or Thrusted, and Was the Clock Stretched?
A synthetic car box filmed by a monocular camera 45 m away (960 × 540, 30 fps, one pixel ≈ 7.5 cm) is tracked by its bounding box and scaled by the known car size; the planar track sits 2.8 cm (median) from the truth. Fitting gravity + drag against gravity + drag + constant thrust and choosing by the AIC difference classifies 79 of 80 clips (40 ballistic, 40 thrusted): thrusted ΔAIC is at least 382, while one ballistic clip reaches 10.4 and is misjudged (noise alone scatters around −4 with a χ² width). Thrust magnitude comes back with a median estimate/truth ratio of 1.022, and 2.5 % of g (0.25 m/s²) is still visible with a median ΔAIC of 79. Stretching the clock by k makes g look like g/k², so k is inverted in closed form: at most 0.32 % error for k in [0.5, 4], position 1.000 against a 200-clip clean null, and 2 false positives in 100 further clean clips. A ballistic clip slowed 1.5× reads as an upward thrust of 5.46 m/s² (closed form g(1 − 1/k²) = 5.45): vertical thrust and time stretch are degenerate in a monocular view. No learning, no real footage.

↑ Physical Consistency of Footage — Ballistic or Thrusted, and Was the Clock Stretched? ―― A synthetic car box filmed by a monocular camera 45 m away (960 × 540, 30 fps, one pixel ≈ 7.5 cm) is tracked by its bounding box and scaled by the known car size; the planar track sits 2.8 cm (median) from the truth. Fitting gravity + drag against gravity + drag + constant thrust and choosing by the AIC difference classifies 79 of 80 clips (40 ballistic, 40 thrusted): thrusted ΔAIC is at least 382, while one ballistic clip reaches 10.4 and is misjudged (noise alone scatters around −4 with a χ² width). Thrust magnitude comes back with a median estimate/truth ratio of 1.022, and 2.5 % of g (0.25 m/s²) is still visible with a median ΔAIC of 79. Stretching the clock by k makes g look like g/k², so k is inverted in closed form: at most 0.32 % error for k in [0.5, 4], position 1.000 against a 200-clip clean null, and 2 false positives in 100 further clean clips. A ballistic clip slowed 1.5× reads as an upward thrust of 5.46 m/s² (closed form g(1 − 1/k²) = 5.45): vertical thrust and time stretch are degenerate in a monocular view. No learning, no real footage.
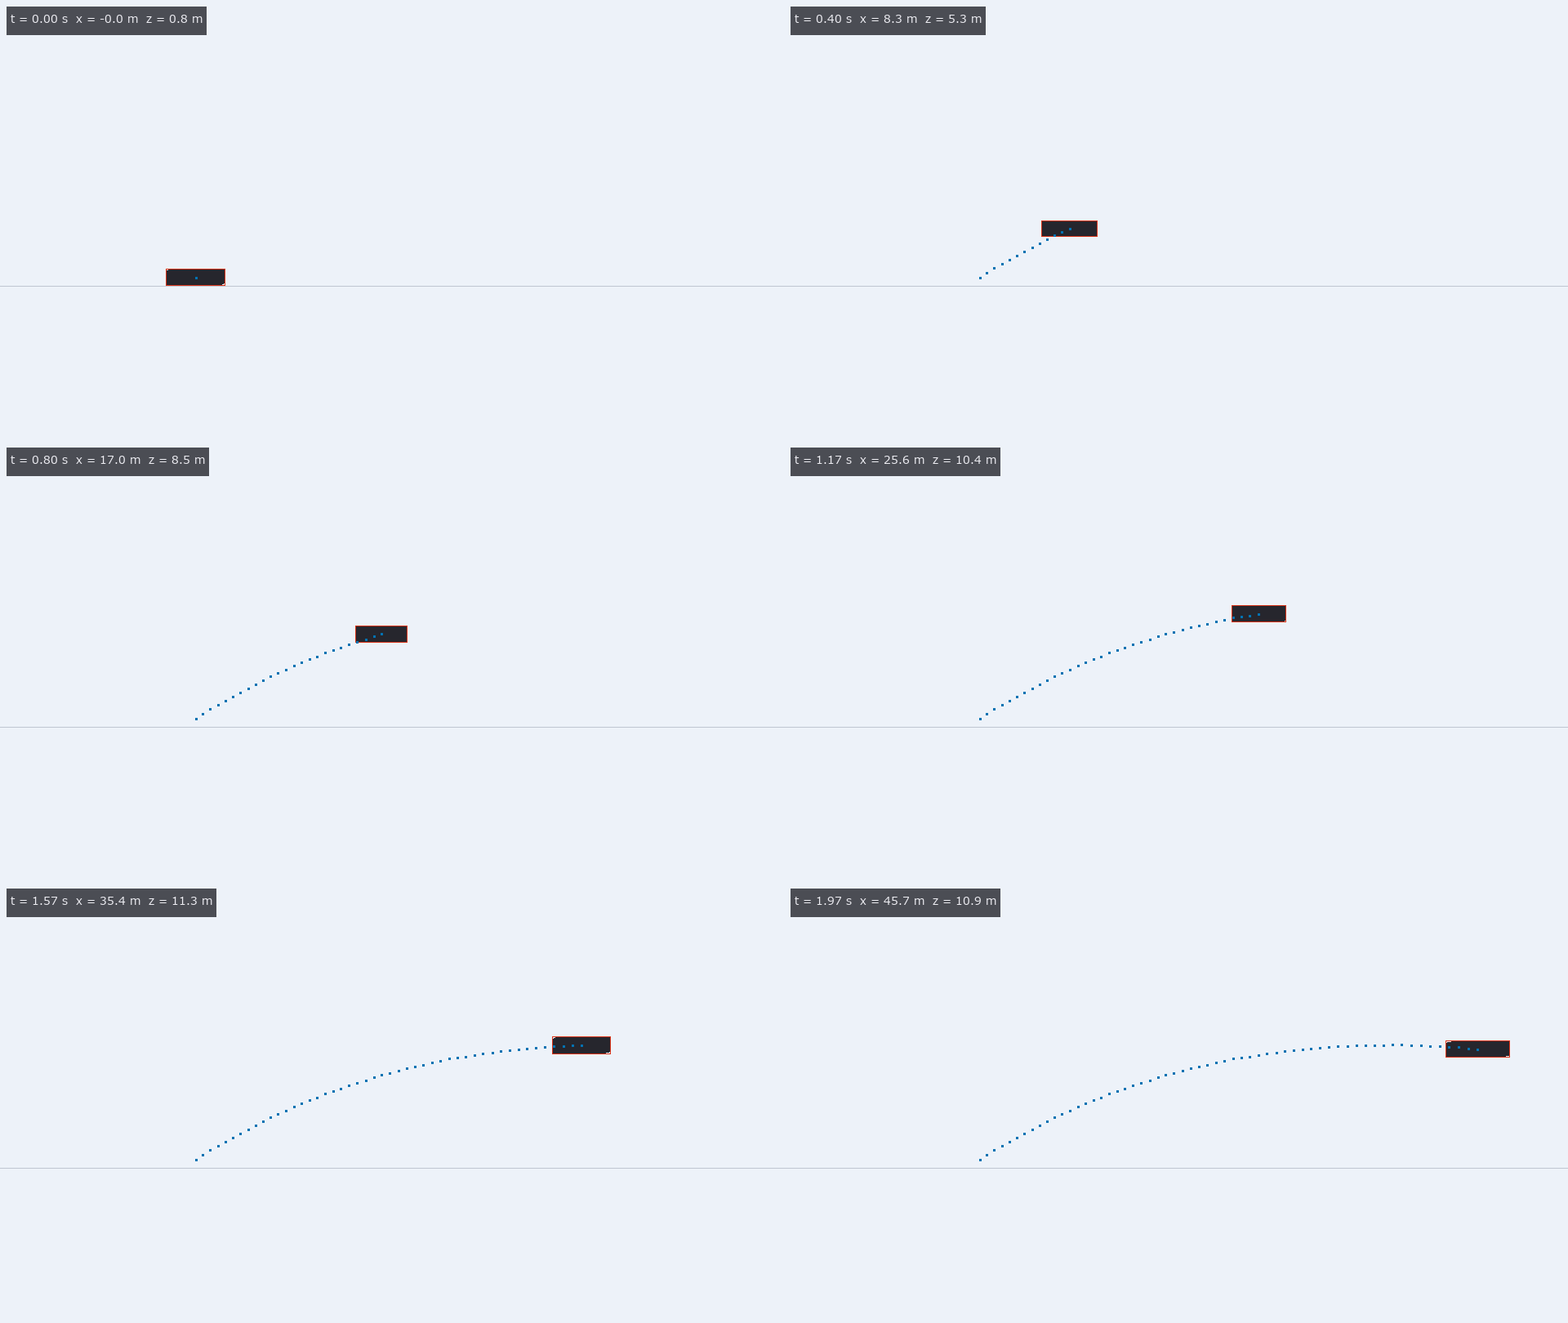
↑ The measurement ―― 推力 4 m/s² の車を 45 m 先の単眼カメラで写した合成映像(960 × 540、30 fps)。箱の影絵と bbox、bbox と車の寸法から起こした位置の軌跡(点)、地面の線。 (figure labels are in Japanese; the numbers are the same)
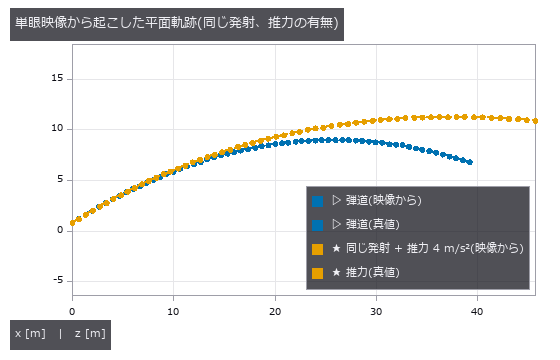
↑ 点は bbox から、破線は世界の真値。

↑ 雑音だけなら ΔAIC は −2Δk = −4 を中心に χ²(2) の幅で散る。

↑ g の 2.5 % の推力でも床の 10 を超える。
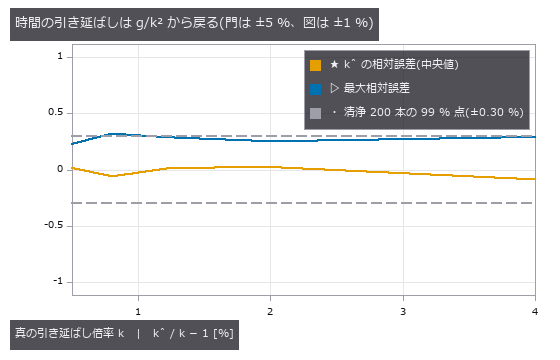
↑ k = √(g_ref / g_fit)。
py -3.11 examples/poc_video_physics_consistency.py
Source: examples/poc_video_physics_consistency.py
This run produced 7 figures in total - see them all
Ops used (notes): aic_from_rss · ball_params · ballistic_vs_thrust · convex_hull · drag_fit · evidence_quantile · fit_parabola · flight_ode · label_extent · null_distribution · project · text_box · thrust_fit · thrust_ode · time_stretch_from_gravity
The 3-D Shape Wing — Align First, and the Alignment Eats the Defect
Work on point clouds and meshes differs from 2-D work in one decisive way: a pose-alignment step comes before the measurement. That step rotates the shape into whatever orientation makes the discrepancy smallest, so the larger the defect, the more of it the alignment absorbs, leaving a small residual and a part that looks in tolerance. The exhibits in this room try to count what the alignment ate.
Every ground truth here is written as a formula. Solids are built from analytic surfaces combined with boolean operations, chosen so that volume, surface area, wall thickness and curvature are known in closed form. Deformations are known fields (a local dent, a warp, a constant wear along the surface normal), poses are known rotations and translations, and the scan is a uniform sample of the surface with a known density, noise level and occlusion pattern. That is what makes it possible to hold the alignment error and the shape error apart.
The pitfalls specific to 3-D also get counted separately here. A nearest-neighbour distance is biased upward whenever there is noise, because it only ever counts one side. Normal signs are decided by whatever helper computed them. Changing the point density changes the scale of the distance itself. A symmetric shape has no unique pose. Each of these disappears the moment the numbers are folded into one.
No.2026.054 —— Battery cell degradation by CT — the swelling shows outside, the cause stays inside
Battery cells with the same exterior can hide different causes of swelling or voiding. Known defects were put into stacked electrodes and imaged by CT; only 29.4 % of electrode swelling reached the outside. Cells with matching can heights separate internally, so outside dimensions cannot identify the cause.
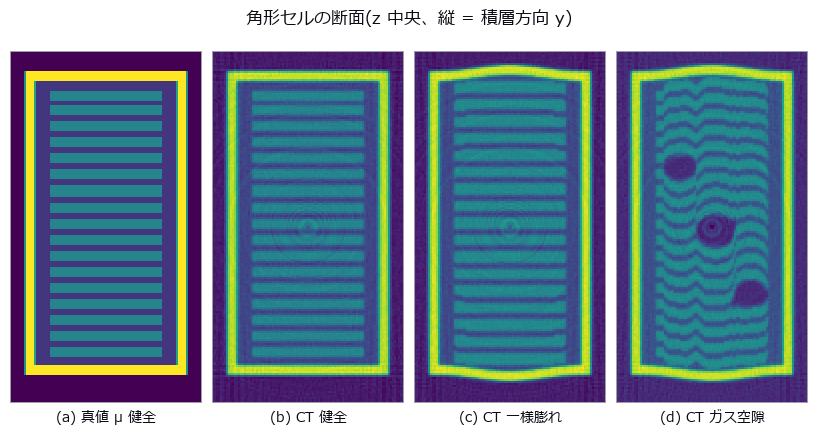
↑ Battery cell degradation by CT — the swelling shows outside, the cause stays inside ―― A prismatic lithium-ion cell — stacked electrodes inside an aluminium can — is built with ground truth, degraded by known fields (uniform swelling, local swelling, inter-layer gas voids, electrode misalignment), and then imaged for real: forward projection, beam hardening, photon noise and FBP (filtered back-projection) reconstruction. Only 29.4 % of a 10 % electrode swelling reaches the outside, and a caliper across the centre reads 3.6 times the volume-equivalent mean (+0.235 vs +0.066 mm). Three cells tuned to the same external bulge differ by 0.000 mm in can height yet separate internally (void fraction 0.00 vs 5.20 %, layer flatness 0.0156 vs 0.0784 mm), and the resolution cliff for those internal numbers is set by the 0.120 mm inter-layer gap, not the 0.200 mm electrode — voxel/thickness = 0.30, where the sampling-theorem prediction said 0.80.
Terms: FBP — A tomographic reconstruction method that filters projection data and then back-projects it over all measured angles.
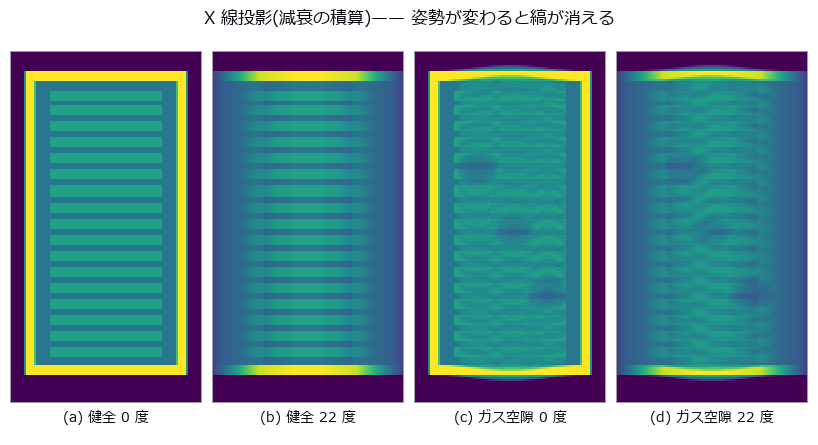
↑ The measurement ―― 真正面(0 度)なら空隙の影までは見える。ただし奥行きに積算されているので厚みも深さも出ない。22 度傾けると層の縞そのものが重なって消える —— 投影では姿勢が結果を決めてしまう。だから断層に落とす。 (figure labels are in Japanese; the numbers are the same)
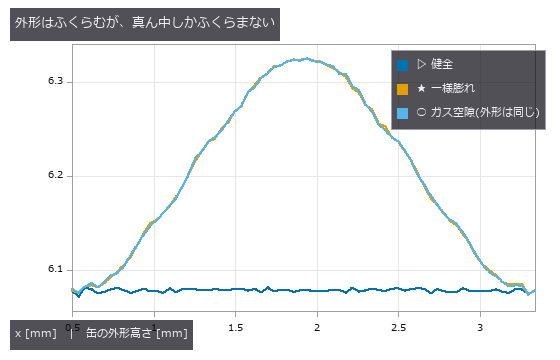
↑ 端板は周辺で固定なので中央だけが出る。
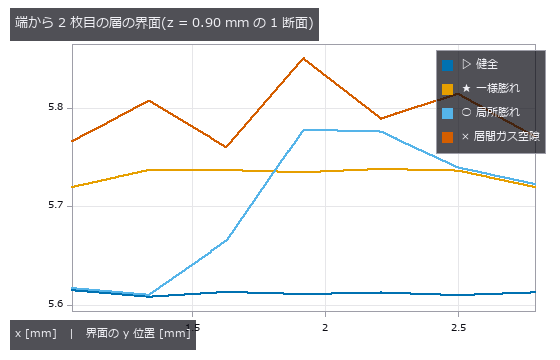
↑ 一様膨れは平らなまま上がる。
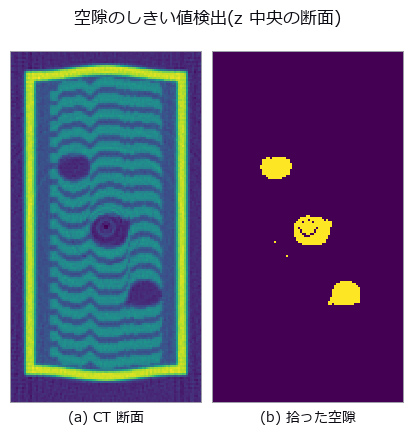
↑ この回の図

↑ 空隙体積は崖の手前から単調に痩せる(部分体積効果)。
py -3.11 examples/poc_battery_ct_degradation.py
Source: examples/poc_battery_ct_degradation.py
This run produced 16 figures in total - see them all
Ops used (notes): beam_hardening_apply · box_sdf · fbp_volume · grid_coords · plane_sdf · projection_angles · radon_volume · render_volume_projection · ring_artifact_apply · sdf_intersect · sdf_subtract · sdf_to_occupancy · sdf_union · vol_bounding_box · vol_edge_probe · vol_fft_lowpass · vol_label · vol_profile_line · vol_region_props · vol_resize · vol_wall_thickness
No.2026.056 —— Fusing two sensors into a bird’s-eye grid — a calibration that passes in pixels turns into metres at range
For distant vehicles, a small image calibration error becomes a physical shift in a bird’s-eye map. Opposite-side range sensors were fused on one grid, tracing the reprojection shift at 22 m. Complementary views create the gain, but growing yaw error makes fusion worse than one sensor.

↑ Fusing two sensors into a bird’s-eye grid — a calibration that passes in pixels turns into metres at range ―― An analytic street scene (a tall lead truck, plus two distant cars each hidden in the other sensor’s shadow) is fused from a left-mirror LiDAR (laser ranging) and a right-mirror depth camera into one bird’s-eye grid, then swept over rotation, translation and timing errors in the extrinsics. Fusion reaches an occupancy IoU of 0.7033 against 0.5417 for the best single sensor — and every bit of that gain comes from complementary visibility, not accuracy. One pixel of reprojection error becomes 0.083 m at 22 m; the cliff is set by the object width, not the 0.2 m cell (IoU drops only 5.8 % when 68 % of the points have already crossed a cell); by 3 deg of yaw the fusion has fallen below the single sensor.
Terms: LiDAR — A sensor that measures range using laser light, commonly by time of flight, to produce a three-dimensional point cloud.; IoU — A 0-to-1 overlap score equal to the area of the intersection of two regions divided by the area of their union.

↑ The measurement ―― 横に 1.80 m 離した 2 センサの「自由と言い切れた領域」。青い帯が LiDAR にしか見えない所、橙の帯がカメラにしか見えない所、灰色は両方。白は真値の障害物。22 m の 2 台は互いの影に 1 台ずつ入っている。 (figure labels are in Japanese; the numbers are the same)
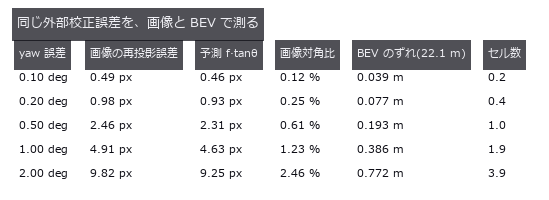
↑ 画像 320 x 240 px、焦点距離 265 px。
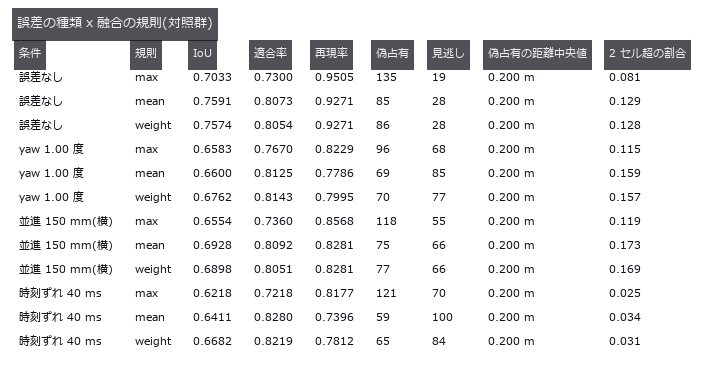
↑ 誤差はカメラ側の外部パラメータにだけ入れる。

↑ LiDAR は 22 m の車を 1 セルも返せない(先行車の陰)。

↑ 水平の 2 本は単センサのゼロ点。
py -3.11 examples/poc_bev_sensor_fusion.py
Source: examples/poc_bev_sensor_fusion.py
This run produced 9 figures in total - see them all
Ops used (notes): box_sdf · closing_circle · depth_to_points · esdf · fill_up · fuse · grid_coords · occupancy_grid · project_points · sdf_to_occupancy · sdf_union · voxel_grid_downsample · voxel_iou
No.2026.058 —— CAD-to-scan deviation inspection — the fit absorbs the defect and invents a dent
Aligning a scan to its design can absorb a defect or move it elsewhere. Known dents and warps were added to a part; even the defect-free control produced 66.5 square mm of false rejected area. Rigid-like deviations shrink, while nearest points jump across edges and create a fictitious dent.
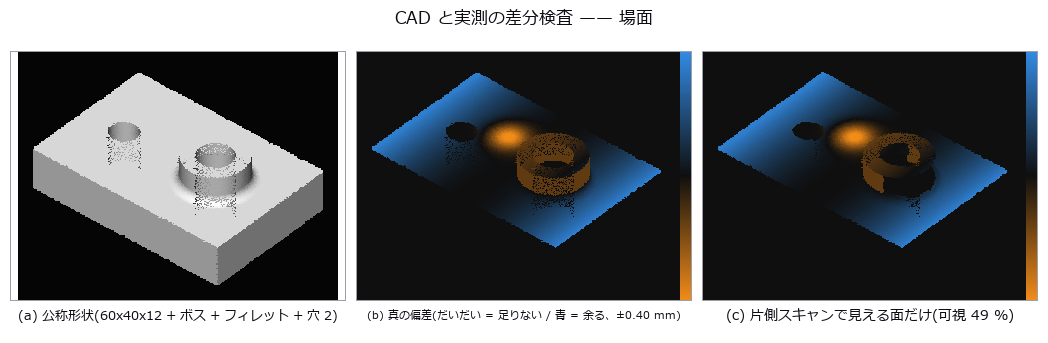
↑ CAD-to-scan deviation inspection — the fit absorbs the defect and invents a dent ―― An analytic machined part carries a known local dent, a bow and a wear band, all applied as exact displacements along the surface normal, and the scan is synthesized with a known pose, noise and one-sided occlusion. After alignment the signed deviation and the out-of-tolerance area show that the local dent is diluted by only 3.7 %, while a 121 um dent appears at the centre of the part where the truth is just 1.2 um (closed form predicts -120 um). What survives depends on how much the defect resembles the six rigid-body degrees of freedom; along the edges the nearest neighbour jumps to the adjacent face, producing 66.5 mm^2 of false out-of-tolerance area even in a defect-free control.
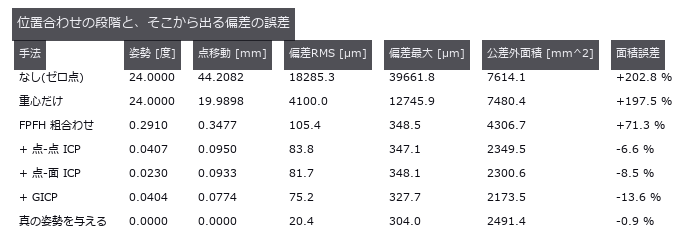
↑ The measurement ―― 真の姿勢を与えた最終行が推定器そのものの床。点-面 ICP との差は姿勢ではなく datum の取り方の差。 (figure labels are in Japanese; the numbers are the same)
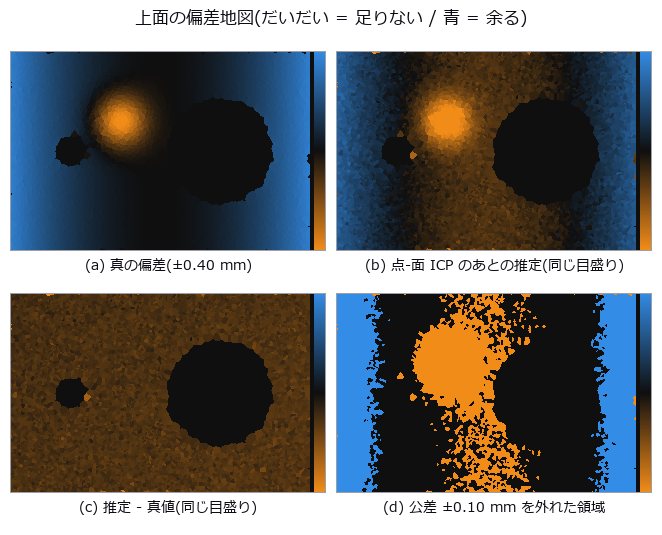
↑ 3 枚目が一様に色づくのが第 6 章の主張 —— 位置合わせが反りの平均を吸って、部品全体が下へずれて読める。
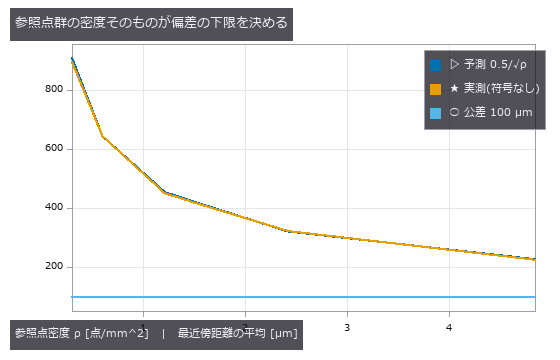
↑ 2 次元 Poisson 点過程の最近傍距離の平均 = 0.5/√ρ。
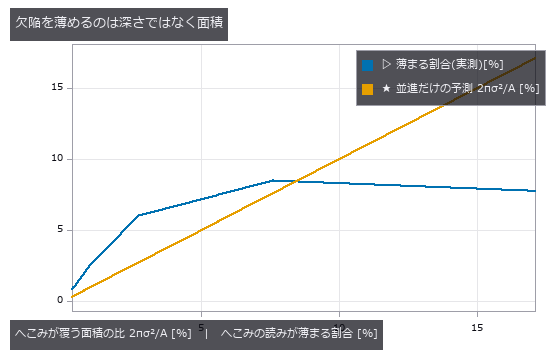
↑ 深さを 30 倍にしても割合は動かないが、広がりを変えると比例して増える。
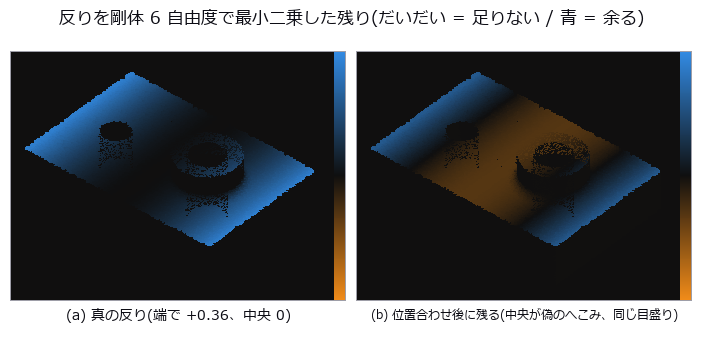
↑ 上面だけを見ている。
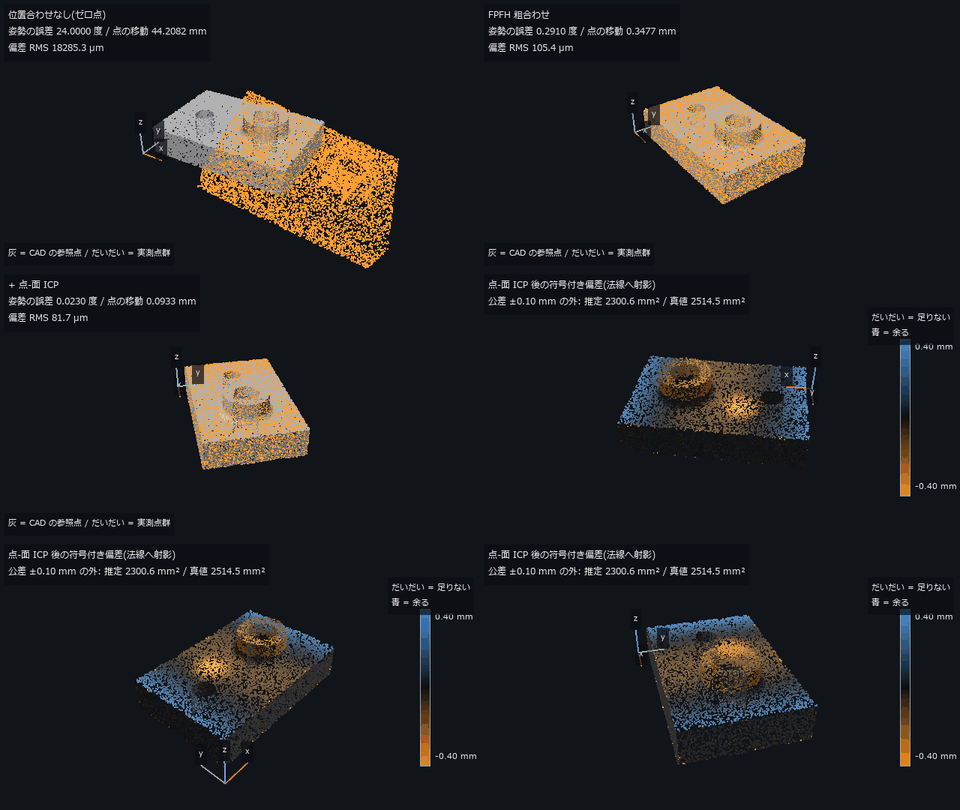
↑ The animation ―― 主図(動画、640 × 360・30 fps・12 秒): 前半は実測点群(だいだい)が CAD の参照点(灰)に重なるまで —— 位置合わせなし → FPFH 粗合わせ → 点-面 ICP の推定姿勢の間を補間して動かす(偏差 RMS 18285.3 → 105.4 → 81.7 µm)。後半は重なった点群を一周し、符号付き偏差(±0.40 mm、だいだい = 足りない / 青 = 余る)で塗る(形が読めるよう陰影を薄く足した)。公差 ±0.10 mm を外れた面積は推定 2300.6 mm²、真値 2514.5 mm²。左手前の 3 本の線は CAD の x・y・z 軸。
py -3.11 examples/poc_cad_scan_deviation.py
Source: examples/poc_cad_scan_deviation.py
This run produced 14 figures in total - see them all
Ops used (notes): box_sdf · chamfer_distance · color_bar · esdf · estimate_normals · estimate_oriented_normals · face_areas · gicp · hausdorff_distance · icp_point2plane · icp_point2point_3d · query_distance · register_fpfh · sphere_sdf · text_box · voxel_grid_downsample
No.2026.063 —— Crop leaf area from above — folded by projection before it is ever hidden
A maize canopy built from analytic leaf surfaces (one-sided area pi/4·L·W, leaf angle and projection coefficient both closed-form) is viewed through an exact nadir z-buffer to measure cover, occlusion and leaf angle. Inverting cover with Beer-Lambert underestimates a true leaf area index of 4.85 by 52.2 % even with the exact extinction coefficient, and stalls just above the ceiling of 2.26 predicted from two-scale clumping (measured 2.70). Occlusion changes nadir cover by not one bit; what breaks the estimate is the folding of projection — an average of 3.49 leaves cover a cell yet are counted once — and quadrupling point density buys only +1.92 in the largest resolvable index.

↑ Crop leaf area from above — folded by projection before it is ever hidden ―― A maize canopy built from analytic leaf surfaces (one-sided area pi/4·L·W, leaf angle and projection coefficient both closed-form) is viewed through an exact nadir z-buffer to measure cover, occlusion and leaf angle. Inverting cover with Beer-Lambert underestimates a true leaf area index of 4.85 by 52.2 % even with the exact extinction coefficient, and stalls just above the ceiling of 2.26 predicted from two-scale clumping (measured 2.70). Occlusion changes nadir cover by not one bit; what breaks the estimate is the folding of projection — an average of 3.49 leaves cover a cell yet are counted once — and quadrupling point density buys only +1.92 in the largest resolvable index.
Terms: Beer–Lambert — The law stating that transmission through a homogeneous absorbing medium decreases exponentially with concentration and optical path length.

↑ The measurement ―― 閉形式 2 pi r h + 4 pi r^2 / pi r^2 h + 4/3 pi r^3 と比べる。2 値化を挟むと面積だけが一方向に膨らむ。 (figure labels are in Japanese; the numbers are the same)

↑ 稈カプセルの符号付き距離場(縦断面、中心が内側 = 負)

↑ 重なりの枚数(遮蔽を無視して全部数えた場合)は真値に乗る。

↑ この回の図
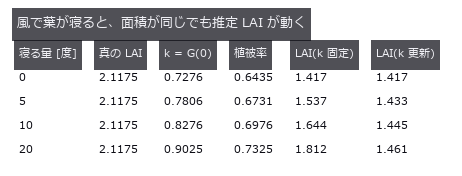
↑ この回の図
py -3.11 examples/poc_crop_phenotyping.py
Source: examples/poc_crop_phenotyping.py
This run produced 17 figures in total - see them all
Ops used (notes): boundary_vertices · capsule_sdf · dem_slope · estimate_normals · face_areas · face_normals · grid_coords · mesh_area · mesh_sample_points · mesh_volume · occupancy_grid · plane_segmentation · render_volume_projection · sdf_to_occupancy
No.2026.064 —— Collapsing joint voids into one number — what the number drops is the shape that matters
A synthetic die-attach bond line carries five void populations whose volume fraction is held exactly at 3.000 % while only their depth, shape and proximity change, re-imaged as an X-ray CT with a PSF (point spread function), noise and beam-hardening cupping. The naive zero point — threshold, then report void fraction — separates the five conditions by only 0.17 points (2.46 to 2.63 %), yet the interface area shadowed by flat voids is 2.09x that of volume-matched spheres (14.49 vs 6.92 %) and the largest cluster spans 13.1x further when the voids are chained (80.0 vs 6.1 %). The predicted cliff never arrives: at 60 um voxels the void fraction still reads 3.21 % (it only wobbles by 1.36 points with the grid phase), while flatness becomes unmeasurable and the interface-deficit metric drops from 14.16 to 9.78 % — the degradation runs toward ‘pass’, which is the worst possible direction.

↑ Collapsing joint voids into one number — what the number drops is the shape that matters ―― A synthetic die-attach bond line carries five void populations whose volume fraction is held exactly at 3.000 % while only their depth, shape and proximity change, re-imaged as an X-ray CT with a PSF (point spread function), noise and beam-hardening cupping. The naive zero point — threshold, then report void fraction — separates the five conditions by only 0.17 points (2.46 to 2.63 %), yet the interface area shadowed by flat voids is 2.09x that of volume-matched spheres (14.49 vs 6.92 %) and the largest cluster spans 13.1x further when the voids are chained (80.0 vs 6.1 %). The predicted cliff never arrives: at 60 um voxels the void fraction still reads 3.21 % (it only wobbles by 1.36 points with the grid phase), while flatness becomes unmeasurable and the interface-deficit metric drops from 14.16 to 9.78 % — the degradation runs toward ‘pass’, which is the worst possible direction.
Terms: PSF — The spatial response of an imaging system to a point object, describing how that point is blurred in the image.

↑ The measurement ―― 疑似カラーはラベル番号を並べ替えたもの。側面図で界面(上端)に貼りついているのが見える。 (figure labels are in Japanese; the numbers are the same)

↑ ボイド率の列だけを見ると 5 条件は区別できない。

↑ 界面欠損率は 球/中央/散 0.0 % / 球/界面/散 6.9 % / 扁平/界面/散 14.5 % / 球/中央/連 0.0 % / 扁平/界面/連 14.7 % —— 体積率が同じでも 0 から 14.7 % まで動く。

↑ 60 µm では扁平度が測れない(nan なので描けない)。

↑ 塊の数が 24 から落ちた瞬間、最近接間隔は『隣のボイドまで』から『隣の鎖まで』に黙って入れ替わる。
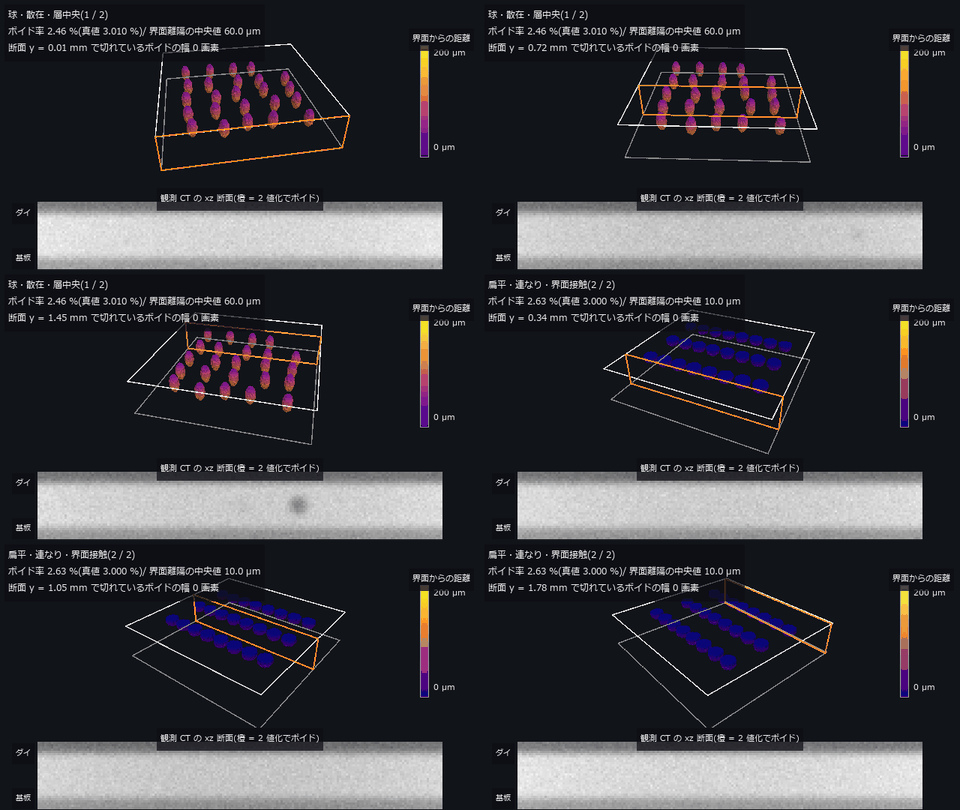
↑ The animation ―― 主図(動画、640 × 360・30 fps・11 秒): 同じボイド率の 2 条件(球・散在・層中央 2.46 % / 扁平・連なり・界面接触 2.63 %)で、xz 断面(橙の枠)を y 方向に掃引しながら 3-D のボイド(2 値化の結果を marching cubes で面に)を回す。色はダイ側界面までの距離 —— 前者は層の中ほど(界面離隔の中央値 60.0 µm)、後者は界面に貼りつく(10.0 µm)。下は同じ断面の観測 CT(上 = ダイ)。合否の 1 個の数字(ボイド率)は 2 つを分けない。z は画面上だけ 2 倍。
py -3.11 examples/poc_ct_void_morphology.py
Source: examples/poc_ct_void_morphology.py
This run produced 13 figures in total - see them all
Ops used (notes): boundary_vertices · box_sdf · color_bar · cylinder_sdf · esdf · face_areas · mesh_volume · morph_dilate3d · plane_sdf · query_distance · sdf_union · sphere_sdf · text_box · vol_boundary_points · vol_gaussian_psf · voxel_to_mips
No.2026.065 —— Manufacturability from geometry alone — faces that sit on the threshold flip when you smooth them
A synthetic part with known design values (thin walls, a slot, ribs near 45 deg, holes) is voxelised, then wall thickness, support area and tool clearance are measured. Across the 45 deg threshold the support area jumps 185.22 -> 576.10 mm^2 — 3.11x for 0.2 deg — and that step vanishes entirely when the isosurface is taken from a distance field, and loses 12 % under smoothing. Thickness collapses onto a 2-voxel lattice (the inscribed sphere does not help), and clearance errors go both ways: at 0.500 mm voxels the slot appears 2.000 mm wide and admits a tool that does not fit.
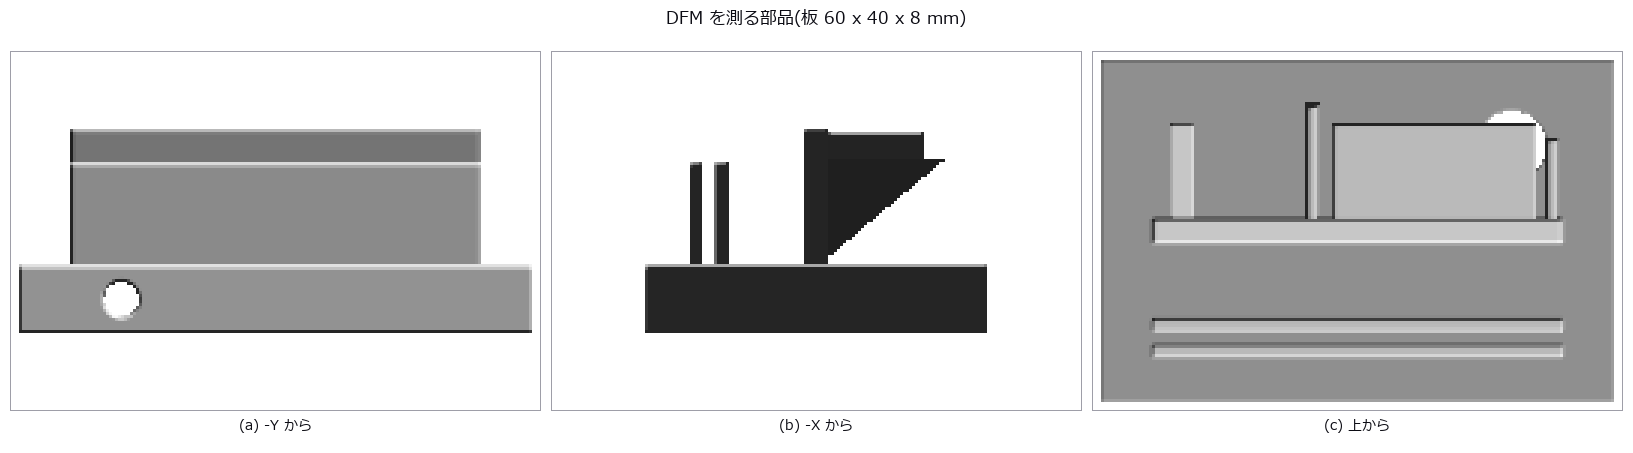
↑ Manufacturability from geometry alone — faces that sit on the threshold flip when you smooth them ―― A synthetic part with known design values (thin walls, a slot, ribs near 45 deg, holes) is voxelised, then wall thickness, support area and tool clearance are measured. Across the 45 deg threshold the support area jumps 185.22 -> 576.10 mm^2 — 3.11x for 0.2 deg — and that step vanishes entirely when the isosurface is taken from a distance field, and loses 12 % under smoothing. Thickness collapses onto a 2-voxel lattice (the inscribed sphere does not help), and clearance errors go both ways: at 0.500 mm voxels the slot appears 2.000 mm wide and admits a tool that does not fit.
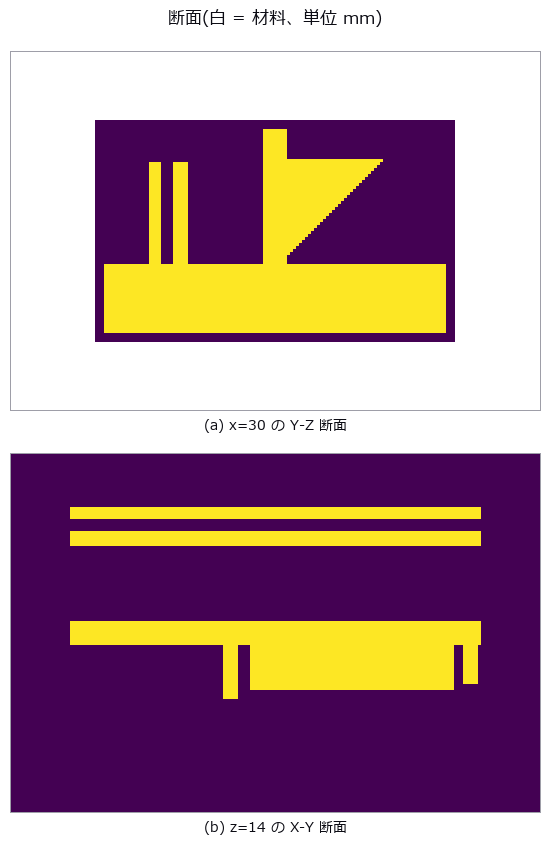
↑ The measurement ―― 上: 左端の 2 本が薄壁(1.500 mm)とそのあいだのスロット(1.500 mm)、右の三角が補強。下: リブと薄壁の footprint。 (figure labels are in Japanese; the numbers are the same)
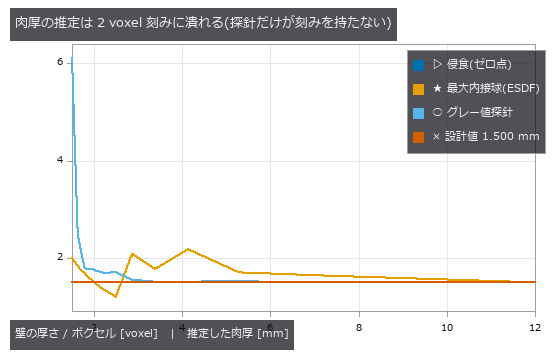
↑ 右ほど粗い。
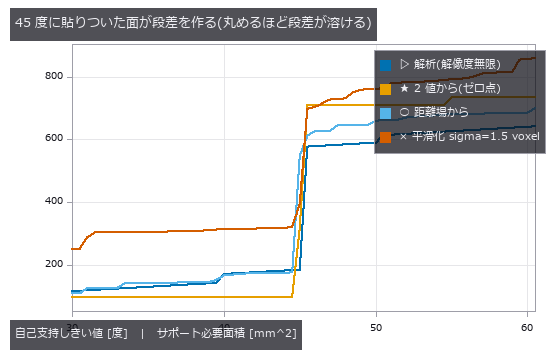
↑ 解析は階段。
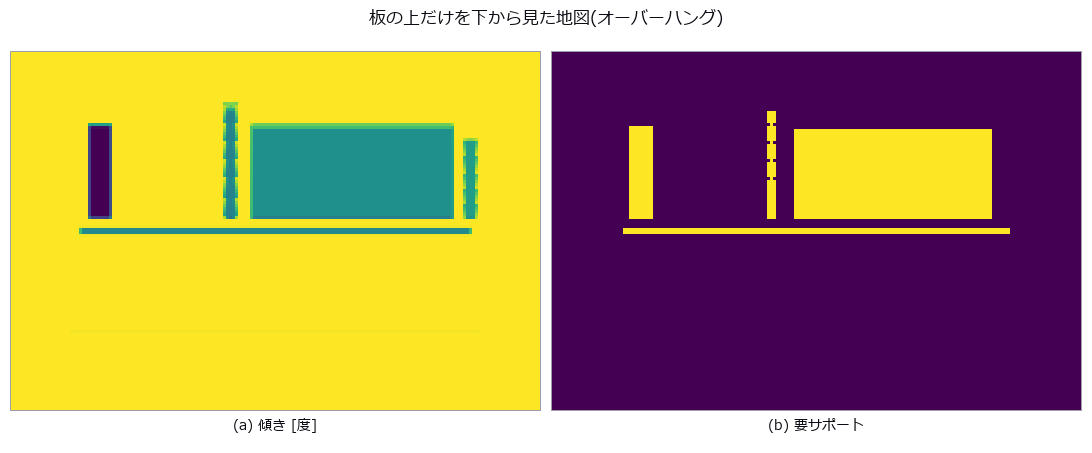
↑ 左 = 水平からの傾き(暗い = 0 度 = 最悪、明るい = 90 度 = 垂直)。
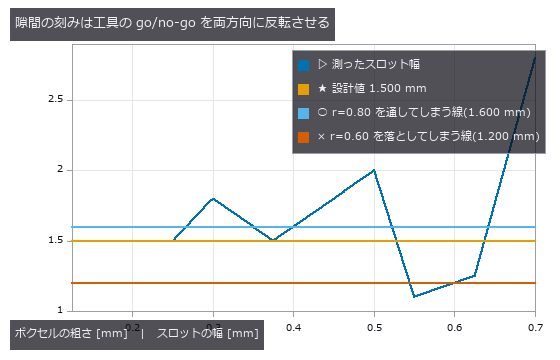
↑ 1.600 mm を超えると入らない工具を通し、1.200 mm を切ると入る工具を落とす。
py -3.11 examples/poc_dfm_thickness_overhang.py
Source: examples/poc_dfm_thickness_overhang.py
This run produced 9 figures in total - see them all
Ops used (notes): box_sdf · erfc · esdf · face_areas · face_normals · grid_coords · morph_erode3d · render_shaded · sdf_intersect · sdf_subtract · sdf_to_occupancy · sdf_union · vol_wall_thickness · voxel_to_mesh
No.2026.070 —— Earthwork on a slope — align first and the scar gets shallower
A synthetic slope carries an excavation and a deposit of known volume; two epochs of airborne points are differenced both vertically (DoD) and along the local surface normal (M3C2). The expected “cos-θ shrinkage on a slope” never appears — integrating vertical differences over horizontal area cancels the cosine, and the excavated volume stays within -0.011 % from 0 to 40 degrees. What breaks is the registration: when the changed area covers 33 % of the scene, ICP absorbs the change itself and the net volume collapses from a true -30.4 m3 to -3.8 m3, while a no-change control alone already fabricates 83.8 m3 of phantom excavation.
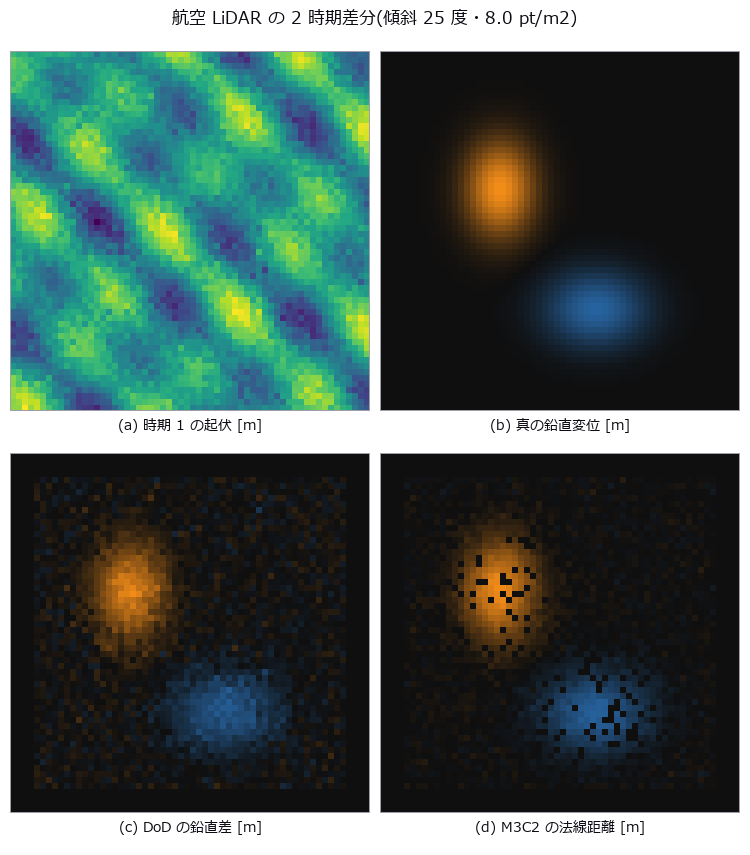
↑ Earthwork on a slope — align first and the scar gets shallower ―― A synthetic slope carries an excavation and a deposit of known volume; two epochs of airborne points are differenced both vertically (DoD) and along the local surface normal (M3C2). The expected “cos-θ shrinkage on a slope” never appears — integrating vertical differences over horizontal area cancels the cosine, and the excavated volume stays within -0.011 % from 0 to 40 degrees. What breaks is the registration: when the changed area covers 33 % of the scene, ICP absorbs the change itself and the net volume collapses from a true -30.4 m3 to -3.8 m3, while a no-change control alone already fabricates 83.8 m3 of phantom excavation.
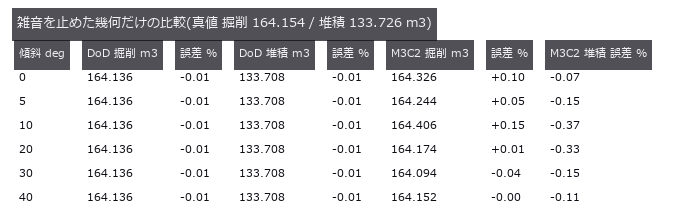
↑ The measurement ―― 傾斜を 0 から 40 度まで振っても体積の誤差に傾向が無い。cos は積分で約分する。 (figure labels are in Japanese; the numbers are the same)
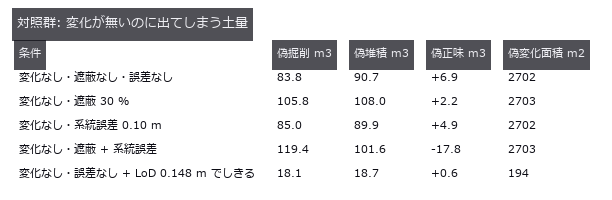
↑ 真の掘削は 164.2 m3。
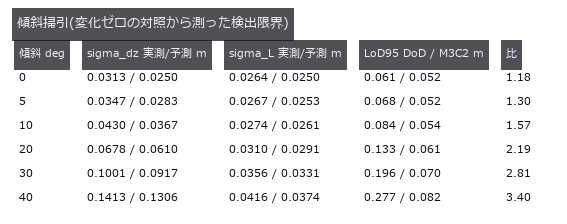
↑ 予測式は先に立ててから測った。

↑ 誤差はそのしきい値以上の真値に対する値。
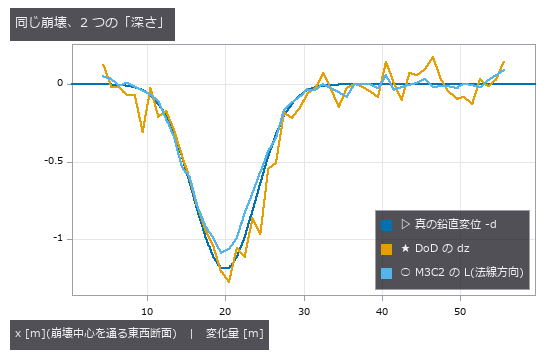
↑ M3C2 の L は法線方向なので cos 25 度 = 0.906 倍だけ浅く出る。
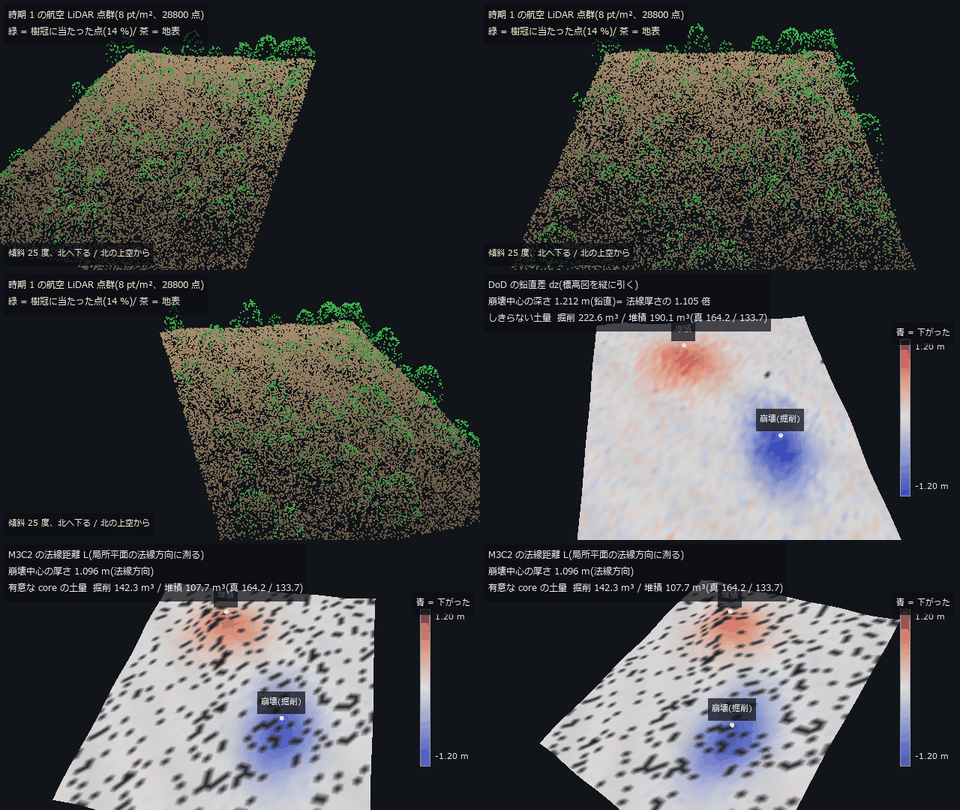
↑ The animation ―― 主図(動画、640 × 360・30 fps・12 秒): 前半は傾斜 25 度の斜面を北の上空から横切り、時期 1 の点群(8 pt/m²、樹冠に当たった点 = 緑)を見せる(動画専用の乱数で作った別の標本)。後半は時期 2 の地形の周りを回り、色を DoD の鉛直差から M3C2 の法線距離へ塗り替える(同じ尺度 ±1.2 m、青 = 下がった)。崩壊中心の深さは DoD 1.212 m / M3C2 1.096 m で比 1.105(sec 25 度 = 1.103)。有意な core の M3C2 土量は掘削 142.3 / 堆積 107.7 m³(真値 164.2 / 133.7)。黒っぽい所は測れなかった core。
py -3.11 examples/poc_lidar_terrain_change.py
Source: examples/poc_lidar_terrain_change.py
This run produced 14 figures in total - see them all
Ops used (notes): chamfer_distance · color_bar · dem_hillshade · dem_slope · estimate_normals · estimate_oriented_normals · fit_plane_3d · icp_point2point_3d · median · ransac_plane · text_box · voxel_grid_downsample
No.2026.099 —— Weighing an Animal from Silhouettes — The Error You Can Buy Down, and the One You Cannot
Estimate an animal’s volume from the intersection of multi-view silhouettes (the visual hull) and convert it to weight. A visual hull is always an upper bound, so the question is not whether it is good but that it is always high. The closed form corrected the field rule of thumb: K cameras do not give a K-gon. Under parallel projection each camera contributes two support lines perpendicular to its line of sight, and two opposing cameras contribute the same pair, so the number of distinct tangents is K for even K and 2K for odd K. Three cameras and six cameras are therefore geometrically identical (closed form 1.16772 both times, the measured 0.013 difference being discretisation only), half of an even rig is wasted, and 13 cameras (1.03056) beat 16 (1.04768). Requiring 2 % on weight needs 13 cameras if odd counts are allowed and 24 if not — the naive circular reading of (K/pi)tan(pi/K) says 13, so a team building an even-numbered rig is short by 11. Against the exact ellipse (a/b = 2.76) the measurements sit just above the closed form at every K, confirming it as a lower bound. The centre of this exhibit is separating the error you can buy down from the one you cannot: the phantom between the legs falls from 7.13 % to 1.37 % going from 4 to 48 cameras, while the hollow of the back falls only 3.8 points (56.4 % to 52.6 %) for the same twelvefold increase, because a concavity that never reaches the outline leaves no trace in any silhouette. One pixel of segmentation error is likewise unbuyable, worth +3.21 % per pixel (23.7 kg), matching Steiner’s dV/V = (S/V)delta to a ratio of 1.04 — though the text records that two opposing effects happened to cancel there. The rulers disagree on the winner: volume-derived and allometric weight both prefer 24 cameras with a two-pixel erosion, while the height of the centroid prefers no erosion at all, since the thin legs disappear first. One prediction was wrong: a tape measure wraps the body, so the 3-D convex hull was expected to be the strong method for heart girth, but it measured +55.2 % — the hull of the whole body fills in under the belly and drags the cross-section down to the ground. The convex hull of a section and the section of a convex hull are not the same object. A tooling hole was found and closed on the way: the OpenCV-convention pose helper that space carving requires was unreachable from every public tier, while the name look_at in the public API belonged to the OpenGL-convention version, so grabbing the wrong one returned an empty hull with no exception at all.
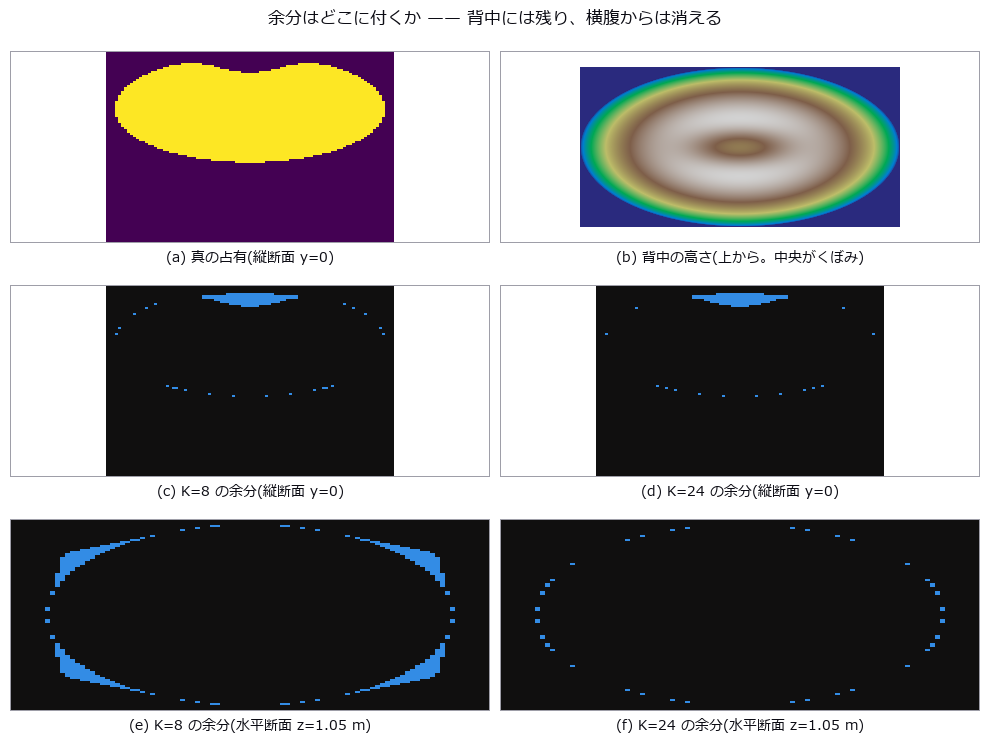
↑ Weighing an Animal from Silhouettes — The Error You Can Buy Down, and the One You Cannot ―― Estimate an animal’s volume from the intersection of multi-view silhouettes (the visual hull) and convert it to weight. A visual hull is always an upper bound, so the question is not whether it is good but that it is always high. The closed form corrected the field rule of thumb: K cameras do not give a K-gon. Under parallel projection each camera contributes two support lines perpendicular to its line of sight, and two opposing cameras contribute the same pair, so the number of distinct tangents is K for even K and 2K for odd K. Three cameras and six cameras are therefore geometrically identical (closed form 1.16772 both times, the measured 0.013 difference being discretisation only), half of an even rig is wasted, and 13 cameras (1.03056) beat 16 (1.04768). Requiring 2 % on weight needs 13 cameras if odd counts are allowed and 24 if not — the naive circular reading of (K/pi)tan(pi/K) says 13, so a team building an even-numbered rig is short by 11. Against the exact ellipse (a/b = 2.76) the measurements sit just above the closed form at every K, confirming it as a lower bound. The centre of this exhibit is separating the error you can buy down from the one you cannot: the phantom between the legs falls from 7.13 % to 1.37 % going from 4 to 48 cameras, while the hollow of the back falls only 3.8 points (56.4 % to 52.6 %) for the same twelvefold increase, because a concavity that never reaches the outline leaves no trace in any silhouette. One pixel of segmentation error is likewise unbuyable, worth +3.21 % per pixel (23.7 kg), matching Steiner’s dV/V = (S/V)delta to a ratio of 1.04 — though the text records that two opposing effects happened to cancel there. The rulers disagree on the winner: volume-derived and allometric weight both prefer 24 cameras with a two-pixel erosion, while the height of the centroid prefers no erosion at all, since the thin legs disappear first. One prediction was wrong: a tape measure wraps the body, so the 3-D convex hull was expected to be the strong method for heart girth, but it measured +55.2 % — the hull of the whole body fills in under the belly and drags the cross-section down to the ground. The convex hull of a section and the section of a convex hull are not the same object. A tooling hole was found and closed on the way: the OpenCV-convention pose helper that space carving requires was unreachable from every public tier, while the name look_at in the public API belonged to the OpenGL-convention version, so grabbing the wrong one returned an empty hull with no exception at all.
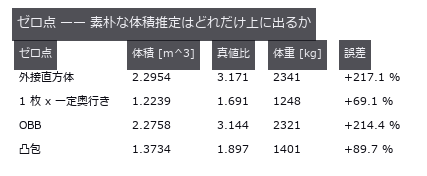
↑ The measurement ―― 真値 0.7238 m^3 / 738 kg。外接直方体と OBB は上界の中でもいちばん粗い。 (figure labels are in Japanese; the numbers are the same)

↑ 法線は方位 ± 90 度。
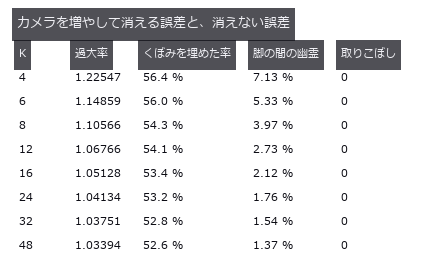
↑ くぼみ(輪郭に出ない凹み)は台数に鈍感、脚の間(輪郭に出る凹み)は台数に敏感。
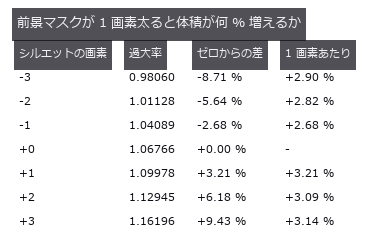
↑ K=12・4.0 mm/px。
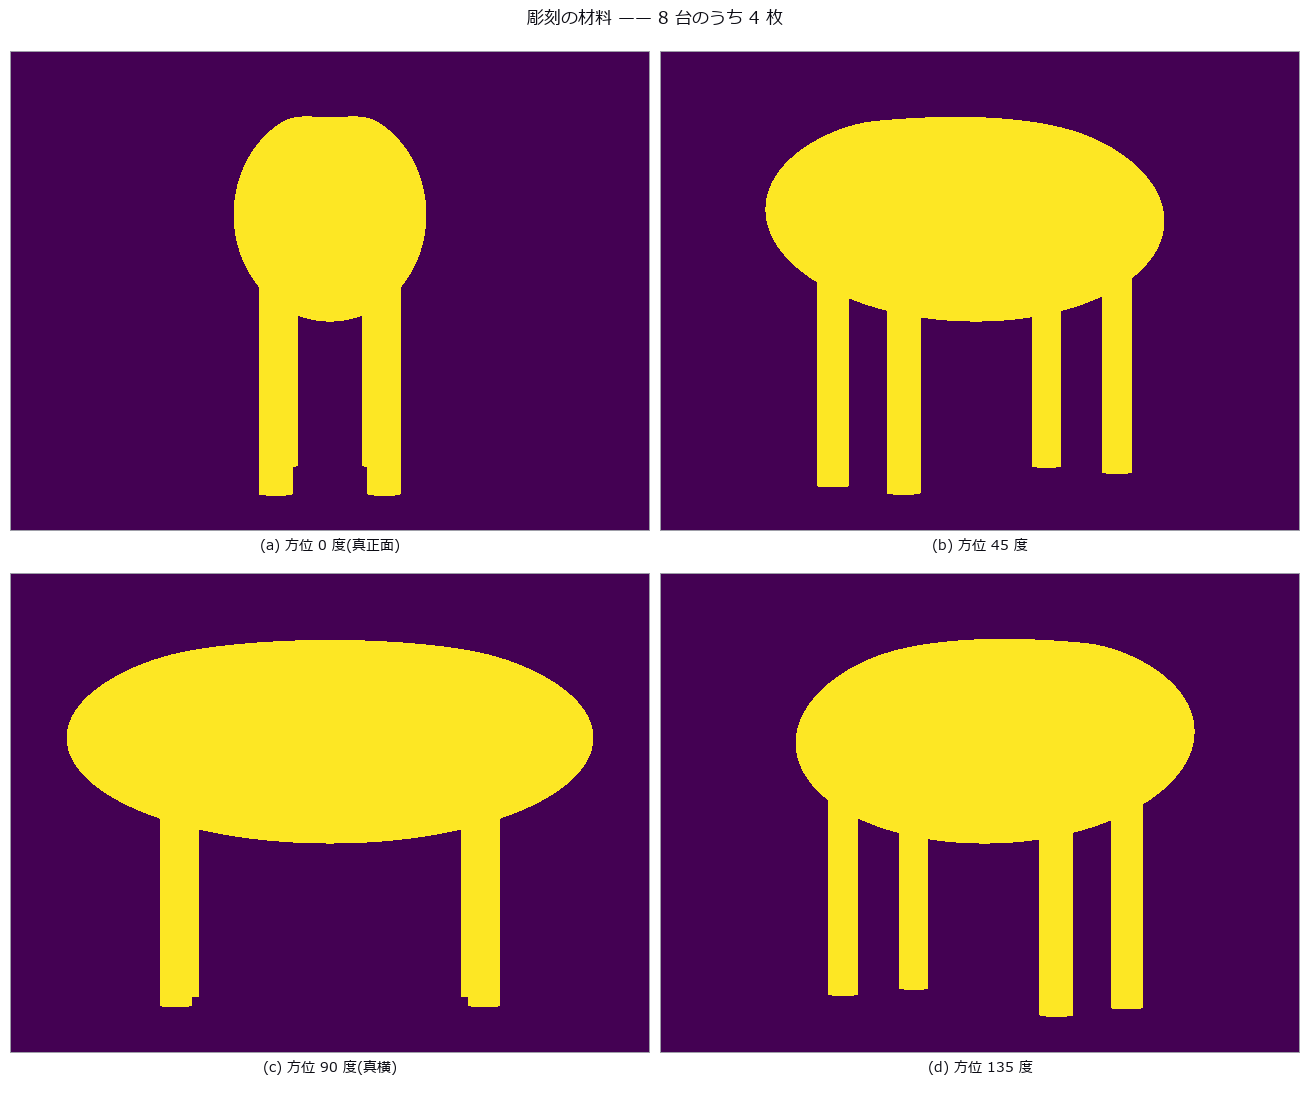
↑ 脚の間の空隙はどの 1 枚にも写っている(だから彫れる)。
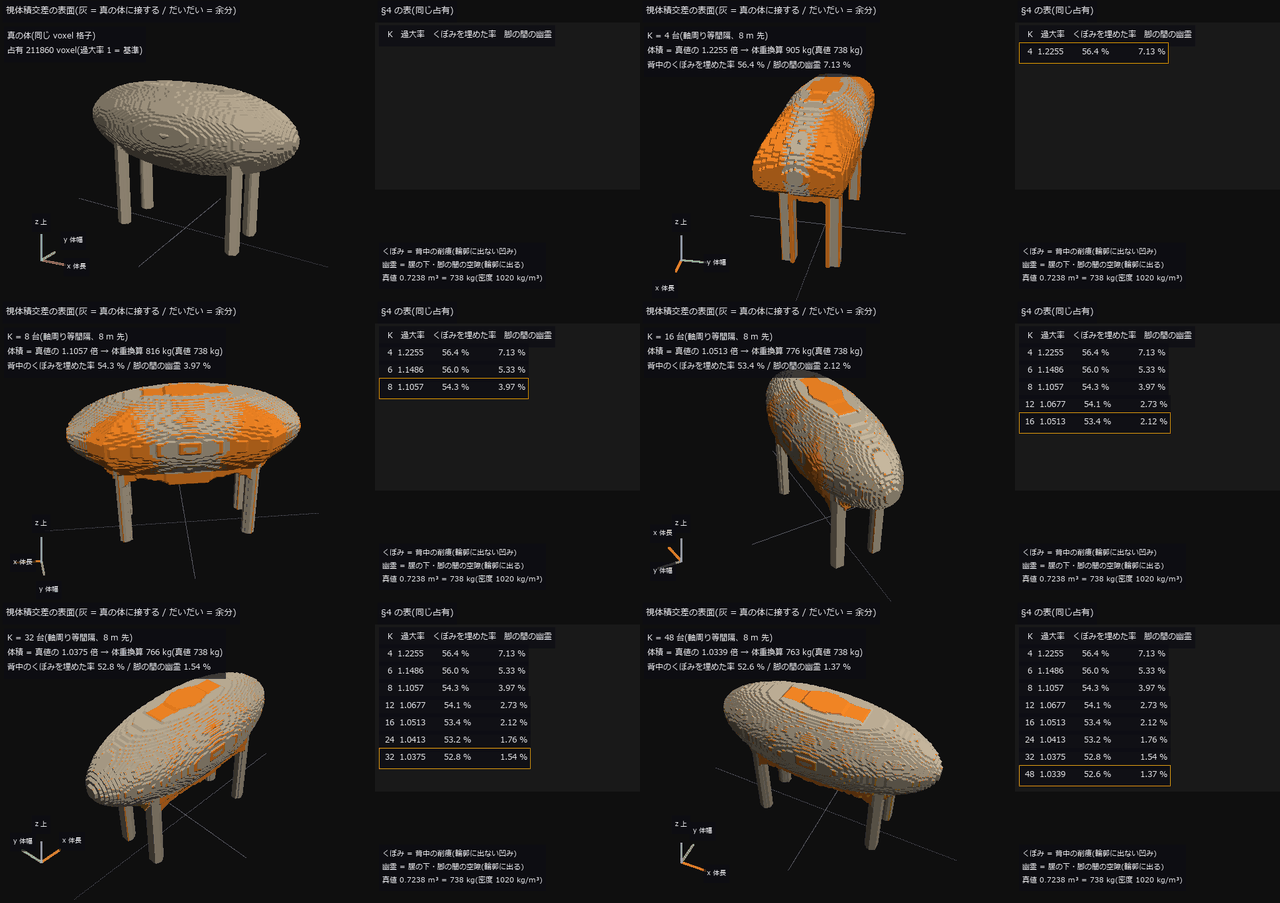
↑ The animation ―― 動画(270 コマ、560 × 420 px): 牛の周りを 1 周しながら、彫刻に使うカメラの台数を 4 → 48 台(軸周り等間隔、8 m 先)へ増やす。表示は §4 で数えた視体積交差の占有の表面で、真の体に接する面は灰、真に空の所に立つ面(余分)はだいだい。最初の段は真の占有。横腹の帯と脚の間の幽霊(7.13 % → 1.37 %)は台数とともに消えるが、背中のくぼみに被さる蓋は K = 48 でも 52.6 % 埋まったまま(K = 4 で 56.4 %)—— 輪郭に出ない凹みはシルエットに情報が無い。体積は真値の 1.2255 → 1.0339 倍。カメラの仰角は 20 → 46 度へ上げていき、台数の多い段ほど背中の蓋が見える。左下の 3 本は x(体長)・y(体幅)・z(上)、灰の細線は地面の x 軸・y 軸。
py -3.11 examples/poc_livestock_body_volume.py
Source: examples/poc_livestock_body_volume.py
This run produced 14 figures in total - see them all
Ops used (notes): carve · carve_look_at · convex_hull · erosion_circle · mesh_volume · synthesize_silhouette · text_box · vol_rle_bbox · vol_rle_centroid · vol_rle_encode · vol_rle_volume · voxel_to_mesh
No.2026.072 —— Repair the mesh, then measure — the defect count clears, the quantity does not
A closed triangle mesh is built from the boolean union of a sphere, a torus and a box, then seeded with a known count of each defect class — holes, flipped faces, non-manifold edges, degenerate slivers, duplicated vertices and self-intersection — and tracked with both the topological counts and the volume/area. The Euler characteristic does not move at all for 5 of the 6 classes, and 6 holes plus 6 duplicated faces leave the vertex, edge, face and chi counts identical to the healthy part. Repair does not bring the quantities back: filling a 45-degree cap hole on a sphere changes the surface area by +6.868 % where the closed form predicts -2.145 % (the rim is a staircase, not a circle), and pushing just 6 vertices inward passes all three topological checks while the area is +4.414 % and the volume -0.332 % — a 13-fold disagreement.
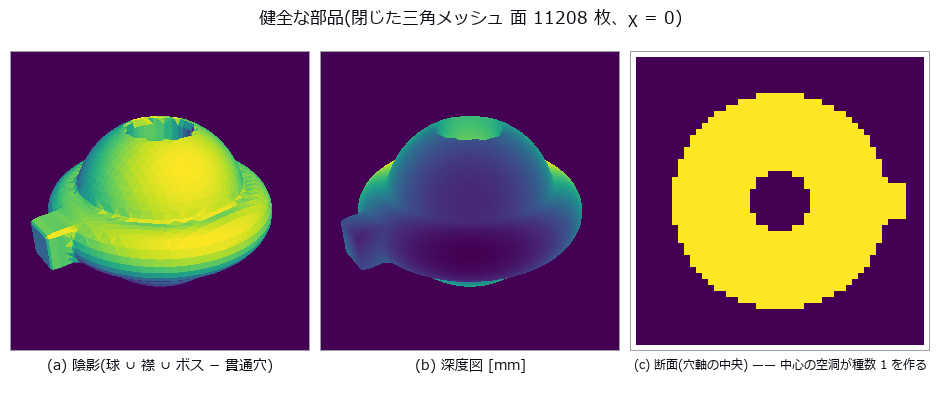
↑ Repair the mesh, then measure — the defect count clears, the quantity does not ―― A closed triangle mesh is built from the boolean union of a sphere, a torus and a box, then seeded with a known count of each defect class — holes, flipped faces, non-manifold edges, degenerate slivers, duplicated vertices and self-intersection — and tracked with both the topological counts and the volume/area. The Euler characteristic does not move at all for 5 of the 6 classes, and 6 holes plus 6 duplicated faces leave the vertex, edge, face and chi counts identical to the healthy part. Repair does not bring the quantities back: filling a 45-degree cap hole on a sphere changes the surface area by +6.868 % where the closed form predicts -2.145 % (the rim is a staircase, not a circle), and pushing just 6 vertices inward passes all three topological checks while the area is +4.414 % and the volume -0.332 % — a 13-fold disagreement.
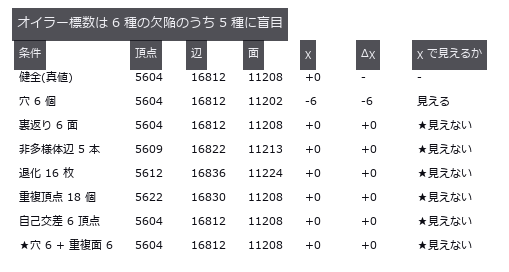
↑ The measurement ―― 健全な部品の χ は 0(種数 1)。χ=2 を合格条件にすると健全品が落ちる。最終行は打ち消し。 (figure labels are in Japanese; the numbers are the same)
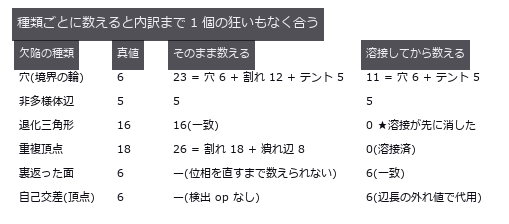
↑ ただし順番が両向きに効く —— 溶接前は割れの境界を穴として数え、溶接後は退化三角形を数え損ねる。

↑ 幅ゼロの割れ(重複頂点 18 個)を直した結果。
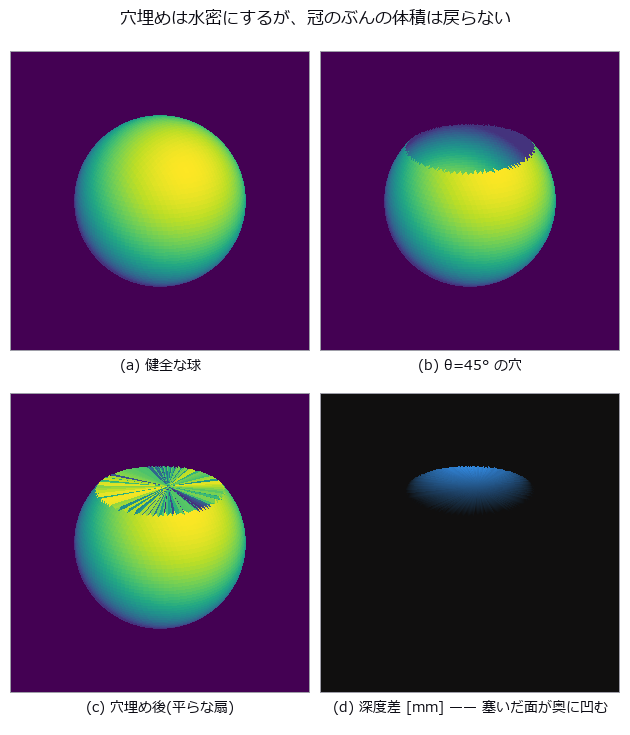
↑ この回の図
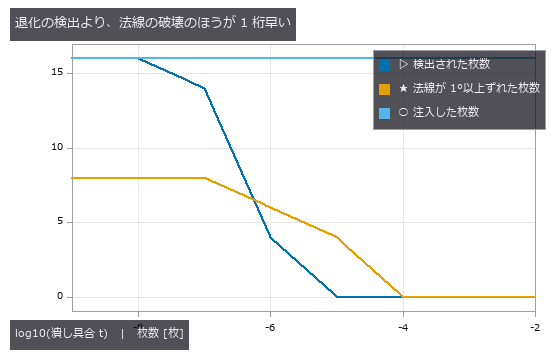
↑ 面積 0 の判定に引っかかるずっと手前で、潰れ面の法線は使いものにならなくなる。
| [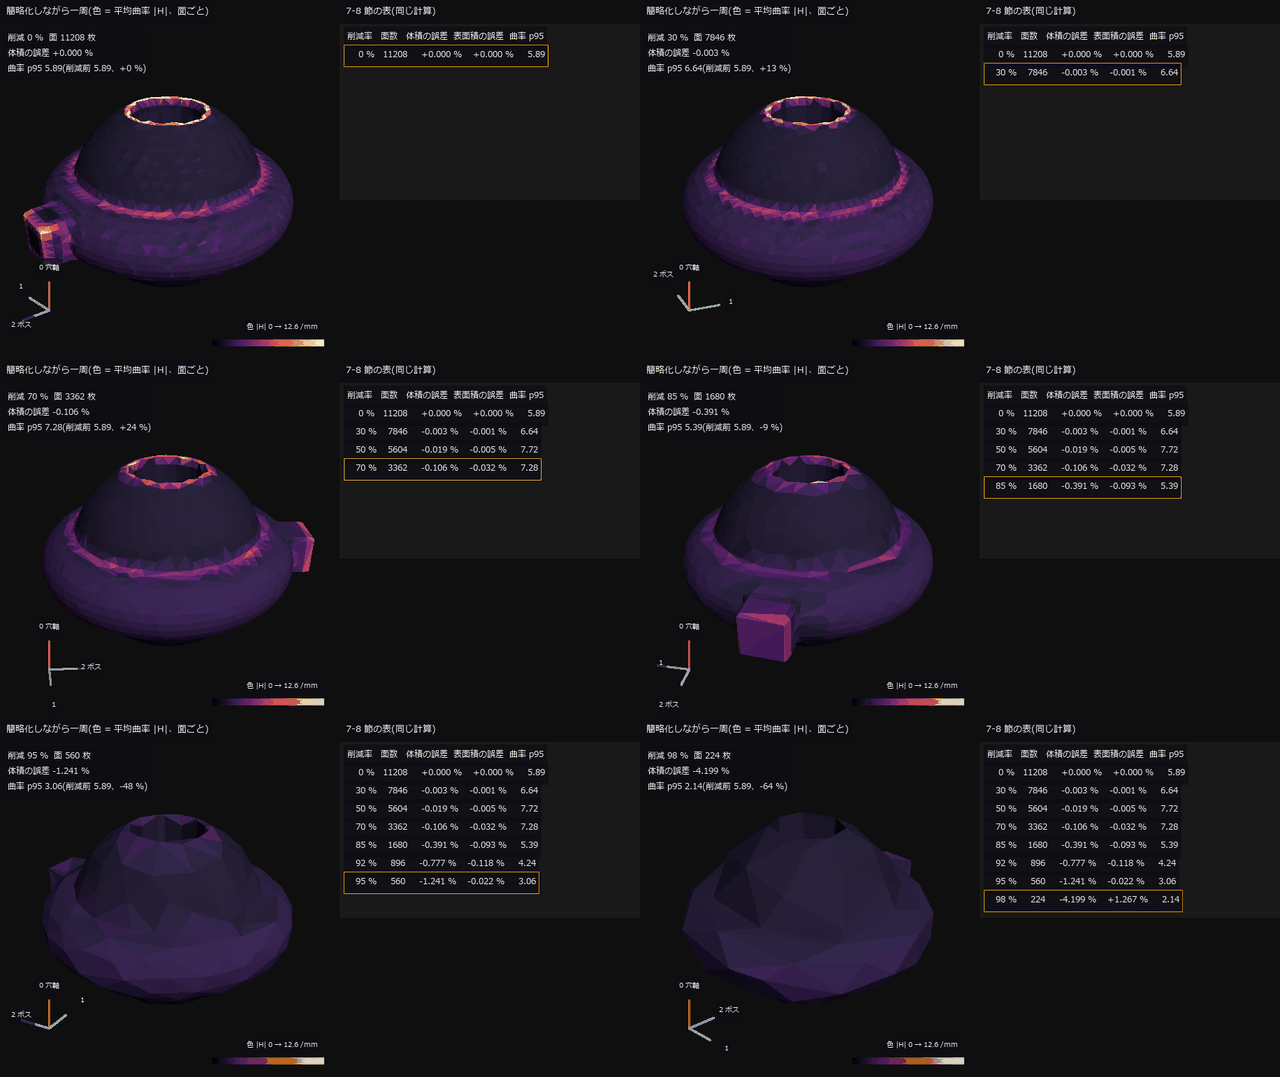](https://raw.githubusercontent.com/furuse-kazufumi/fullseye/master/docs/articles/assets/poc/poc_mesh_quality_repair/14_decimate_orbit.gif) |
| *↑ The animation ―― 動画(272 コマ、480 × 480 px): 健全な部品(面 11208 枚)の周りを 1.5 周しながら、QEM 簡略化の削減率を 0 → 98 % へ 8 段で上げる。面は平らに塗り、色は面の 3 頂点の平均曲率 | H | (尺度は削減前の 99 パーセンタイル 12.6 /mm で固定)。50 % 削減で体積の誤差は -0.019 % しかないのに曲率の 95 パーセンタイルは 5.89 → 7.72(+31 %)—— 明るい(尖った)面が先に増える。98 % 削減でようやく体積 -4.199 %。左下の 3 本は配列の軸(0 = 貫通穴の軸 = 画面の上、2 = 角柱ボスの側)。* |
py -3.11 examples/poc_mesh_quality_repair.py
Source: examples/poc_mesh_quality_repair.py
This run produced 14 figures in total - see them all
Ops used (notes): decimate_qem · face_normals · fill_holes · inertia_tensor · mesh_area · mesh_edge_lengths · mesh_edge_stats · sdf_subtract · sdf_union · text_box · vertex_curvature · vertex_normals · voxel_to_mesh
No.2026.101 —— Pallet load utilization — one number gives voids and overhang the same value
Two loads with opposite defects sit on a 1200 x 1000 mm pallet: load A hides a 400 x 400 x 420 mm cavity under a bridging layer plus 20 / 50 / 120 mm slots, while load B is solid but overhangs by 90 mm and tops out 100 mm above the 1800 mm limit. Solving the middle-layer height in closed form (995.0 mm) makes their apparent utilization identical — 62.65 % vs 62.67 %, a 0.02 pt gap — yet A’s 3.11 pt is invisible void and B’s is 2.10 pt overhang plus 0.58 pt over-height, so one load gets restacked and the other gets rejected. Treating the load as one envelope reports 113.90 % (AABB) and 166.44 % (PCA box) for load B, and the IoU between the true solid and the top-down extrusion is 0.9493 / 1.0000 — both read as ‘good agreement’. One knob, the height-map cell size, breaks the answer in two opposite directions: a slot of width w survives only as max(0, 1 - g/w) (a 20 mm slot is gone at g = 40 mm, and at g = w exactly the grid phase decides all-or-nothing — 1 alignment in 5 sees everything), while a load that overhangs by nothing acquires a false overhang of perimeter x g/2 x height that overtakes load B’s genuine 0.0450 m3 from g = 40 mm on.
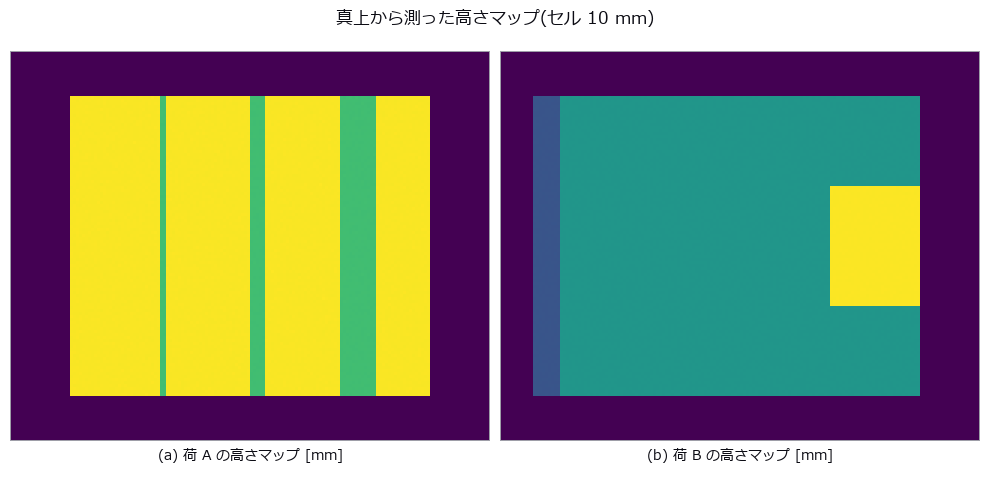
↑ Pallet load utilization — one number gives voids and overhang the same value ―― Two loads with opposite defects sit on a 1200 x 1000 mm pallet: load A hides a 400 x 400 x 420 mm cavity under a bridging layer plus 20 / 50 / 120 mm slots, while load B is solid but overhangs by 90 mm and tops out 100 mm above the 1800 mm limit. Solving the middle-layer height in closed form (995.0 mm) makes their apparent utilization identical — 62.65 % vs 62.67 %, a 0.02 pt gap — yet A’s 3.11 pt is invisible void and B’s is 2.10 pt overhang plus 0.58 pt over-height, so one load gets restacked and the other gets rejected. Treating the load as one envelope reports 113.90 % (AABB) and 166.44 % (PCA box) for load B, and the IoU between the true solid and the top-down extrusion is 0.9493 / 1.0000 — both read as ‘good agreement’. One knob, the height-map cell size, breaks the answer in two opposite directions: a slot of width w survives only as max(0, 1 - g/w) (a 20 mm slot is gone at g = 40 mm, and at g = w exactly the grid phase decides all-or-nothing — 1 alignment in 5 sees everything), while a load that overhangs by nothing acquires a false overhang of perimeter x g/2 x height that overtakes load B’s genuine 0.0450 m3 from g = 40 mm on.

↑ The measurement (figure labels are in Japanese; the numbers are the same)
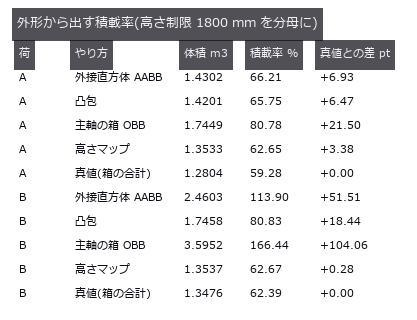
↑ この回の図
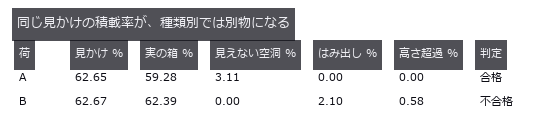
↑ この回の図
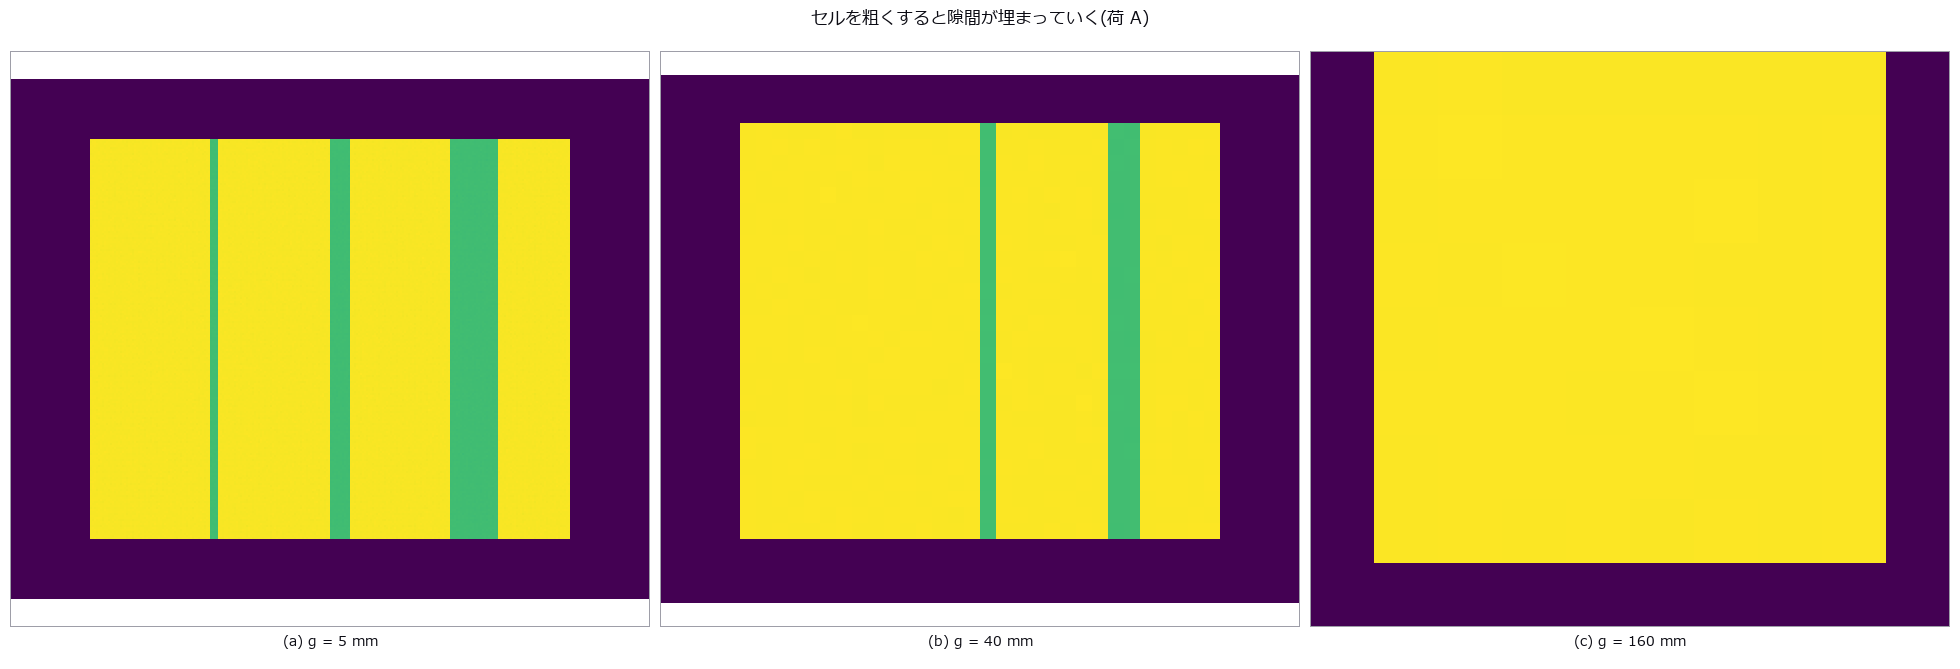
↑ この回の図

↑ この回の図
py -3.11 examples/poc_pallet_load_utilization.py
Source: examples/poc_pallet_load_utilization.py
This run produced 8 figures in total - see them all
Ops used (notes): aabb · convex_hull · euclidean_cluster · inner_box3 · mesh_volume · voxel_iou
No.2026.075 —— Pipe Wall Loss on the Unwrapped Map — The Axis You Choose Eats the Invert Corrosion
A synthetic pipe carries a pit, a full-circumference thinning band, invert corrosion, a weld bead, ovality and a sagging axis, all at known depths; the in-pipe range sensor is then deliberately run off-axis before the bore is unwrapped. A 4.0 mm axis offset alone flags 44.8 % of a corrosion-free round pipe as wall loss — within 1.84 points of the geometric prediction that an offset e appears as a one-cycle sinusoid of amplitude e — and the fictitious loss volume is 149.9 times the real pit. Removing the one-cycle term removes the fiction, but 79 % of invert corrosion (the commonest defect in sewers) lives in that same harmonic, so its detection falls from 100.0 % to 34.4 %; only constraining the axis the way physics does (a straight line plus a sag) keeps both.
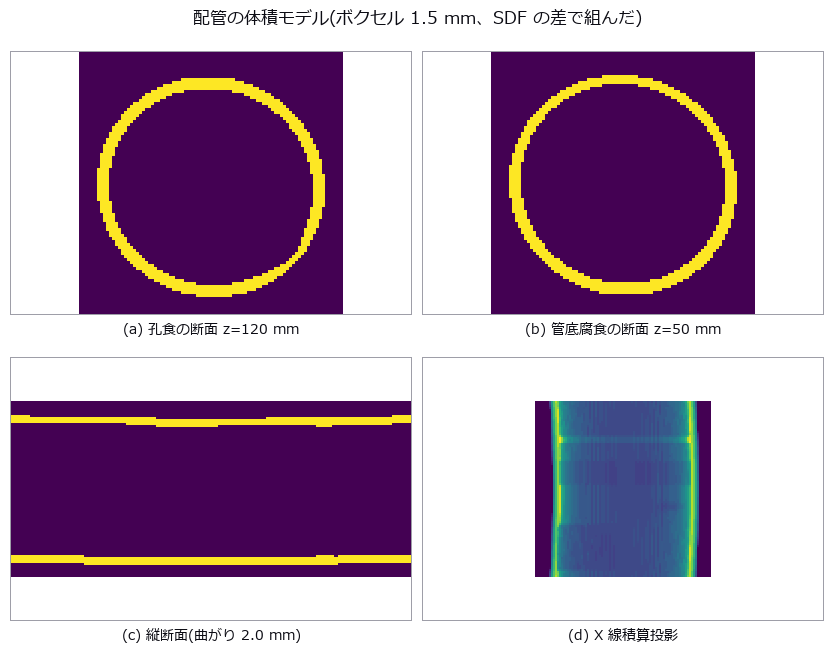
↑ Pipe Wall Loss on the Unwrapped Map — The Axis You Choose Eats the Invert Corrosion ―― A synthetic pipe carries a pit, a full-circumference thinning band, invert corrosion, a weld bead, ovality and a sagging axis, all at known depths; the in-pipe range sensor is then deliberately run off-axis before the bore is unwrapped. A 4.0 mm axis offset alone flags 44.8 % of a corrosion-free round pipe as wall loss — within 1.84 points of the geometric prediction that an offset e appears as a one-cycle sinusoid of amplitude e — and the fictitious loss volume is 149.9 times the real pit. Removing the one-cycle term removes the fiction, but 79 % of invert corrosion (the commonest defect in sewers) lives in that same harmonic, so its detection falls from 100.0 % to 34.4 %; only constraining the axis the way physics does (a straight line plus a sag) keeps both.
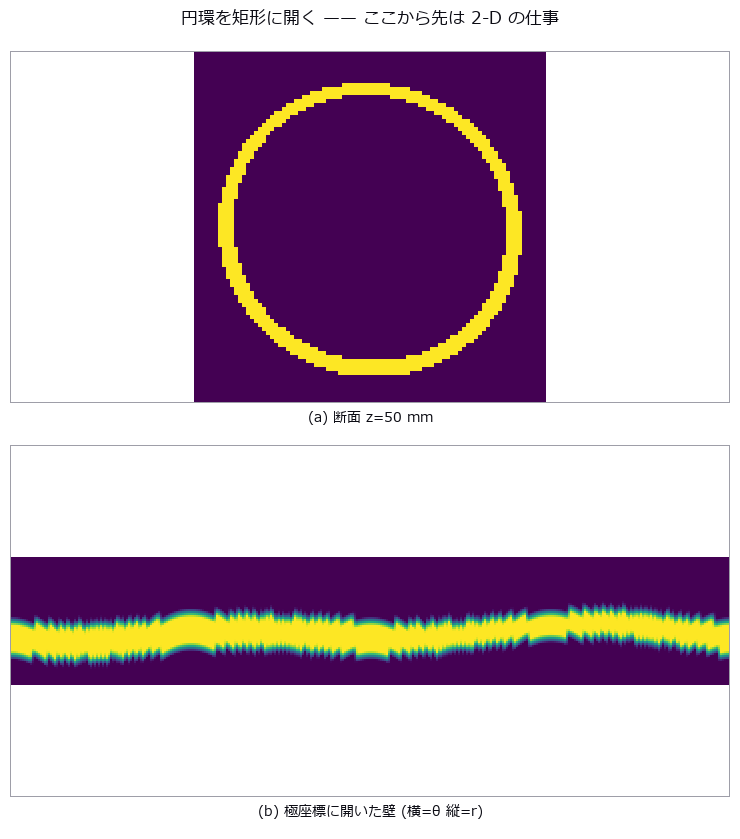
↑ The measurement ―― 下の帯の細くなっている所が管底腐食。 (figure labels are in Japanese; the numbers are the same)
[](https://raw.githubusercontent.com/furuse-kazufumi/fullseye/master/docs/articles/assets/poc/poc_pipe_wall_loss/03_map_truth.png)
↑ 真の減肉 [mm](縦 = z 0..300 mm、横 = θ 0..360 度。

↑ この回の図
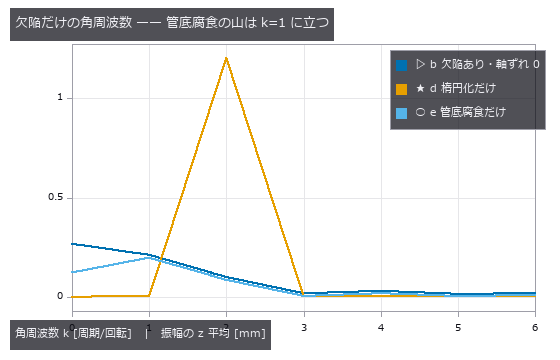
↑ 楕円化は k=2 に立つので分離できる。
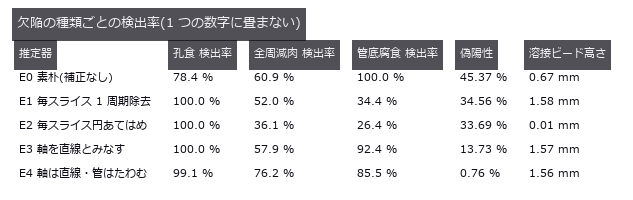
↑ この回の図
py -3.11 examples/poc_pipe_wall_loss.py
Source: examples/poc_pipe_wall_loss.py
This run produced 19 figures in total - see them all
Ops used (notes): blob_label · blob_select · cylinder_sdf · esdf · polar_unwrap · ransac_cylinder · render_volume_projection · sdf_subtract · sdf_to_occupancy · spectrum · vol_wall_thickness
No.2026.076 —— Warpage lives in the layer history — averaging the area throws the placement away
Seven synthetic parts are sliced into layers with a known constant per-layer shrinkage strain; warpage is first predicted in closed form from the layer-area history alone, then measured with an incremental layer-birth finite-element solve. A predictor that looks only at the final shape returns exactly zero (2.712e-21), and the history-based closed form lands within 0.4 % on 4 of the 7 shapes — but the moment the area is averaged along the length, where the material sits is lost. Three parts whose layer-area histories match to the last square millimetre bow by 0.4109 / 0.3809 / 0.3271 mm (a 26 % spread), and the force peeling them off the build plate differs by 48x (11.8 vs 573.5 N), flipping the pass/fail verdict.
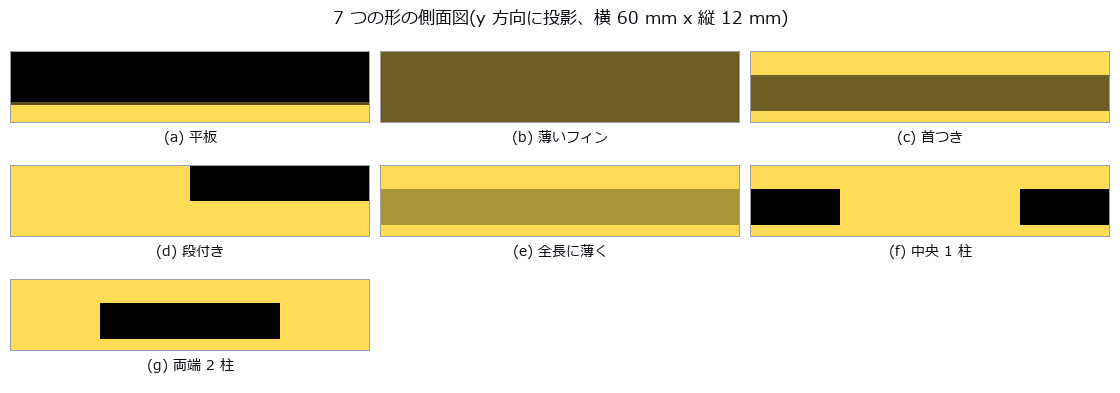
↑ Warpage lives in the layer history — averaging the area throws the placement away ―― Seven synthetic parts are sliced into layers with a known constant per-layer shrinkage strain; warpage is first predicted in closed form from the layer-area history alone, then measured with an incremental layer-birth finite-element solve. A predictor that looks only at the final shape returns exactly zero (2.712e-21), and the history-based closed form lands within 0.4 % on 4 of the 7 shapes — but the moment the area is averaged along the length, where the material sits is lost. Three parts whose layer-area histories match to the last square millimetre bow by 0.4109 / 0.3809 / 0.3271 mm (a 26 % spread), and the force peeling them off the build plate differs by 48x (11.8 vs 573.5 N), flipping the pass/fail verdict.
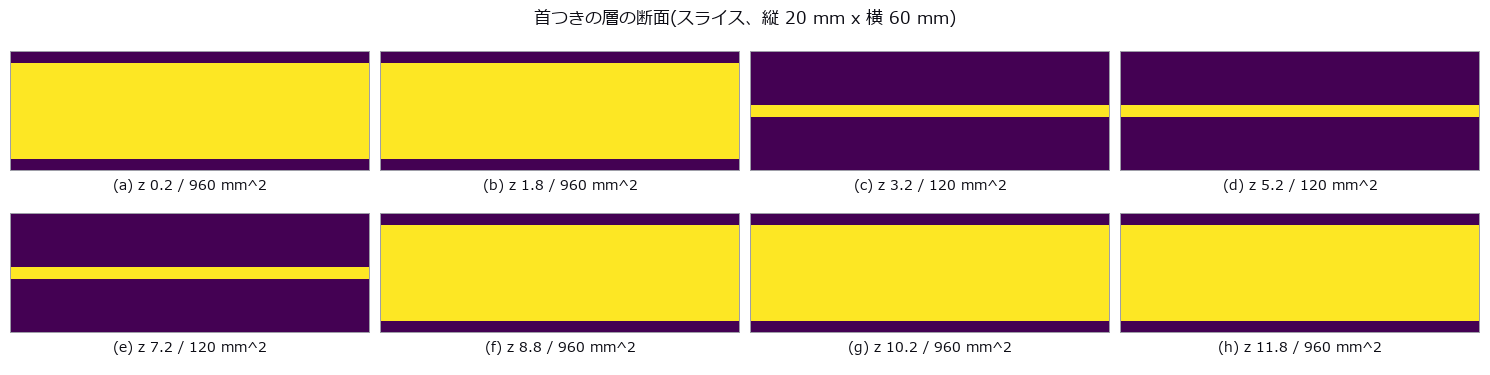
↑ The measurement ―― この断面の面積の列だけが、閉形式の入力になる。 (figure labels are in Japanese; the numbers are the same)
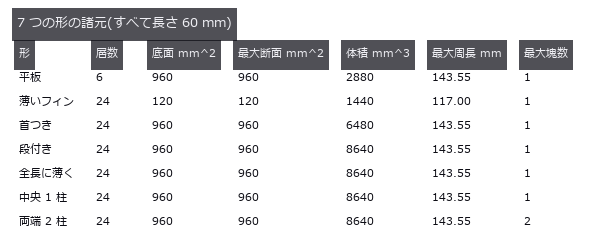
↑ この回の図
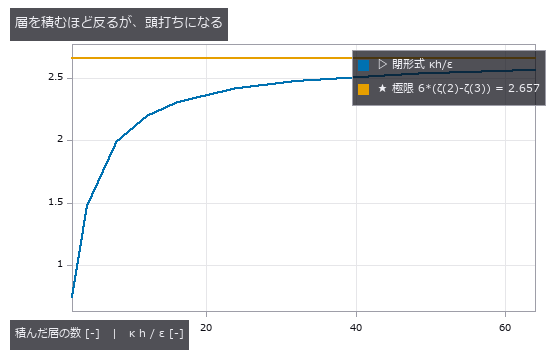
↑ 断面 2 次モーメントが層数の 3 乗で増えるのに、腕は 1 乗でしか伸びないため。
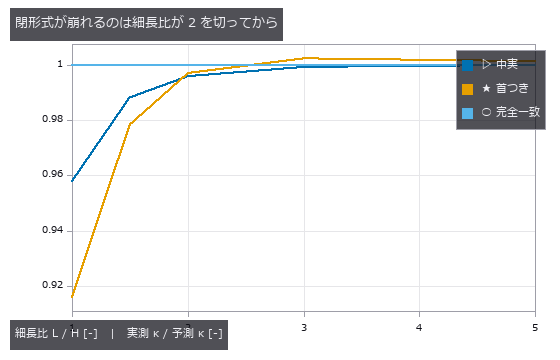
↑ 首の細さでは崩れない(別図)。
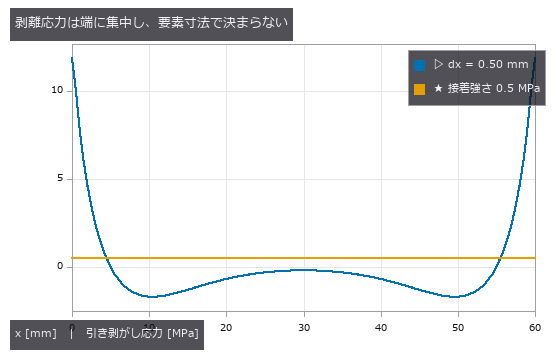
↑ 正 = 接着剤が引っ張られる。
py -3.11 examples/poc_print_warpage_risk.py
Source: examples/poc_print_warpage_risk.py
This run produced 20 figures in total - see them all
Ops used (notes): blob_features · blob_label · box_sdf · grid_coords · render_volume_projection · sdf_to_occupancy · sdf_union · text_box
No.2026.081 —— Human-machine clearance — swap the body for a point, and the hazard vanishes with it
A ten-capsule articulated body and a moving arm are synthesised so that the true surface-to-surface minimum separation is known in closed form at every instant, and the speed-and-separation-monitoring verdict is then scored against it. Representing the person by one centroid inside a 0.30 m sphere reports the distance +0.166 m too far while a hazard is present and misses 14.3 % of the dangerous frames (28.6 % for a foot-level scanner) — with almost no false alarms, so the failure is strictly one-sided. With a single camera behind the person, 48.6 % of the dangerous frames have the estimate decided by a body part that is not the true nearest one, and 18.1 % are missed; a second camera restores 0 %, but the uncertainty claimed from repeatability, 0.036 m, is only one fifth of the 0.178 m bias that occlusion actually produces.
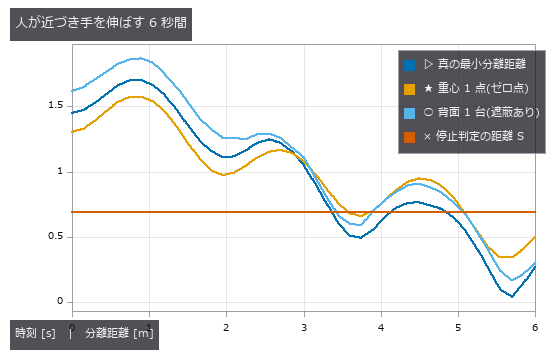
↑ Human-machine clearance — swap the body for a point, and the hazard vanishes with it ―― A ten-capsule articulated body and a moving arm are synthesised so that the true surface-to-surface minimum separation is known in closed form at every instant, and the speed-and-separation-monitoring verdict is then scored against it. Representing the person by one centroid inside a 0.30 m sphere reports the distance +0.166 m too far while a hazard is present and misses 14.3 % of the dangerous frames (28.6 % for a foot-level scanner) — with almost no false alarms, so the failure is strictly one-sided. With a single camera behind the person, 48.6 % of the dangerous frames have the estimate decided by a body part that is not the true nearest one, and 18.1 % are missed; a second camera restores 0 %, but the uncertainty claimed from repeatability, 0.036 m, is only one fifth of the 0.178 m bias that occlusion actually produces.
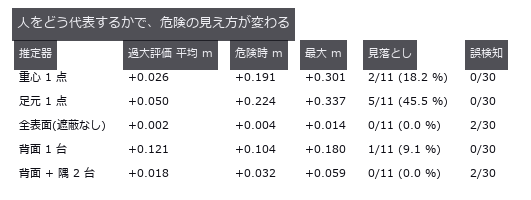
↑ The measurement ―― 危険 = 真の距離 < 0.640 m、停止判定 = 推定 < 0.690 m。 (figure labels are in Japanese; the numbers are the same)
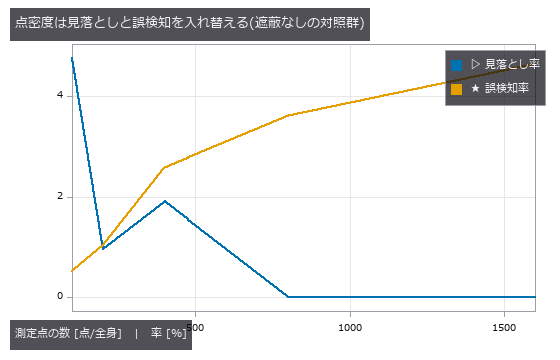
↑ 疎にするほど推定は遠くなるので、誤検知が減って見落としが増える。
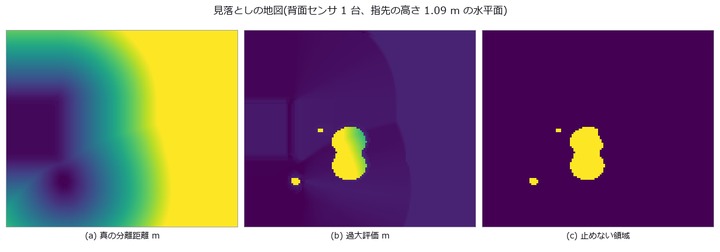](https://raw.githubusercontent.com/furuse-kazufumi/fullseye/master/docs/articles/assets/poc/poc_safety_clearance/06_map_miss.png)
↑ 横 = x [-0.2, 2.2] m、縦 = y [-1.1, 1.1] m。
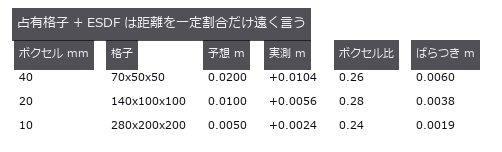
↑ この回の図
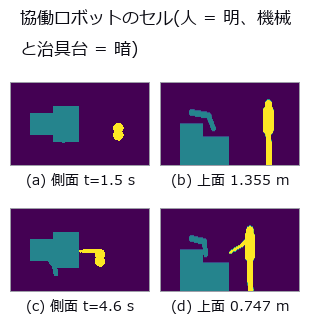
↑ 人は 10 本のカプセル、機械は 2 本のリンク + 基台、手前は治具台。
py -3.11 examples/poc_safety_clearance.py
Source: examples/poc_safety_clearance.py
This run produced 14 figures in total - see them all
Ops used (notes): annotate3d_label · annotate3d_measure · box_sdf · capsule_sdf · chamfer_distance · distance_line_line · esdf · face_areas · hausdorff_distance · query_distance · render_volume_projection · sdf_to_occupancy · sdf_union
No.2026.082 —— As-built deviation of a room — the compromise pose is handed to the innocent element
A synthetic room carries known construction errors — leaning walls, a sloping and sagging floor, off-size columns, displaced openings — and is re-measured by a simulated scan from three stations with column shadows, incidence-dependent noise, mixed pixels and registration error. One number for the whole building (mean distance to the design model) moves by only 1.41 mm between a perfect building and a defective one; aligning the cloud in one piece shrinks the wall lean to 69 % of truth and hands 0.89 mrad of tilt to a ceiling that is perfectly level (a closed-form prediction of what the fit absorbs matches the measurement to 0.05 mrad). The cliff is set by the height of the surviving surface rather than by the dropout rate: at the same 90 % loss, dropping points at random costs 0.098 mrad while keeping only the lower band costs 1.234 mrad — 12.6 times worse.

↑ As-built deviation of a room — the compromise pose is handed to the innocent element ―― A synthetic room carries known construction errors — leaning walls, a sloping and sagging floor, off-size columns, displaced openings — and is re-measured by a simulated scan from three stations with column shadows, incidence-dependent noise, mixed pixels and registration error. One number for the whole building (mean distance to the design model) moves by only 1.41 mm between a perfect building and a defective one; aligning the cloud in one piece shrinks the wall lean to 69 % of truth and hands 0.89 mrad of tilt to a ceiling that is perfectly level (a closed-form prediction of what the fit absorbs matches the measurement to 0.05 mrad). The cliff is set by the height of the surviving surface rather than by the dropout rate: at the same 90 % loss, dropping points at random costs 0.098 mrad while keeping only the lower band costs 1.234 mrad — 12.6 times worse.

↑ The measurement ―― いちばん暗い所は 1 か所も見ていない。柱の影はスキャン位置から放射状に伸びる。 (figure labels are in Japanese; the numbers are the same)

↑ (a) と (c) の差は平均で 1.41 mm、Chamfer で 0.50 mm。

↑ 左端の帯が色目盛り(上 +12 mm / 下 -12 mm)。

↑ 「偽の誤差」列は設計どおりに建った建物を同じ手順で測った値。

↑ 点を増やしても系統誤差は薄まらない。
py -3.11 examples/poc_scan_to_bim_asbuilt.py
Source: examples/poc_scan_to_bim_asbuilt.py
This run produced 15 figures in total - see them all
Ops used (notes): box_sdf · chamfer_distance · cylinder_sdf · estimate_normals · euclidean_cluster · grid_coords · plane_sdf · plane_segmentation · sdf_intersect · sdf_subtract · sdf_union · voxel_grid_downsample
No.2026.086 —— Re-surveying a structure year by year — when the vantage moves, decay appears to advance
A bridge girder (7 planes + 2 cylinders) carries known deflection, section loss, bearing settlement and a crack across three epochs, re-scanned each time from different positions, densities and poses. Re-measuring with zero deterioration already yields a nearest-neighbour “change” of 21.07 mm median and 42.64 mm max, and the false repair volume above a 1 mm threshold (5.098 L) reaches 87 % of the real one (5.882 L). Registering on all points absorbs 0.689 of the mid-span deflection (closed form 2/3) and invents a -1.737 mm uplift at the supports, while the undetermined along-span direction shows up not on the girder planes but only on the bearing cylinder, as a spurious 41.2 mm horizontal shift.
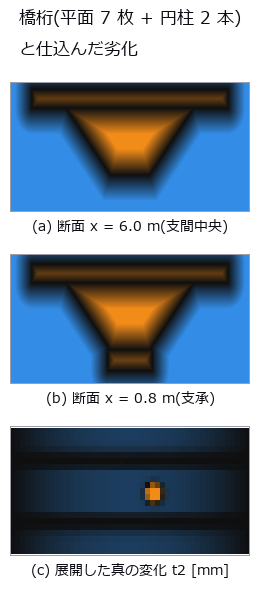
↑ Re-surveying a structure year by year — when the vantage moves, decay appears to advance ―― A bridge girder (7 planes + 2 cylinders) carries known deflection, section loss, bearing settlement and a crack across three epochs, re-scanned each time from different positions, densities and poses. Re-measuring with zero deterioration already yields a nearest-neighbour “change” of 21.07 mm median and 42.64 mm max, and the false repair volume above a 1 mm threshold (5.098 L) reaches 87 % of the real one (5.882 L). Registering on all points absorbs 0.689 of the mid-span deflection (closed form 2/3) and invents a -1.737 mm uplift at the supports, while the undetermined along-span direction shows up not on the girder planes but only on the bearing cylinder, as a spurious 41.2 mm horizontal shift.
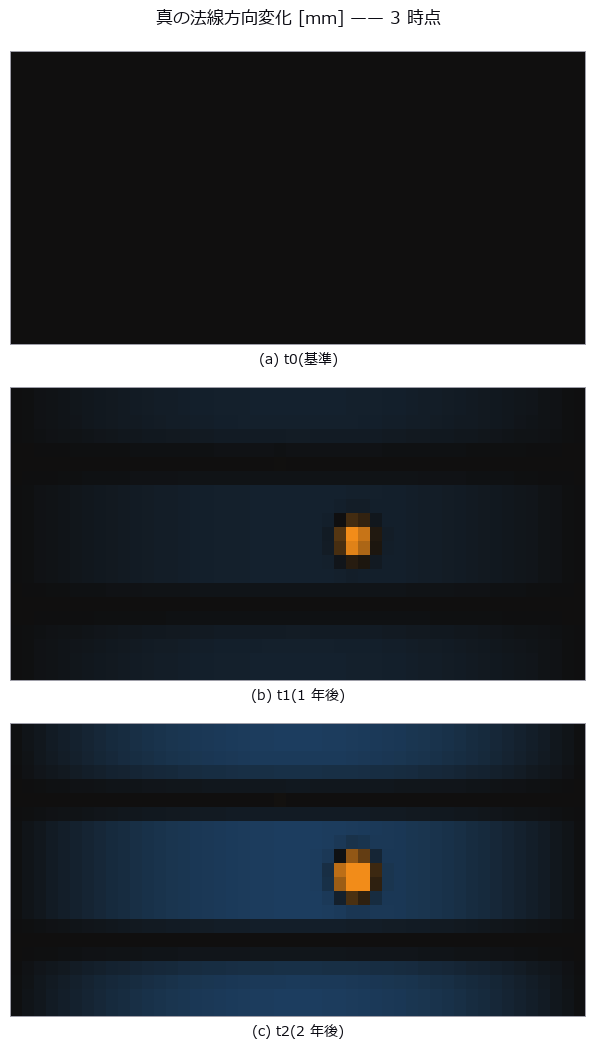
↑ The measurement ―― 下フランジの暗い窪みが断面欠損、面全体の淡い変化がたわみ。腹板(法線が水平)にはたわみが出ない ——同じ劣化でも面の向きで見え方が変わる。 (figure labels are in Japanese; the numbers are the same)
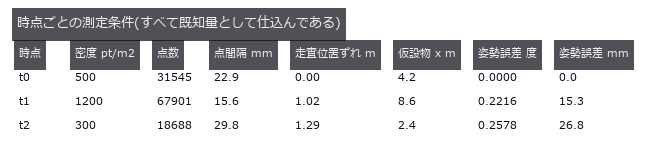
↑ 同じ構造物を 3 回測る。
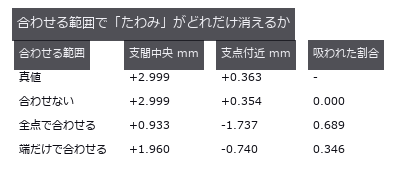
↑ 真のたわみは中央 3.00 mm。

↑ 予測は (ω×(p-c))·n を core 上で積んだだけ。
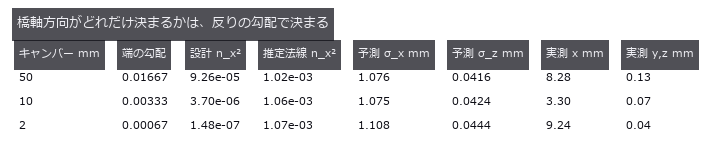
↑ 押し出し形状の平面は法線に x 成分を持たない。
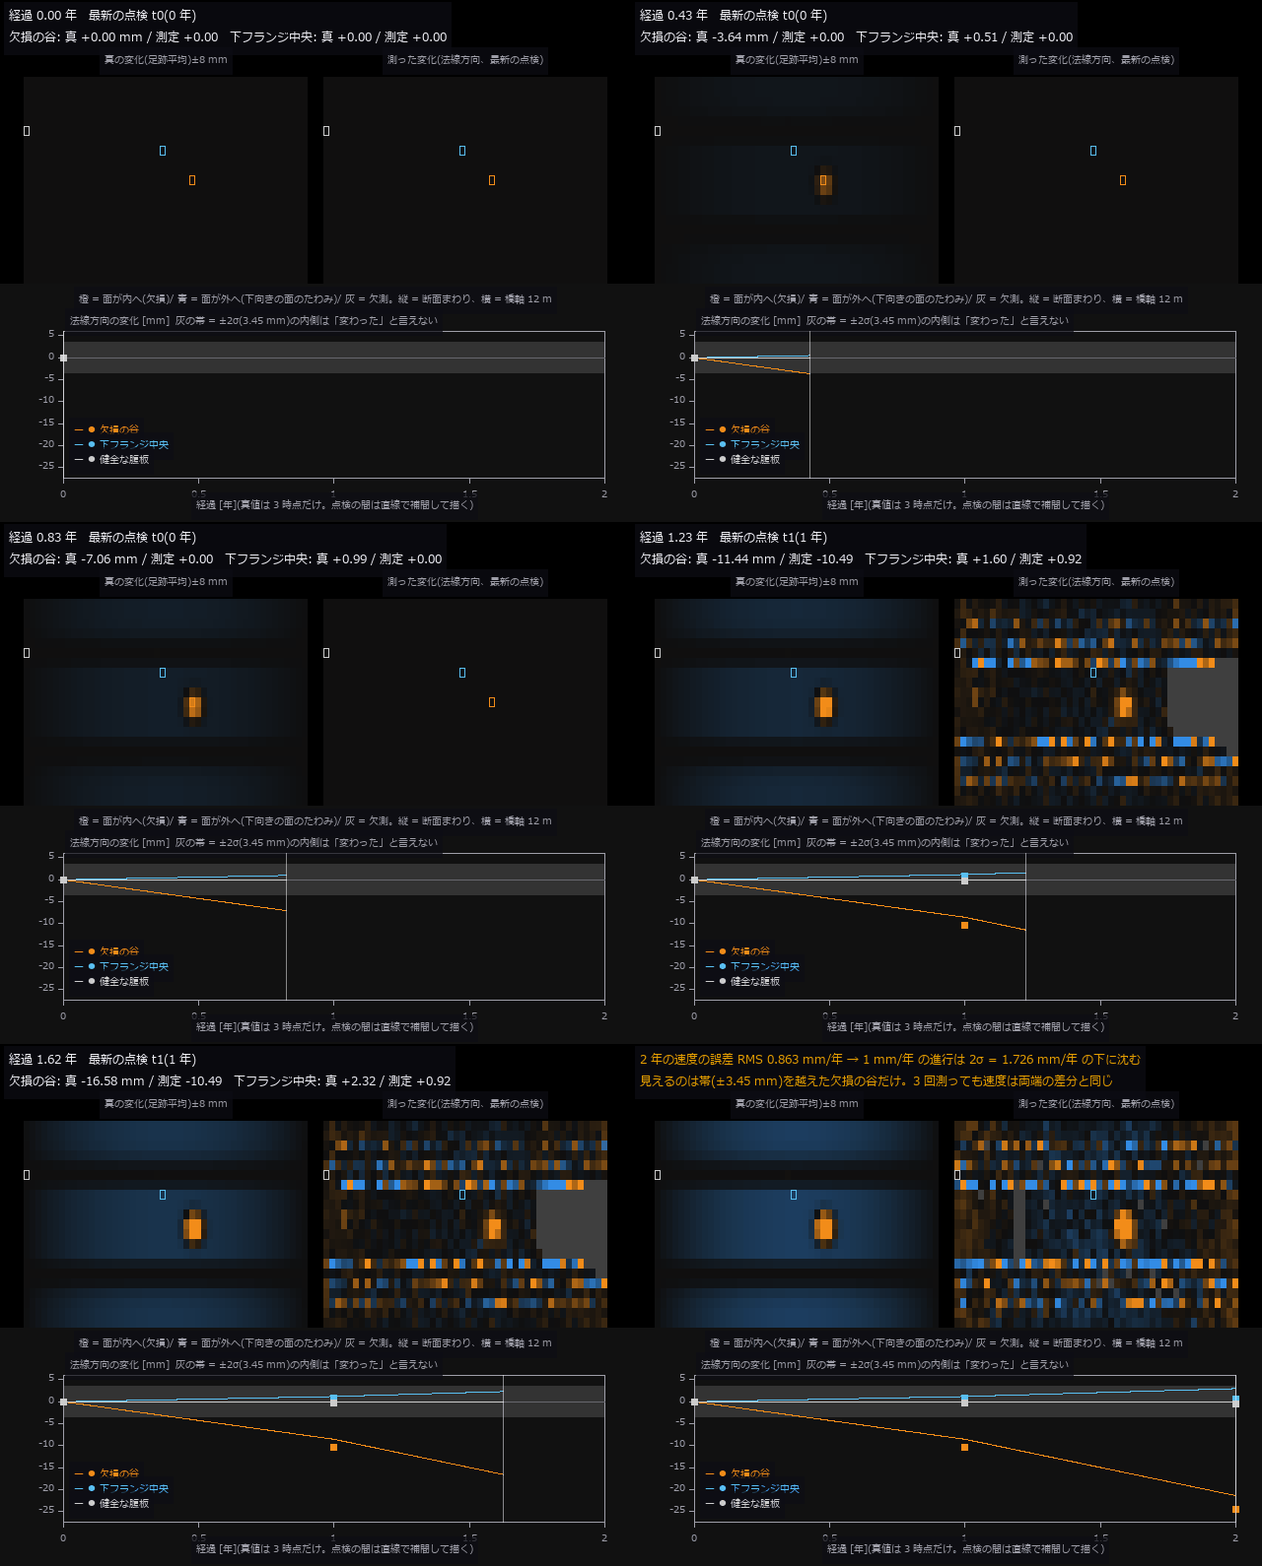
↑ The animation ―― 動画(640 × 530、15 fps、135 コマ): 橋桁を 2 年で 3 回点検する。左は真の法線方向変化(展開図、真値は 3 時点だけ定義なので点検の間は直線で補間して描いた)、右は法線方向に測った変化で、点検(1 年・2 年)が来たときだけ更新される。下段は代表 3 点の時系列(線 = 真値、点 = 測定)。灰の帯は t2 の差の誤差 RMS の ±2 倍(±3.45 mm)で、代表 3 点のうち欠損の谷(真 -21.4 mm)だけが帯を大きく越える。速度の誤差 RMS は 0.863 mm/年 で、1 mm/年 の進行は 2σ = 1.726 mm/年 の下に沈む。
py -3.11 examples/poc_structure_4d_deterioration.py
Source: examples/poc_structure_4d_deterioration.py
This run produced 12 figures in total - see them all
Ops used (notes): axes_frame · axes_transform · box_sdf · chamfer_distance · cylinder_sdf · data_to_pixel · estimate_normals · euclidean_cluster · fit_circle_3d · fit_plane_3d · grid_coords · hausdorff_distance · plane_sdf · rmse · sdf_intersect · sdf_union · text_box · ticks · voxel_grid_downsample
No.2026.087 —— Restoring what is missing by symmetry — the plane you assume is the lie you get
A bilaterally symmetric mask is synthesised so that both the complete shape and the true mirror plane are known, then one side is broken off with a sphere. With the true plane, symmetric restoration reaches 0.81 mm RMS and beats harmonic hole filling (1.60 mm) — but it loses the moment the plane is off by 1.39 deg (84 arcmin) or 1.41 mm. The error is predicted by the surface-normal component of the mirror displacement (4.6 % relative error; the naive 2d sin a misses by 50.6 %), so the cliff follows from geometry alone. Losing 3.1 % of the points already flips the PCA candidate ranking onto a 90-degree-wrong axis, and on a shape that is not truly symmetric the restoration fabricates 3436 mm3 of ornament or erases 3495 mm3 — even with the exact plane.
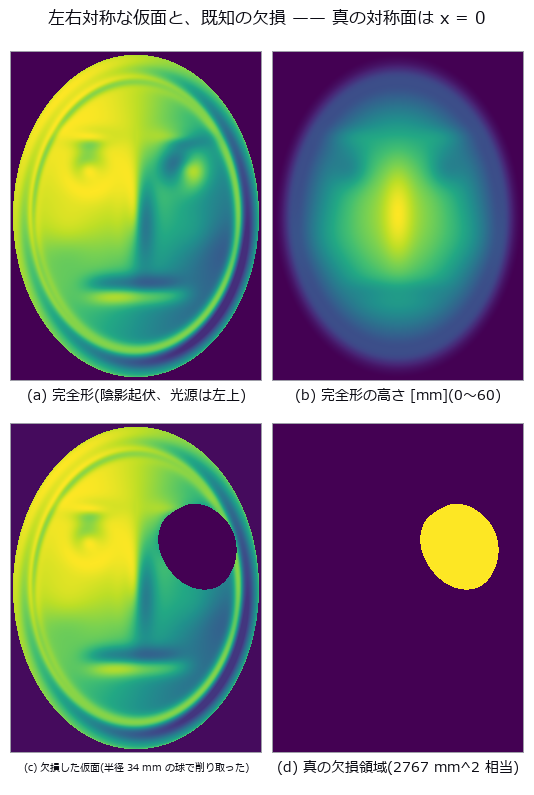
↑ Restoring what is missing by symmetry — the plane you assume is the lie you get ―― A bilaterally symmetric mask is synthesised so that both the complete shape and the true mirror plane are known, then one side is broken off with a sphere. With the true plane, symmetric restoration reaches 0.81 mm RMS and beats harmonic hole filling (1.60 mm) — but it loses the moment the plane is off by 1.39 deg (84 arcmin) or 1.41 mm. The error is predicted by the surface-normal component of the mirror displacement (4.6 % relative error; the naive 2d sin a misses by 50.6 %), so the cliff follows from geometry alone. Losing 3.1 % of the points already flips the PCA candidate ranking onto a 90-degree-wrong axis, and on a shape that is not truly symmetric the restoration fabricates 3436 mm3 of ornament or erases 3495 mm3 — even with the exact plane.

↑ The measurement ―― 失われた真値の点から復元点群までの距離(符号なし、6 mm で頭打ち)。対称復元だけが眼窩の形を取り戻す。 (figure labels are in Japanese; the numbers are the same)
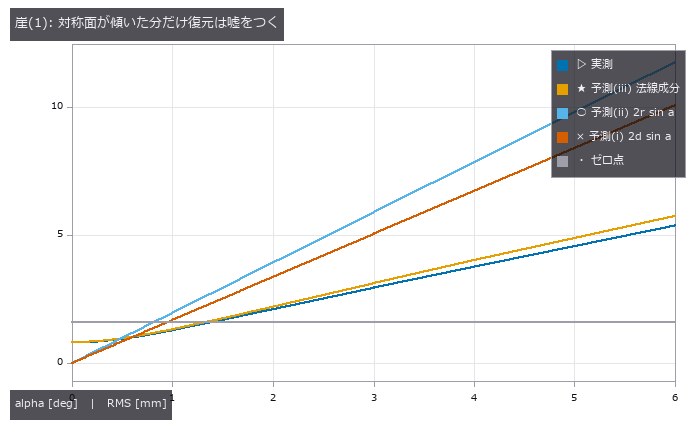
↑ 崖は alpha = 1.39 deg(84 分角)。
| [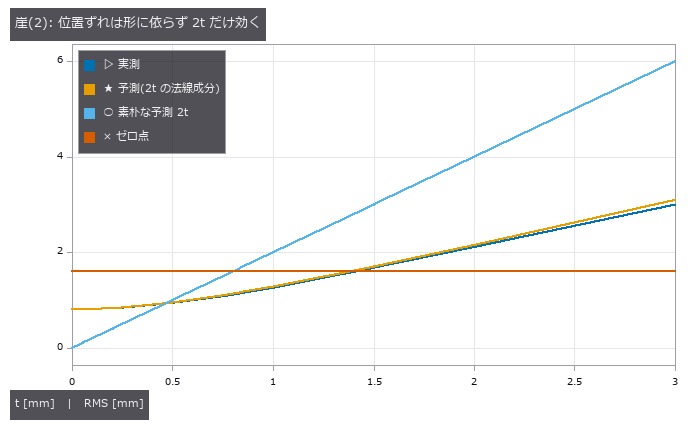](https://raw.githubusercontent.com/furuse-kazufumi/fullseye/master/docs/articles/assets/poc/poc_symmetry_restoration/05_offset_cliff.png) |
| *↑ 鏡像点は厳密に 2t 動くが、表面誤差になるのはその法線成分( | n.x | の RMS = 0.50)だけ。* |
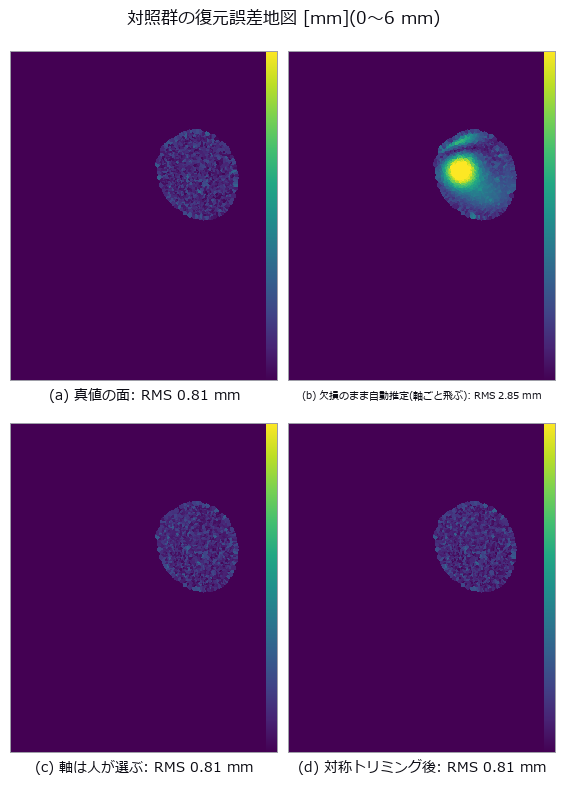
↑ 欠損のまま推定した面で復元すると、欠損部の全体が一様にずれる(位置ずれの署名)。
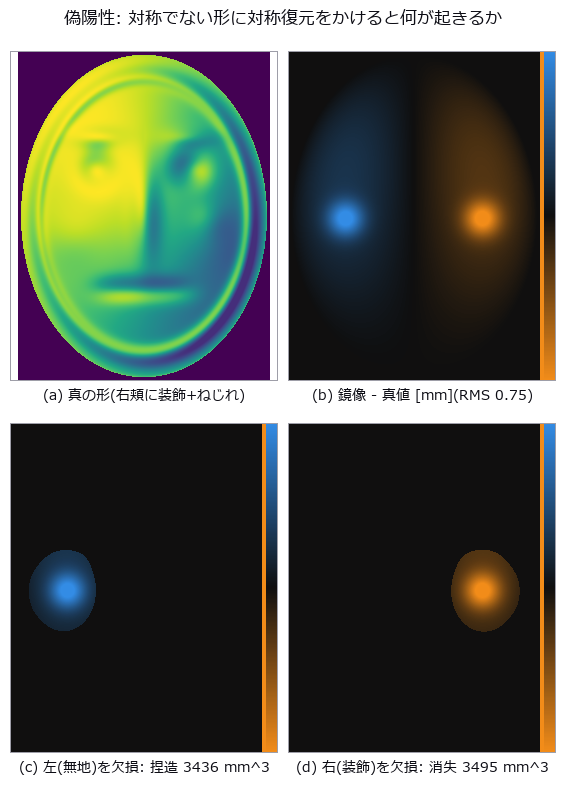
↑ 色は「鏡像 - 真値」。
py -3.11 examples/poc_symmetry_restoration.py
Source: examples/poc_symmetry_restoration.py
This run produced 10 figures in total - see them all
Ops used (notes): detect_reflection_symmetry · fill_holes · fit_plane_3d · icp_point2point_3d · normalize · reflect_points · reflection_symmetry_score
No.2026.146 —— Endless Zooms and Turning Solids: Making the Return Itself the Ground Truth
| Motion that never ends still carries equations you can score without watching it end: an infinite zoom returns to the identical picture once you have zoomed by the self-similarity ratio, and a rotating solid returns after 2 pi. Neither loop is made by cutting back to the first frame; both follow from the construction, so the truth is exactly zero difference. The material is Pascal’s triangle mod 2 - the same truth that rule 90 satisfies - and the hierarchy of its gaps has a closed form: with I = floor(u2^D), J = floor(v2^D) and b the position of the highest set bit of I & J, the depth is d = D - b. Halving u shifts I right by one, so b drops by one and d rises by exactly one, which is why zooming never costs resolution: every pixel is decided by an integer bit test rather than by magnifying a raster. Over a loop that zooms eight-fold, frame(T) and frame(0) differ by 0.0e+00. The first core finding is that the measured dimension does not move at all under zoom: the existing fractal_dimension operator returns the same value across six zoom levels with a standard deviation of exactly zero, and where the depth of the approximant matches the pixel grid it equals log2(3) = 1.584962500721 to within 8.9e-16 - an agreement, not an approximation. The second is that the same operator returns 0.0 when handed an approximant finer than the pixels; that zero does not mean there is no structure, it means the structure is finer than the sampling, and indeed the level-9 approximant has zero foreground pixels out of 262,144. The third is that 2 pi does not close in floating point: building the rotation from the angle 2pii/T leaves 1.40e-12 in the normals at i = T because sin(2 pi) is -2.45e-16, while closing the period on the integer index instead gives exactly zero. The fourth is a prediction that was wrong and has been left in: the silhouette area of a cube under orthographic projection is a^2( | cos | + | sin | ), and the measured two per cent residual was read as the bevel that marching cubes puts on the corners - but pushing the camera from a distance of 6 to 96 dropped the residual from 0.128 to 0.004 for the exact cube and the marching-cubes cube alike, so the floor was perspective, not the mesh. The bevel shows up instead in a quantity that distance does not fix: the ratio of maximum to minimum silhouette area converges to sqrt(2) = 1.4142 for the exact cube but stops at 1.3958 for the extracted surface. Separating one residual into two causes came from sweeping the distance. Two smaller findings: the four-fold symmetry of the depth field is exact while the rendered image breaks it by 1.1e-16, which is the order of summation in a 2x2 average rather than any mathematics; and the two labyrinths of the gyroid have a volume ratio of 0.500000000000, which follows from the odd symmetry. No new operator was added. |

| ↑ Endless Zooms and Turning Solids: Making the Return Itself the Ground Truth ―― Motion that never ends still carries equations you can score without watching it end: an infinite zoom returns to the identical picture once you have zoomed by the self-similarity ratio, and a rotating solid returns after 2 pi. Neither loop is made by cutting back to the first frame; both follow from the construction, so the truth is exactly zero difference. The material is Pascal’s triangle mod 2 - the same truth that rule 90 satisfies - and the hierarchy of its gaps has a closed form: with I = floor(u2^D), J = floor(v2^D) and b the position of the highest set bit of I & J, the depth is d = D - b. Halving u shifts I right by one, so b drops by one and d rises by exactly one, which is why zooming never costs resolution: every pixel is decided by an integer bit test rather than by magnifying a raster. Over a loop that zooms eight-fold, frame(T) and frame(0) differ by 0.0e+00. The first core finding is that the measured dimension does not move at all under zoom: the existing fractal_dimension operator returns the same value across six zoom levels with a standard deviation of exactly zero, and where the depth of the approximant matches the pixel grid it equals log2(3) = 1.584962500721 to within 8.9e-16 - an agreement, not an approximation. The second is that the same operator returns 0.0 when handed an approximant finer than the pixels; that zero does not mean there is no structure, it means the structure is finer than the sampling, and indeed the level-9 approximant has zero foreground pixels out of 262,144. The third is that 2 pi does not close in floating point: building the rotation from the angle 2pi*i/T leaves 1.40e-12 in the normals at i = T because sin(2 pi) is -2.45e-16, while closing the period on the integer index instead gives exactly zero. The fourth is a prediction that was wrong and has been left in: the silhouette area of a cube under orthographic projection is a^2( | cos | + | sin | ), and the measured two per cent residual was read as the bevel that marching cubes puts on the corners - but pushing the camera from a distance of 6 to 96 dropped the residual from 0.128 to 0.004 for the exact cube and the marching-cubes cube alike, so the floor was perspective, not the mesh. The bevel shows up instead in a quantity that distance does not fix: the ratio of maximum to minimum silhouette area converges to sqrt(2) = 1.4142 for the exact cube but stops at 1.3958 for the extracted surface. Separating one residual into two causes came from sweeping the distance. Two smaller findings: the four-fold symmetry of the depth field is exact while the rendered image breaks it by 1.1e-16, which is the order of summation in a 2x2 average rather than any mathematics; and the two labyrinths of the gyroid have a volume ratio of 0.500000000000, which follows from the odd symmetry. No new operator was added.* |

↑ The measurement ―― 右は 2 枚の差をそのまま出したもので、全画素が 0(最大差 0.0e+00)。倍率を 8 倍にしたのに同じ絵になるのは、色の巡回(周期 3)が深さの巡回とちょうど噛み合うから。 (figure labels are in Japanese; the numbers are the same)

↑ **空隙の深さ(色 = 深さ、深いほど濃い)。

↑ 左から深さ 5..9。

↑ 正射影ならシルエット面積は a²(|cosθ| + |sinθ|) で、45 度が最大(√2 倍)。

↑ 厳密な立方体は √2 = 1.4142 に収束する(1.4167)のに、marching cubes で取り出した面は 1.3958 で止まる。
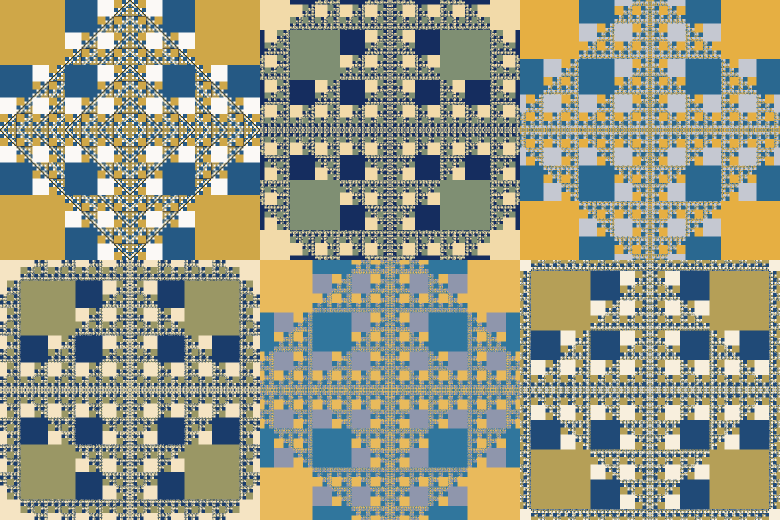
↑ The animation ―― 止めどきは呼んだ側が決める。24 コマで 1 周(8 倍)、そこから先は同じ絵が続く。
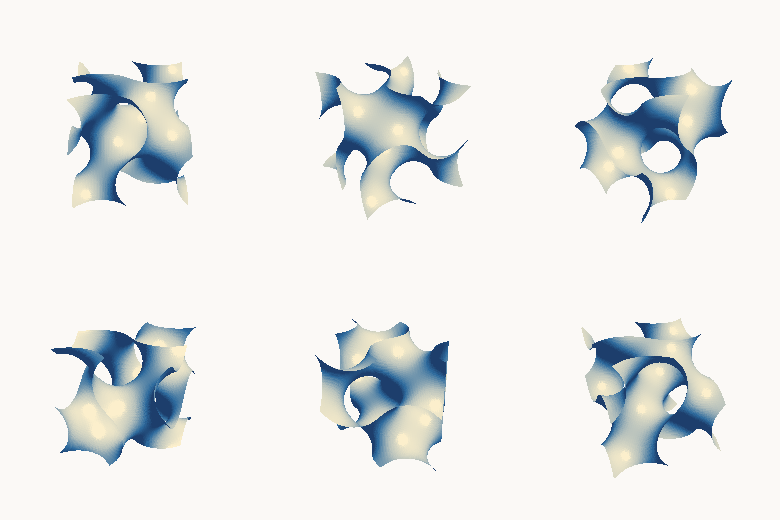
↑ The animation ―― 1 周 18 コマ。添字の剰余で角度を作っているので、18 コマ目は 0 コマ目と画素単位で同じ。
py -3.11 examples/poc_endless_zoom_and_turning_solids.py
Source: examples/poc_endless_zoom_and_turning_solids.py
This run produced 15 figures in total - see them all
Ops used (notes): fractal_dimension · gyroid_isosurface · mesh_volume · perpetual_loop_seam · phong_shade
No.2026.149 —— Scoring Four-Dimensional Claims with Ordinary Three-Dimensional Operators
The topology and algebra of four dimensions can be scored exactly by ordinary three-dimensional operators already in the box: fitting a circle to a point cloud, the signed volume of a closed mesh, tube meshing and rasterising. The Hopf fibration splits the three-sphere into circles indexed by points of the two-sphere: viewing a point of S^3 as a pair of complex numbers, the fibre over a point of S^2 is the circle q(t) = (cos(theta/2) e^{it}, sin(theta/2) e^{i(t+phi)}), and stereographic projection carries it to an exact circle in space - a Villarceau circle. The first finding is that a four-dimensional circle becomes a two-dimensional point: pushing one fibre through the Hopf map leaves a spread of 8.9e-16 on the sphere, so all 256 sampled points collapse onto one. The second is that the circle-fitting operator recognises it: the projected radius ranges from 0.70 to 7.34 across latitudes, yet the fit residual and the departure from a single plane both stay in the 1e-14 range - a theorem, not an approximation. The third is that two distinct fibres always link exactly once, that the integer emerges from the Gauss integral, and that even the rate of convergence is predictable: doubling the discretisation divides the error by exactly four, measured at 4.01, 4.00, 4.00 and 4.00, confirming the predicted second order. The fourth concerns rotation: in four dimensions a rotation acts in two planes at once, and the motion closes only for rational ratios. A tesseract - 16 vertices, 32 edges, 24 faces, 8 cells, Euler characteristic exactly 0, hypervolume exactly 16 for edge 2 - turned simultaneously in the xy and zw planes returns after sixty steps for ratios 1:2, 2:3 and 3:4 with a difference of 0.0e+00, while the minimum separation along the way stays above 0.23, so it is not the trivial case of nothing having moved. For the golden ratio, refining the step to 400 and running twenty thousand steps still leaves a minimum separation of 0.0257. The period closes because the angle is built from an integer remainder rather than accumulated arithmetic. The fifth finding separates two sources of error in the volume of a tube. Writing two closed forms - one for a circular cross-section on a circular centreline, one for a regular m-gon cross-section on a circular centreline - makes the discrepancy against the second completely independent of m: for a fixed centreline the three cross-sections agree to 7.8e-16. The cross-section’s own contribution then vanishes as 1/m^2 exactly as its closed form says, with ratios 3.99 and 4.00. One prediction was wrong and has been left in: the centreline’s contribution was expected to vanish as 1/n^2, but doubling and quadrupling the sample count divides it by only 2.09 and 4.15, that is as 1/n - and since the perimeter of the inscribed polygon converges as 1/n^2, the residue cannot come from the perimeter but from the thickness at the joints. Consequently neither knob alone suffices: 96 sides alone stalls at -0.001588 and 1600 centreline points alone at -0.003064, while turning both reaches -0.000925. No new operator was added.

↑ Scoring Four-Dimensional Claims with Ordinary Three-Dimensional Operators ―― The topology and algebra of four dimensions can be scored exactly by ordinary three-dimensional operators already in the box: fitting a circle to a point cloud, the signed volume of a closed mesh, tube meshing and rasterising. The Hopf fibration splits the three-sphere into circles indexed by points of the two-sphere: viewing a point of S^3 as a pair of complex numbers, the fibre over a point of S^2 is the circle q(t) = (cos(theta/2) e^{it}, sin(theta/2) e^{i(t+phi)}), and stereographic projection carries it to an exact circle in space - a Villarceau circle. The first finding is that a four-dimensional circle becomes a two-dimensional point: pushing one fibre through the Hopf map leaves a spread of 8.9e-16 on the sphere, so all 256 sampled points collapse onto one. The second is that the circle-fitting operator recognises it: the projected radius ranges from 0.70 to 7.34 across latitudes, yet the fit residual and the departure from a single plane both stay in the 1e-14 range - a theorem, not an approximation. The third is that two distinct fibres always link exactly once, that the integer emerges from the Gauss integral, and that even the rate of convergence is predictable: doubling the discretisation divides the error by exactly four, measured at 4.01, 4.00, 4.00 and 4.00, confirming the predicted second order. The fourth concerns rotation: in four dimensions a rotation acts in two planes at once, and the motion closes only for rational ratios. A tesseract - 16 vertices, 32 edges, 24 faces, 8 cells, Euler characteristic exactly 0, hypervolume exactly 16 for edge 2 - turned simultaneously in the xy and zw planes returns after sixty steps for ratios 1:2, 2:3 and 3:4 with a difference of 0.0e+00, while the minimum separation along the way stays above 0.23, so it is not the trivial case of nothing having moved. For the golden ratio, refining the step to 400 and running twenty thousand steps still leaves a minimum separation of 0.0257. The period closes because the angle is built from an integer remainder rather than accumulated arithmetic. The fifth finding separates two sources of error in the volume of a tube. Writing two closed forms - one for a circular cross-section on a circular centreline, one for a regular m-gon cross-section on a circular centreline - makes the discrepancy against the second completely independent of m: for a fixed centreline the three cross-sections agree to 7.8e-16. The cross-section’s own contribution then vanishes as 1/m^2 exactly as its closed form says, with ratios 3.99 and 4.00. One prediction was wrong and has been left in: the centreline’s contribution was expected to vanish as 1/n^2, but doubling and quadrupling the sample count divides it by only 2.09 and 4.15, that is as 1/n - and since the perimeter of the inscribed polygon converges as 1/n^2, the residue cannot come from the perimeter but from the thickness at the joints. Consequently neither knob alone suffices: 96 sides alone stalls at -0.001588 and 1600 centreline points alone at -0.003064, while turning both reaches -0.000925. No new operator was added.

↑ The measurement ―― ホップ束の繊維 4 本を立体射影して管にしたもの。★4 次元では 4 本とも同じ大きさの円なのに、3 次元へ写すと大きさが変わる —— それでも fit_circle_3d は 4 本すべてを 残差 1.4e-14 で円と認める。どの 2 本も必ず 1 回だけ絡む。 (figure labels are in Japanese; the numbers are the same)

↑ fit_circle_3d に 200 点を食わせた残差。

↑ ガウスの積分で求めた絡み数の、整数 1 からの差。

↑ 真値 B は「正 m 角形断面・円中心線」の体積。

↑ 断面の効果は閉形式どおり 1/m²(比 3.99 / 4.00)で消えるのに、中心線の効果は 1/n(比 2.09 / 4.15)でしか消えない。
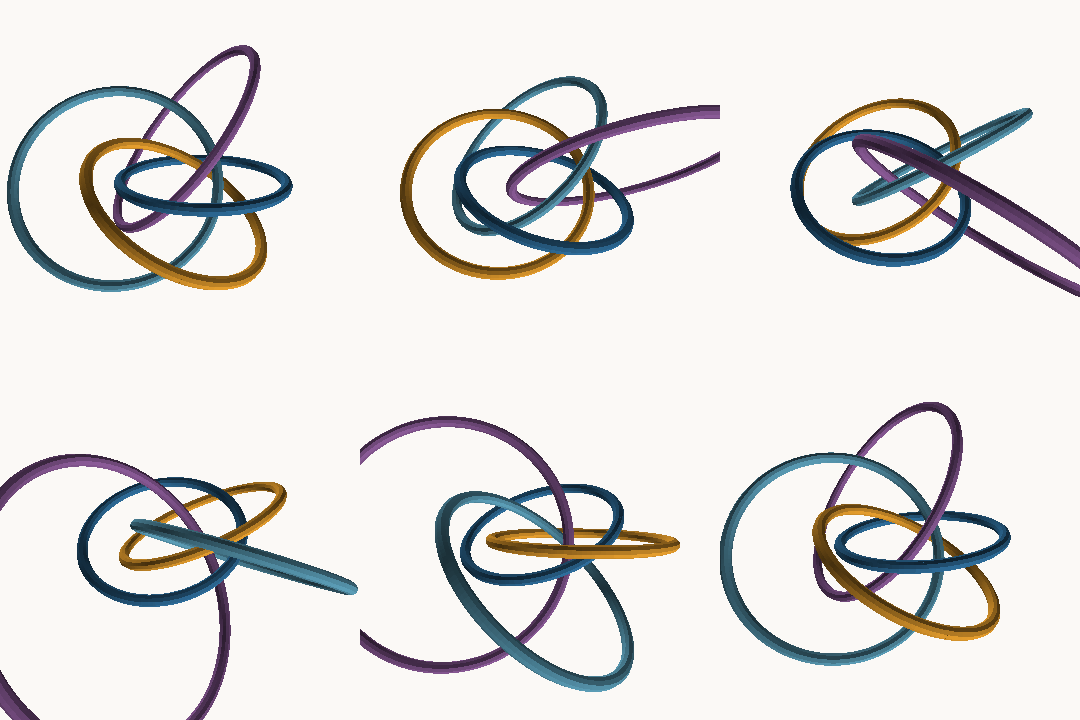
↑ The animation ―― 同じ 4 本を視点だけ回して見たもの。★視点の周期は角度でなく整数の剰余で閉じている(24 コマ目が 0 コマ目と同じ式になる)ので、継ぎ目が出ない。絡み方は視点を変えても変わらない —— 絡み数は位相の量だから。
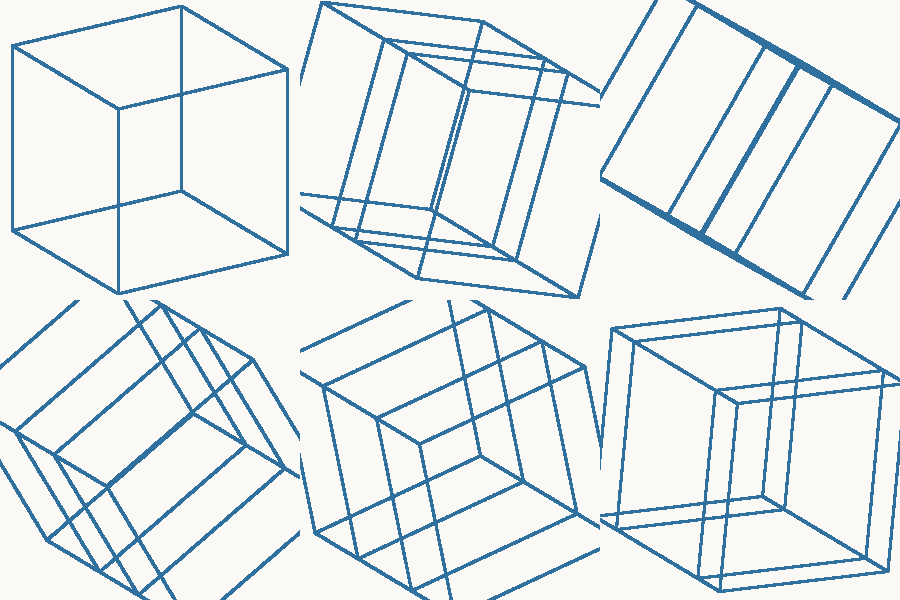
↑ The animation ―― 比 1 : 2(有理)。60 コマでちょうど元に戻る —— 戻ったときの差は 0.0e+00。★角度は整数の剰余で作っているので、有理な比なら継ぎ目が出ない。描いているのは 4 次元の超立方体を2 枚の面で同時に回してから w を落とした影。辺は 32 本とも同じ長さなのに、影では伸び縮みする。
↑ The animation ―― 比 1 : φ(無理、黄金比)。この 60 コマでは戻らない。別に刻みを 400 に細かくして 20,000 歩まで回しても、最小の隔たりは 0.0257 で 0 に落ちない。★角度は整数の剰余で作っているので、有理な比なら継ぎ目が出ない。描いているのは 4 次元の超立方体を2 枚の面で同時に回してから w を落とした影。辺は 32 本とも同じ長さなのに、影では伸び縮みする。
py -3.11 examples/poc_four_dimensions_by_three_d_tools.py
Source: examples/poc_four_dimensions_by_three_d_tools.py
This run produced 10 figures in total - see them all
Ops used (notes): curve3d_tube_mesh · fit_circle_3d · mesh_volume
No.2026.277 —— The Venue Buildings and Asteroid Itokawa on One Ruler — Turning PLATEAU CityGML LOD2 into a Triangle Mesh
The author’s idea: put Itokawa (about 535 m) next to the venue buildings and the size becomes tangible. A new op, plateau_lod2_mesh, reads the ViEW2026 venue (Pacifico Yokohama, Minato Mirai) from MLIT’s Project PLATEAU 3D city model (CityGML 2.0, LOD2): the building body and each BuildingPart become one part, and the thematic surfaces (ground, wall, roof) are triangulated (holes bridged to the outer ring and ear-clipped, outward orientation kept). Coordinates go exactly from EPSG:6697 (latitude, longitude, height) through GRS80 Earth-centred Cartesian coordinates into the ENU frame [m] of the tangent plane at the ground centroid. A CRS other than 6697, unknown geometry, a thematic surface not in the table, an unresolved xlink or a height unit other than metres is refused rather than skipped (fail-closed). The seven venue parts (hotel tower with the conference centre = one PLATEAU part, the National Convention Hall, the exhibition hall, the annex hall, the North building and two low-rise annexes) ship as a 112 kB npz; the recipe and its gates stay in the tool. Gates: a synthetic gabled building gives heights of 12 / 4 m, volumes of 2000 / 144 m³ (divergence theorem) and a holed-roof area of 2·20·√41 + 36 − 4 m² in closed form (1e-5), the ellipsoid round trip holds to 1e-6 m, over the seven venue parts the mesh height (highest roof point minus lowest ground point) differs from CityGML measuredHeight by at most 0.045 m (within half the 0.1 m rounding step), the extents measured by a second formula (equirectangular) on coordinates pulled from the raw bytes by regex differ by 0.005 m, and every face points outward. Itokawa’s 535 m length is 2.0 times the exhibition hall’s long side of 263 m and 3.8 hotel-tower heights of 142.1 m. Figures: the venue (left) and Itokawa (right) dropped onto the same 2 m grid seen from above, and a silhouette from the south. Honestly: the bundled 3000-point cloud spans 562 × 298 × 244 m along its principal axes, 1 to 17 % more than the published 535 × 294 × 209 m, a difference in how axes and extents are taken, so it is not a gate. This PLATEAU vintage carries no building names, so the parts were identified by coordinates and checked against public map positions. The geoid height is ignored (6e-6 relative horizontal error). Attribution: processed from the 3D City Model (Project PLATEAU), Yokohama City (FY2020), MLIT Japan (https://www.geospatial.jp/ckan/dataset/plateau-14100-yokohama-city-2020), PDL1.0, compatible with CC BY 4.0. The extraction of seven parts, the coordinate conversion and the triangulation are Fullseye’s own processing, not an MLIT product. The Itokawa points are decimated from the Gaskell shape model (PDS Small Bodies Node).

↑ The Venue Buildings and Asteroid Itokawa on One Ruler — Turning PLATEAU CityGML LOD2 into a Triangle Mesh ―― The author’s idea: put Itokawa (about 535 m) next to the venue buildings and the size becomes tangible. A new op, plateau_lod2_mesh, reads the ViEW2026 venue (Pacifico Yokohama, Minato Mirai) from MLIT’s Project PLATEAU 3D city model (CityGML 2.0, LOD2): the building body and each BuildingPart become one part, and the thematic surfaces (ground, wall, roof) are triangulated (holes bridged to the outer ring and ear-clipped, outward orientation kept). Coordinates go exactly from EPSG:6697 (latitude, longitude, height) through GRS80 Earth-centred Cartesian coordinates into the ENU frame [m] of the tangent plane at the ground centroid. A CRS other than 6697, unknown geometry, a thematic surface not in the table, an unresolved xlink or a height unit other than metres is refused rather than skipped (fail-closed). The seven venue parts (hotel tower with the conference centre = one PLATEAU part, the National Convention Hall, the exhibition hall, the annex hall, the North building and two low-rise annexes) ship as a 112 kB npz; the recipe and its gates stay in the tool. Gates: a synthetic gabled building gives heights of 12 / 4 m, volumes of 2000 / 144 m³ (divergence theorem) and a holed-roof area of 2·20·√41 + 36 − 4 m² in closed form (1e-5), the ellipsoid round trip holds to 1e-6 m, over the seven venue parts the mesh height (highest roof point minus lowest ground point) differs from CityGML measuredHeight by at most 0.045 m (within half the 0.1 m rounding step), the extents measured by a second formula (equirectangular) on coordinates pulled from the raw bytes by regex differ by 0.005 m, and every face points outward. Itokawa’s 535 m length is 2.0 times the exhibition hall’s long side of 263 m and 3.8 hotel-tower heights of 142.1 m. Figures: the venue (left) and Itokawa (right) dropped onto the same 2 m grid seen from above, and a silhouette from the south. Honestly: the bundled 3000-point cloud spans 562 × 298 × 244 m along its principal axes, 1 to 17 % more than the published 535 × 294 × 209 m, a difference in how axes and extents are taken, so it is not a gate. This PLATEAU vintage carries no building names, so the parts were identified by coordinates and checked against public map positions. The geoid height is ignored (6e-6 relative horizontal error). Attribution: processed from the 3D City Model (Project PLATEAU), Yokohama City (FY2020), MLIT Japan (https://www.geospatial.jp/ckan/dataset/plateau-14100-yokohama-city-2020), PDL1.0, compatible with CC BY 4.0. The extraction of seven parts, the coordinate conversion and the triangulation are Fullseye’s own processing, not an MLIT product. The Itokawa points are decimated from the Gaskell shape model (PDS Small Bodies Node).

↑ The measurement ―― 南から見た影絵。ホテル棟 142 m とイトカワの厚み(約 209〜244 m)を同じ縮尺で (figure labels are in Japanese; the numbers are the same)
py -3.11 examples/poc_plateau_venue_lod2.py
Source: examples/poc_plateau_venue_lod2.py
This run produced 2 figures in total - see them all
Ops used (notes): plateau_lod2_mesh
No.2026.279 —— How One Star Image Reveals Satellite Attitude
A seeded 196-star synthetic catalogue and a 128 by 128 synthetic image with PSF (point spread function), photon noise and read noise are used; two hot pixels absent from the catalogue are added. Without the true attitude or visible-star rows, triangle angles match all 18 star_detect detections against the shuffled full catalogue, reject the false points, and let kabsch solve the rotation. The result has 16 genuine stars, zero mismatches, 2 of 2 false points rejected and 0.0046-degree attitude error, below the 0.1406-degree angular pixel width. The kabsch and direct-SVD rotations differ by less than 1e-12. Sun or Moon glare, too few stars and trails during fast slew are an explicitly uncomputed ok:false limit. No real catalogue, external image, operator or product name is used.

↑ How One Star Image Reveals Satellite Attitude ―― A seeded 196-star synthetic catalogue and a 128 by 128 synthetic image with PSF (point spread function), photon noise and read noise are used; two hot pixels absent from the catalogue are added. Without the true attitude or visible-star rows, triangle angles match all 18 star_detect detections against the shuffled full catalogue, reject the false points, and let kabsch solve the rotation. The result has 16 genuine stars, zero mismatches, 2 of 2 false points rejected and 0.0046-degree attitude error, below the 0.1406-degree angular pixel width. The kabsch and direct-SVD rotations differ by less than 1e-12. Sun or Moon glare, too few stars and trails during fast slew are an explicitly uncomputed ok:false limit. No real catalogue, external image, operator or product name is used.
Terms: PSF — The spatial response of an imaging system to a point object, describing how that point is blurred in the image.
↑ The measurement ―― 三角形の角距離で全196星表を探索し、ホットピクセル2個を外れ値として棄却した。 (figure labels are in Japanese; the numbers are the same)
↑ 推定値は合成像の検出点から計算し、真値は採点だけに使った。
py -3.11 examples/poc_star_tracker.py
Source: examples/poc_star_tracker.py
This run produced 3 figures in total - see them all
This museum was built together with Claude Code. I set the questions and the direction; Claude Code did the implementation, the sweeps, the control groups and the adversarial checks. That division of labour is what made it possible to run 53 PoCs and collect their figures in two days. If you want to try it, this invitation link gives you a one-week free trial: claude.ai/referral/0sqPw8E_lw
If even one exhibit was worth your time, a like or a stock helps: the reactions decide which wing grows next, so tell me in the comments which measurement from your own field you would want to see. And if you swapped in real data and the cliff moved, that is the story I most want to hear.