fullseye
A Paper Science Museum — the Classic 2-D Operator Wing (14 exhibits)
A wing built only from classic 2-D operators, chosen so that it does not overlap
the existing Science-Museum wing (11 exhibits) or Museum wing (30). Every picture is
the real output of a registered Fullseye op; the material is either synthetic or
skimage.data (BSD / public domain). Every number in a caption was measured at
generation time, and the raw arrays are in
docs/articles/assets/_wing2d_meta.json.
Three ways of bundling: tiles (things you compare side by side), flip-book GIFs (a process advancing at constant frame size), and sweep GIFs (where a labelled graph is the point). One sheet or one GIF counts as one exhibit.
Regenerate with py -3.11 tools/gen_wing2d_gallery.py (--subjects <name,...> for
a single exhibit).
1. The 4 morphology siblings — which of them removes what
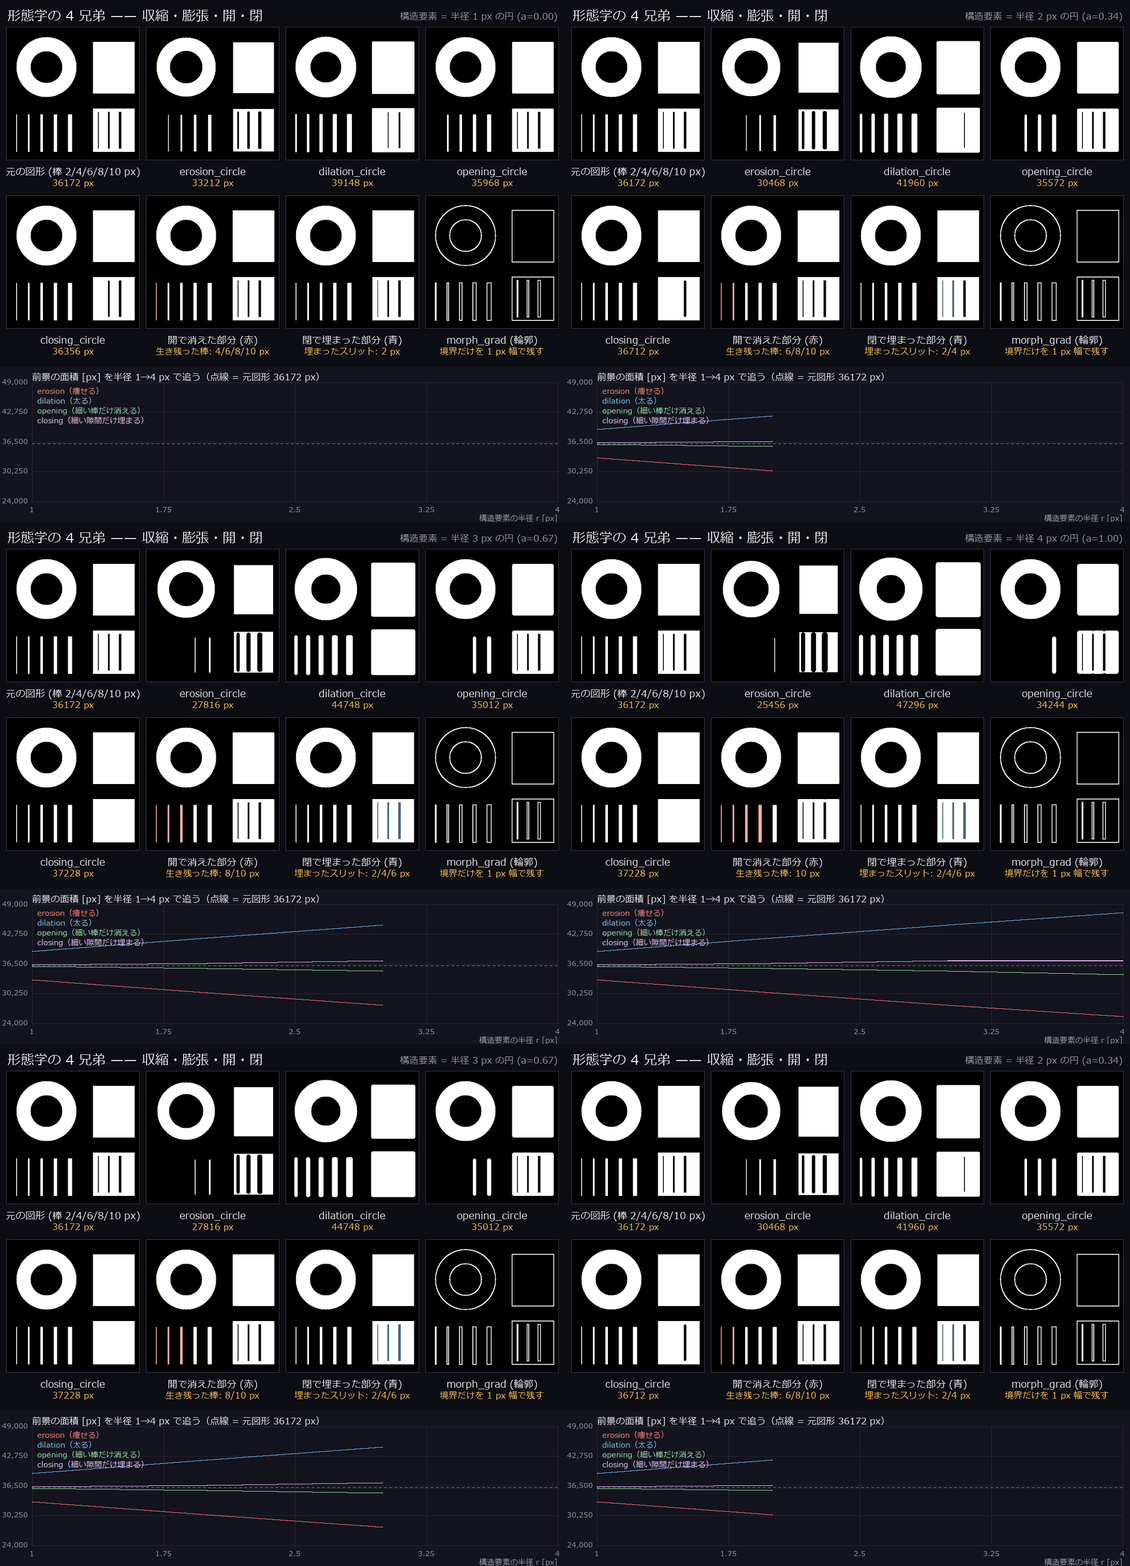
↑ The 4 morphology siblings — which of them removes what — a figure carrying bars 2/4/6/8/10 px wide and slits 2/4/6 px wide, hit by the 4 morphology ops at radii 1→4 px. Dilation grows the area 39148→47296 px, erosion shrinks it 33212→25456 px. Opening keeps the area almost unchanged and drops only the thin bars (at r=1 the 4/6/8/10 px bars survive, at r=4 only the 10 px one), while closing fills only the thin gaps (at r=1 the 2 px slit disappears, at r=4 the 2/4/6 px slits do). Ops used: threshold, erosion_circle, dilation_circle, opening_circle, closing_circle, morph_grad.
2. What a frequency filter actually does
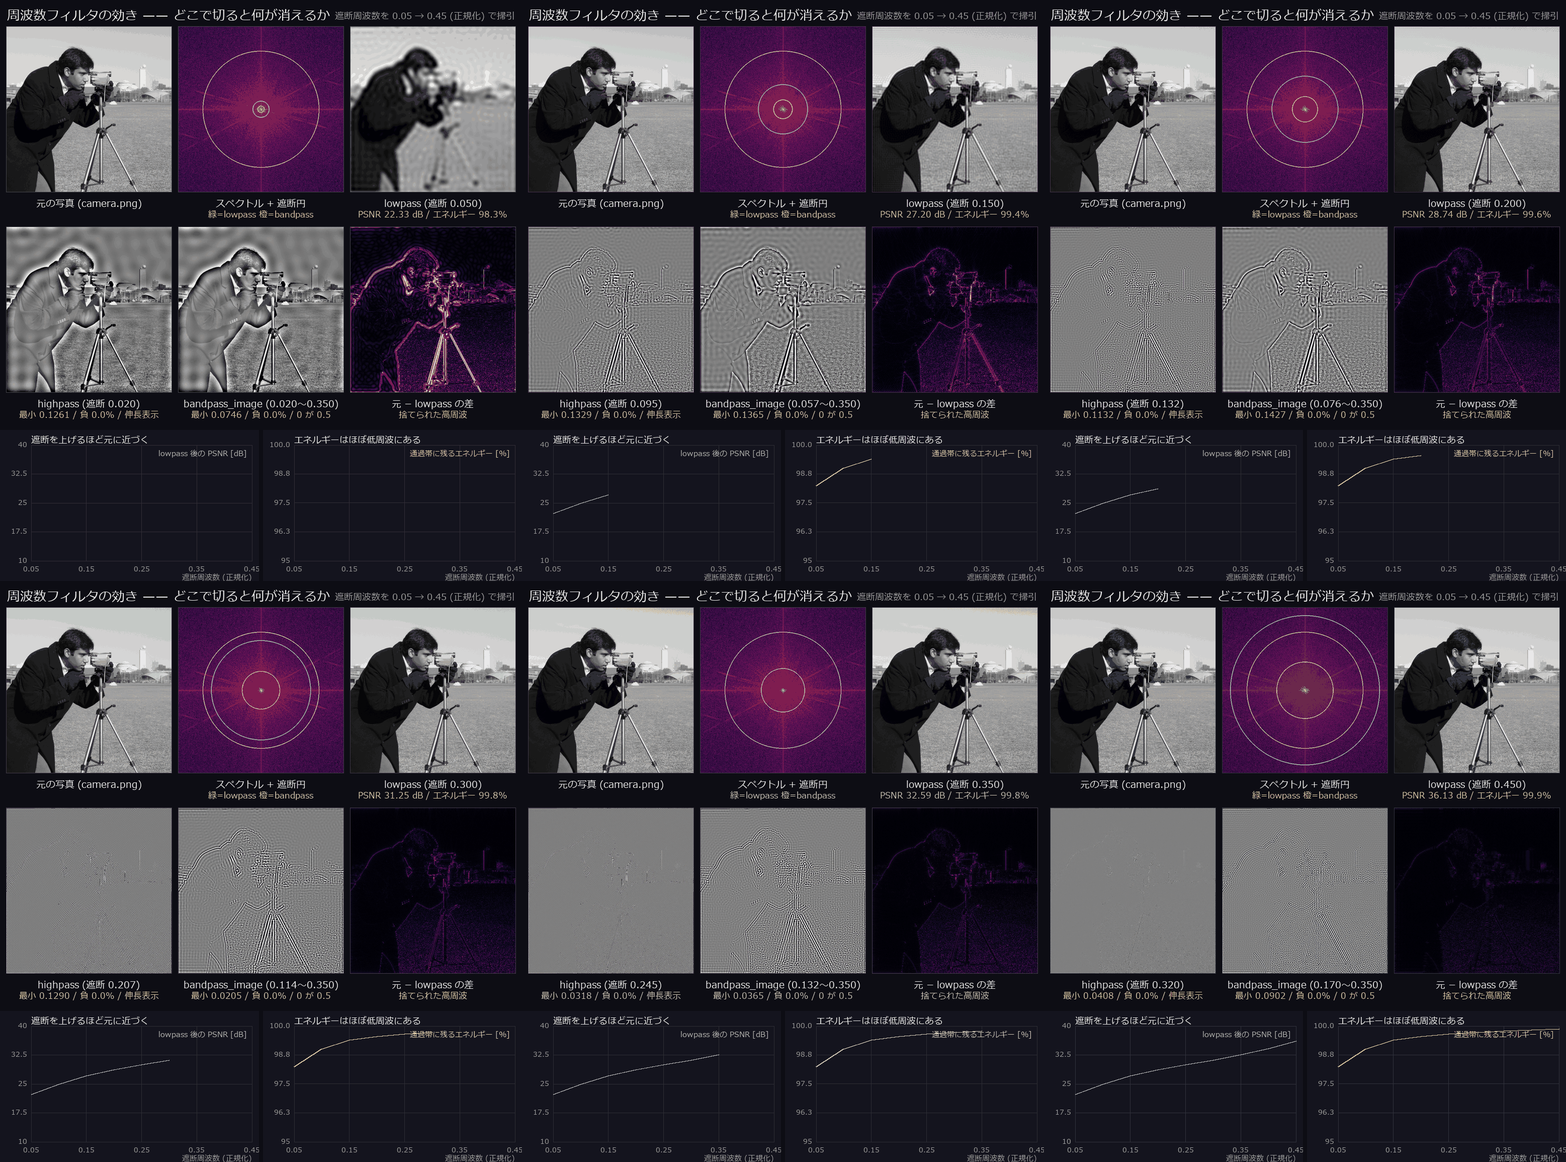
↑ What a frequency filter actually does — the same photograph through a low-pass, a high-pass and a band-pass, with the cut-off swept 0.05→0.45 (normalised). Raising the low-pass cut-off from 0.05 to 0.45 takes the PSNR against the original from 22.33 to 36.13 dB, and yet the spectral energy already inside the pass band at a cut-off of 0.05 is 98.27 % — “almost all the energy sits at low frequency, but the appearance is decided by the high frequencies” falls straight out of the numbers. Cutting a band always produces a signed response, and highpass / bandpass_image return it as [0,1] with 0 mapped to 0.5: across all 9 points of this sweep the minima are 0.0201 / 0.0205 and the fraction of negative pixels is 0.0 % (this is no longer the implementation that silently crushed about half the pixels to black). Ops used: fft_image, lowpass, highpass, bandpass_image.
3. Denoising compared — median / bilateral / NLM
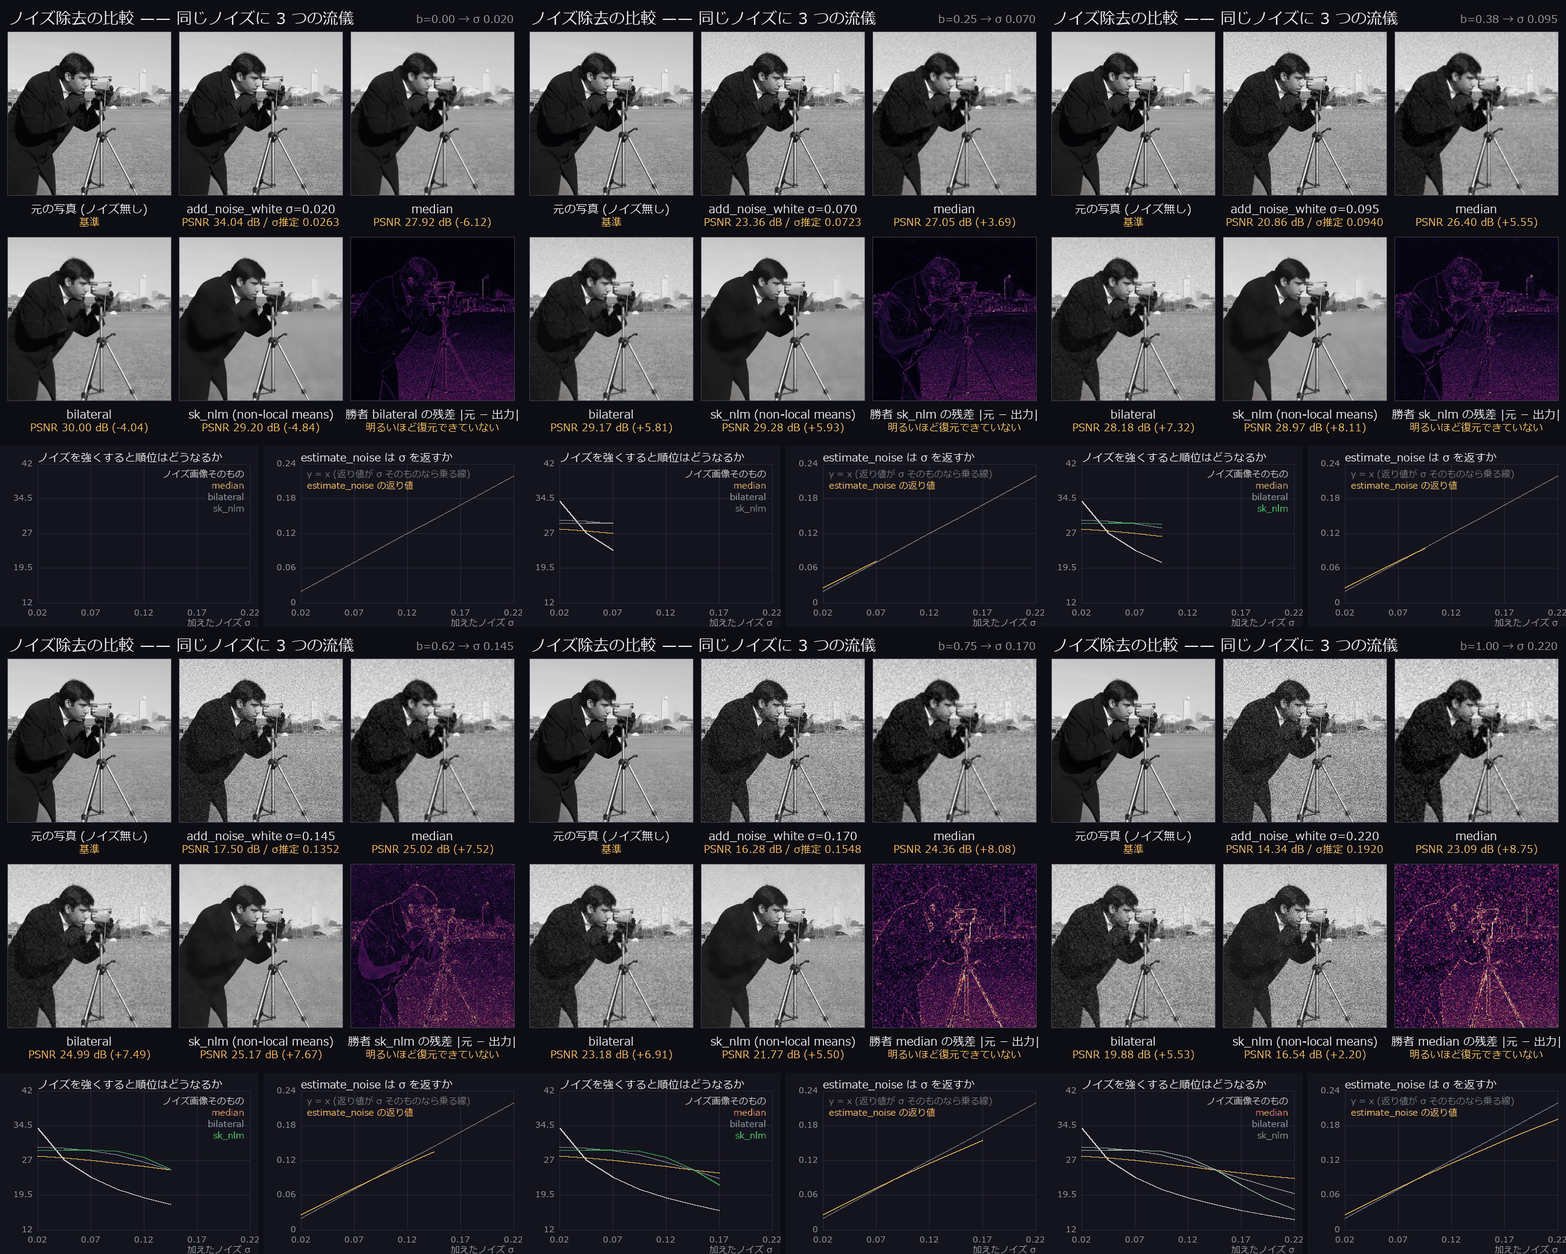
↑ Denoising compared — median / bilateral / NLM — 6 panels: white noise of σ=0.020→0.220 on the same photograph, then median, bilateral and non-local means at fixed parameters, PSNR measured. Under weak noise (σ=0.020) bilateral wins at 30.00 dB, under strong noise (σ=0.220) median takes over at 23.09 dB — “which one is strongest” depends on how much noise there is and on the settings, and the ranking changed hands 2 times over the sweep. The noisy image itself goes 34.04→14.34 dB. Handing the same images to estimate_noise returns 0.0263→0.1920, that is 131 %→87 % of the true σ; 0 of the 9 points sit at the top of the range, and a σ 3 times larger gives a different answer (this op now returns σ itself). Ops used: add_noise_white, median, bilateral, sk_nlm, estimate_noise.
4. Histogram shaping — sweeping clahe’s clip limit
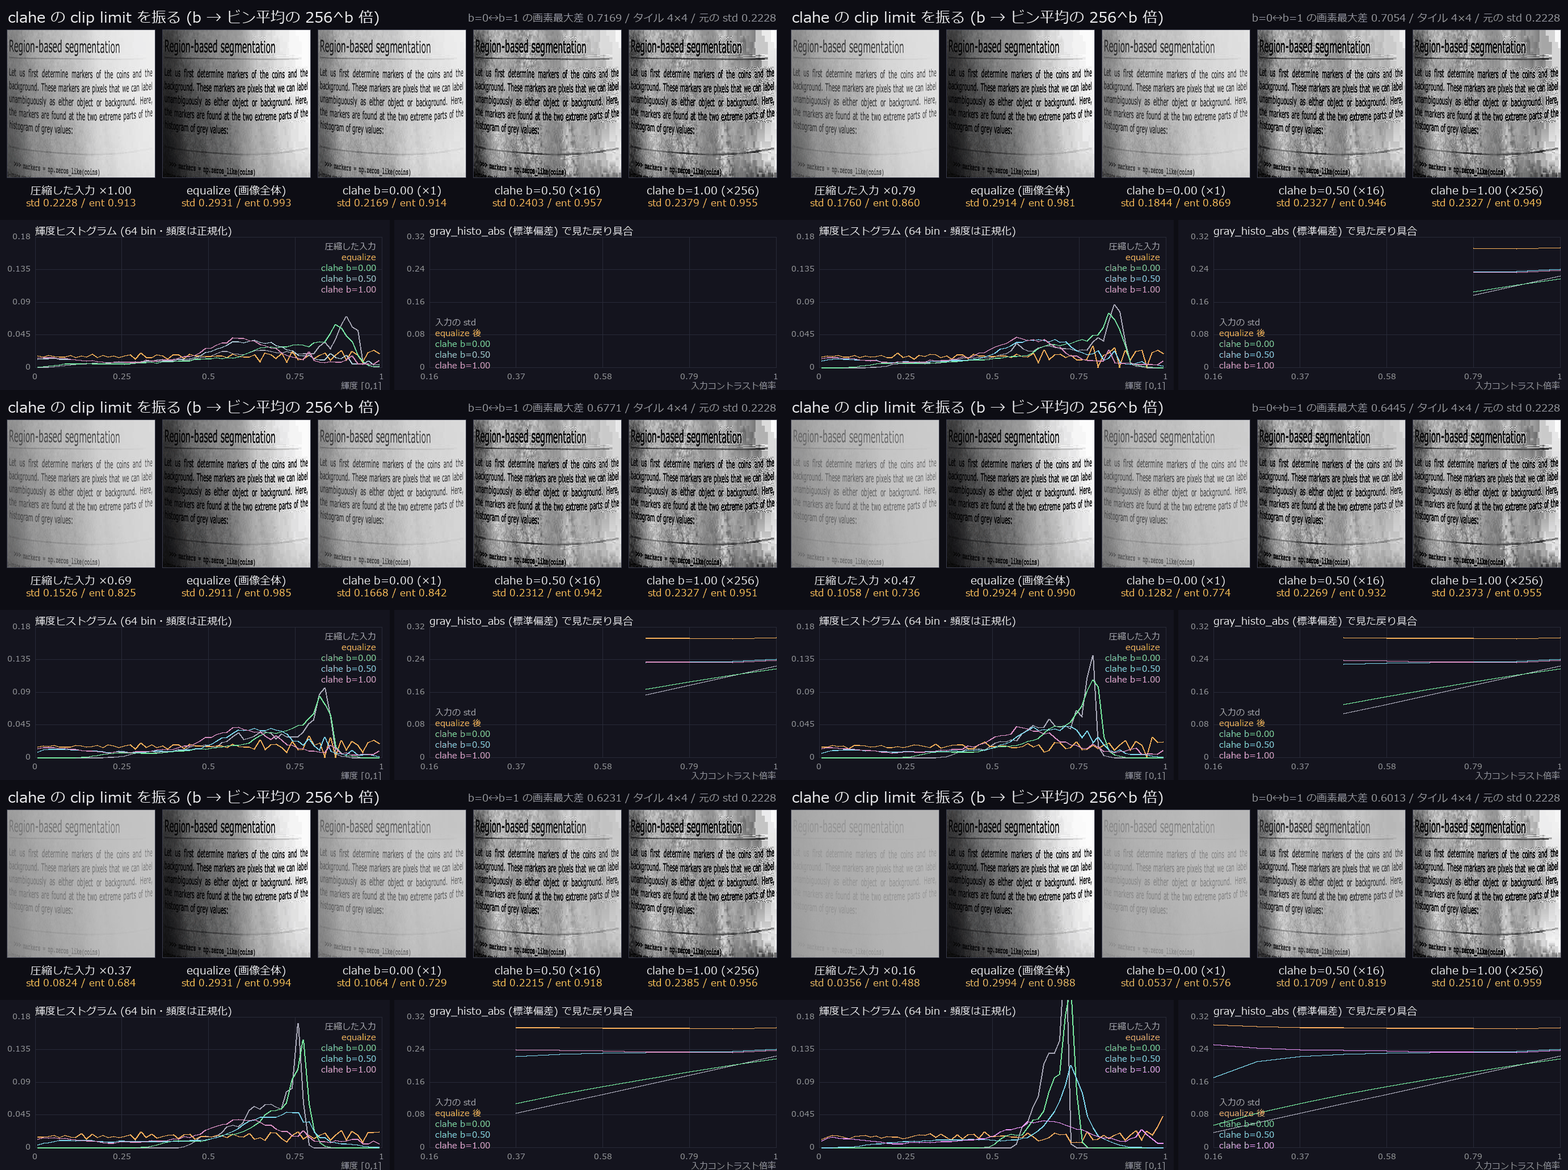
↑ Histogram shaping — sweeping clahe’s clip limit — the contrast of a document image is crushed 1.00→0.16 and we watch whether equalize and clahe bring it back. The thing to look at is clahe’s second argument b = the clip limit (a multiple 256^b of the mean bin count: b=0 → ×1 = no enhancement at all, b=1 → ×256 = clipping never bites, i.e. plain AHE; OpenCV’s default clipLimit=40 is about b≈0.665). While the input standard deviation falls 0.2228→0.0356, b=0.00 gives 0.2169→0.0537, b=0.50 gives 0.2403→0.1709 and b=1.00 gives 0.2379→0.2510. On one and the same frame the pixel difference between b=0 and b=1 opens up to 0.7169 — a single knob decides how far the collapsed input gets lifted. equalize flattens the whole image through one mapping, so it holds its width to the end (0.2931→0.2994), but the uneven illumination survives with it. Ops used: equalize, clahe, gray_histo_abs, entropy_gray.
5. Elliptic Fourier descriptors — how many harmonics bring the shape back
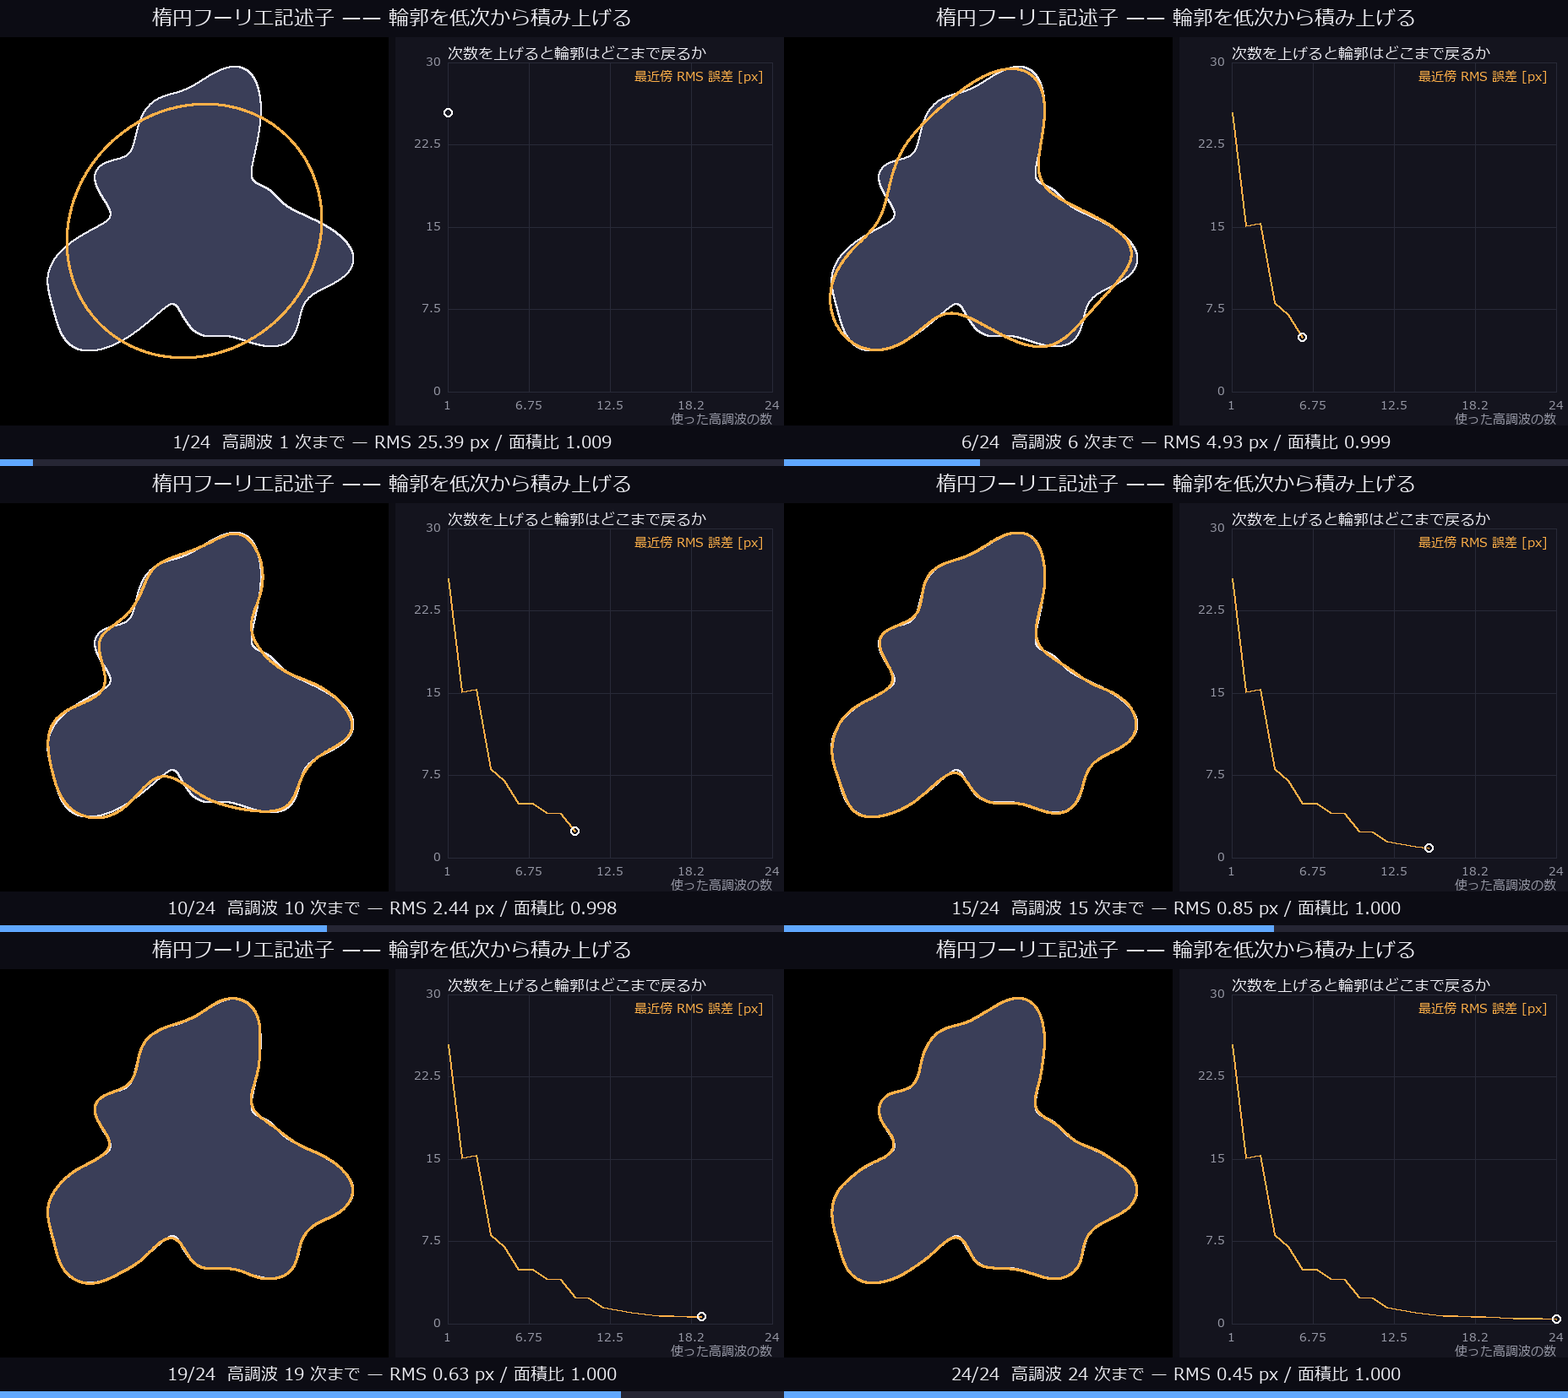
↑ Elliptic Fourier descriptors — how many harmonics bring the shape back — a 1557-point contour turned into elliptic Fourier descriptors and rebuilt while harmonics 1 to 24 are added. At order 1 (a single ellipse) the nearest-neighbour RMS error is 25.39 px, at order 15 it drops below 1 px, and at 24 it is 0.45 px. The error falls hardest when orders 2, 4 and 6 are added: an even order buys 1.955 px of improvement on average against 0.134 px for an odd one — because r = 146 + 40sin3θ + 20cos5θ + 12sin9θ appears, for a closed curve, at orders n±1 (that is, at even orders). Ops used: gen_region_polygon_filled, gen_contour_region_xld, elliptic_fourier, reconstruct.
6. Landmark morphing — and how it differs from a plain cross-fade
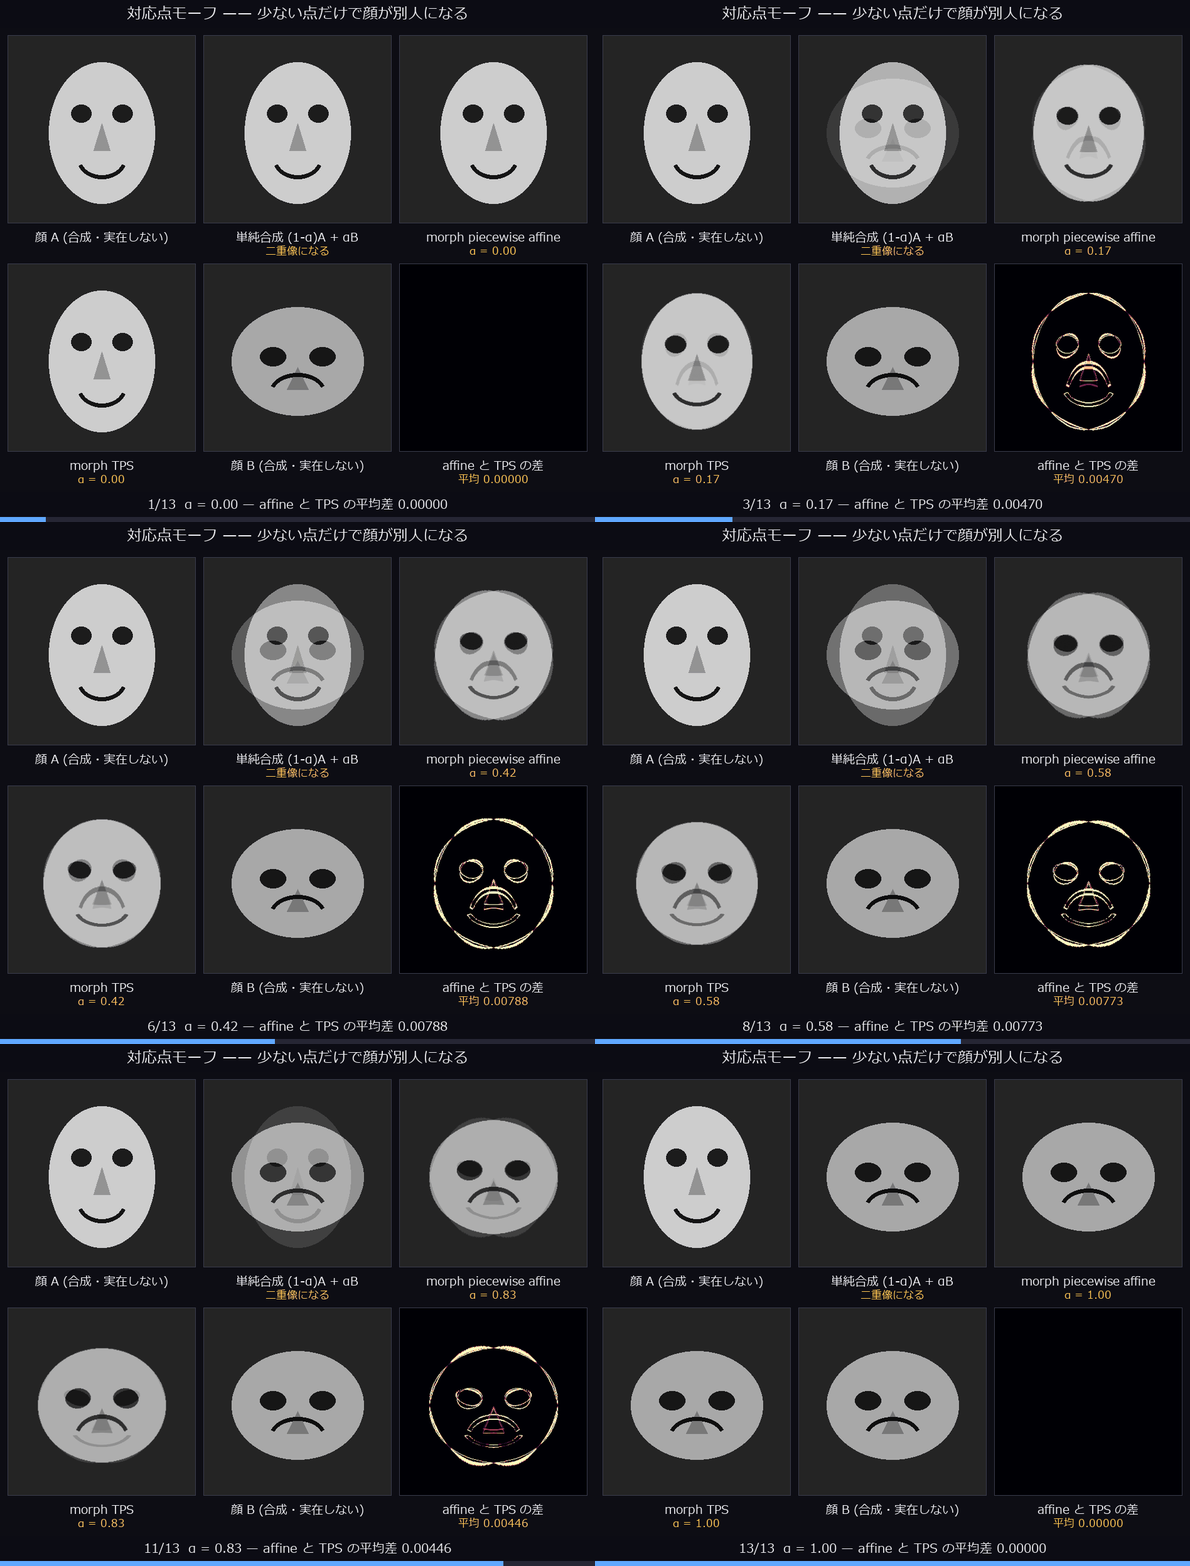
↑ Landmark morphing — and how it differs from a plain cross-fade — 6 panels morphing face A into face B from 11 landmarks alone (8 on the outline ellipse plus both eyes and the mouth). The cross-fade that uses no correspondences goes double-imaged half way through, while piecewise affine and TPS move outline, eyes and mouth continuously and in correspondence. Both ends reproduce the inputs exactly (α=0 against A gives PSNR 99.0 dB, α=1 against B gives 99.0 dB — the value this pipeline caps identity at), and the two warps differ by only 0.00802 on average at α=0.5. Ops used: morph (imagemorph), warp_piecewise_affine, warp_tps_image, blend.
7. Blob analysis — sorting grains by circularity
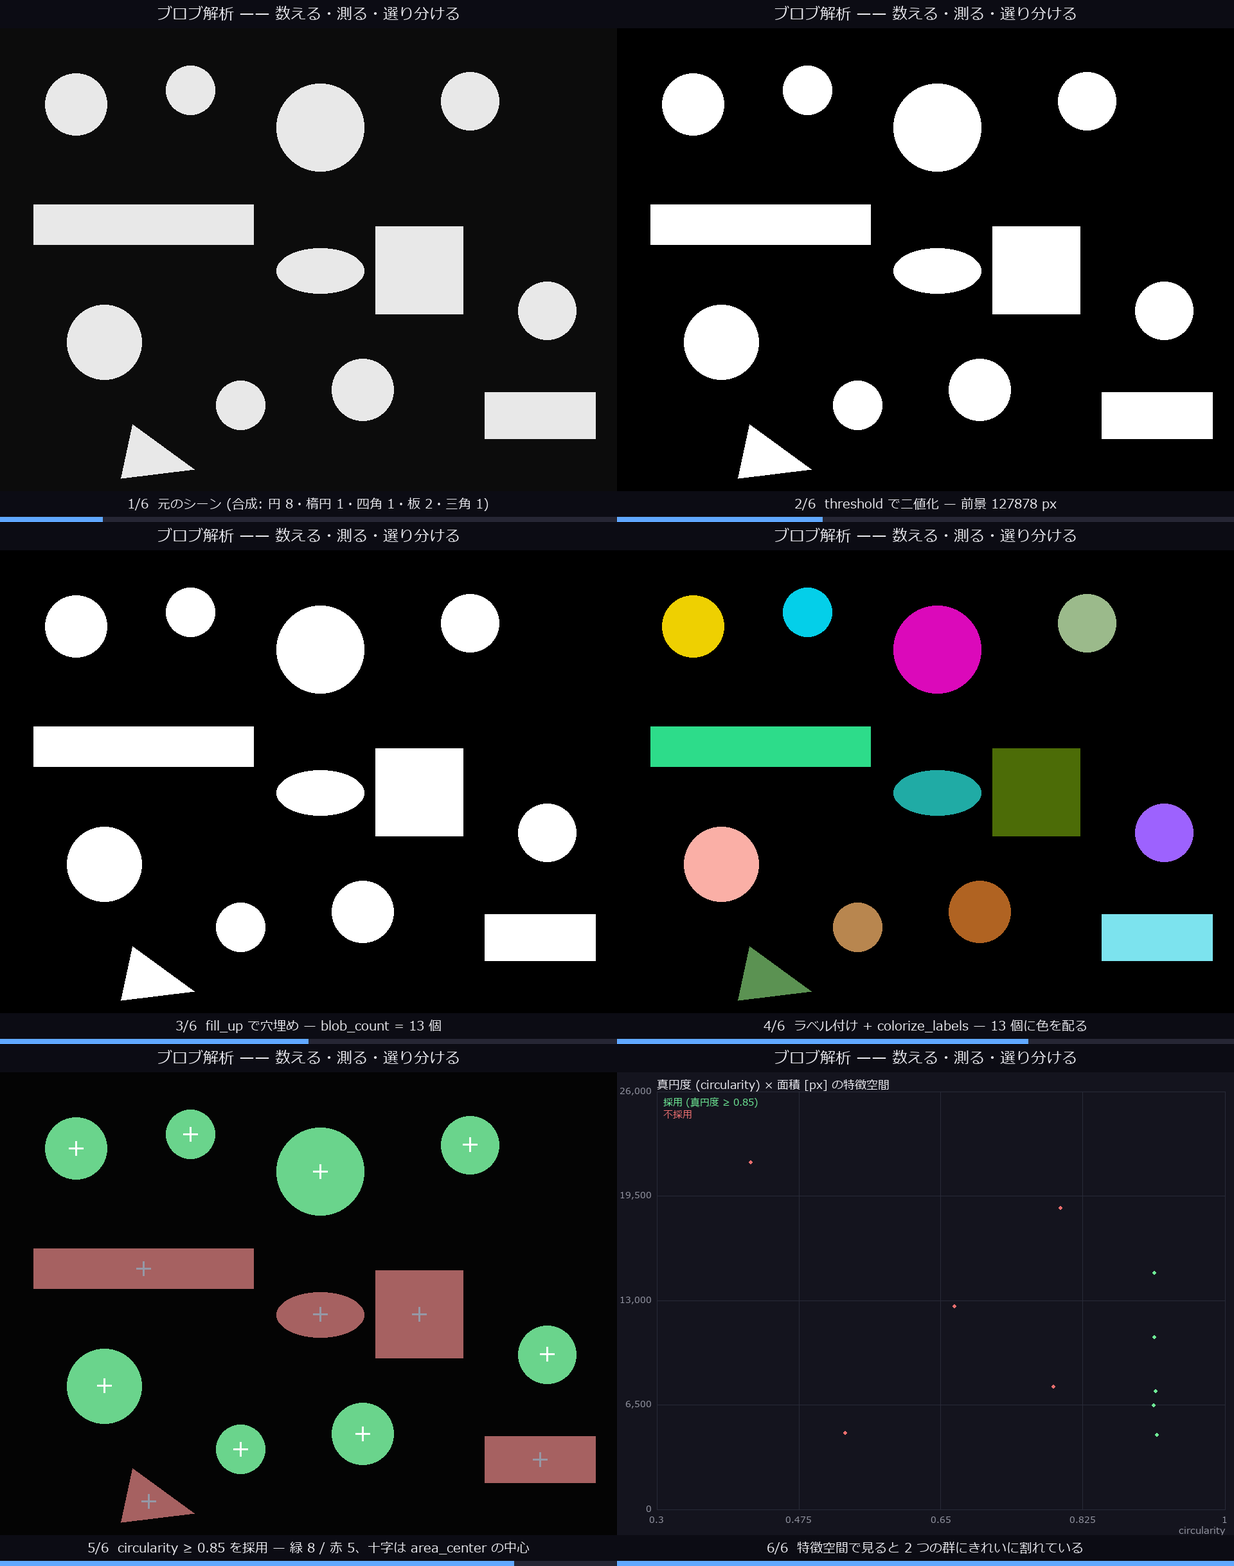
↑ Blob analysis — sorting grains by circularity — a synthetic scene of 8 circles, 1 ellipse, 1 square, 2 plates and 1 triangle, thresholded, hole-filled and labelled; blob_count says 13. Cutting at a circularity of 0.85 splits it cleanly into 8 accepted (circularity 0.912–0.916) and 5 rejected (0.416–0.797) — and the scatter plot in feature space shows the two groups do not overlap across the threshold either. The crosses in the fifth frame are the centres returned by area_center, which gives 3 components (area fraction, row, column) normalised to [0,1]; converted back to pixels and compared with an independently computed centroid the difference is at most 0.000 px, and all 13 land on their own grain. Ops used: threshold, fill_up, blob_count, colorize_labels, circularity, eccentricity, rectangularity, area_center.
8. Sub-pixel metrology — measuring finer than the pixel
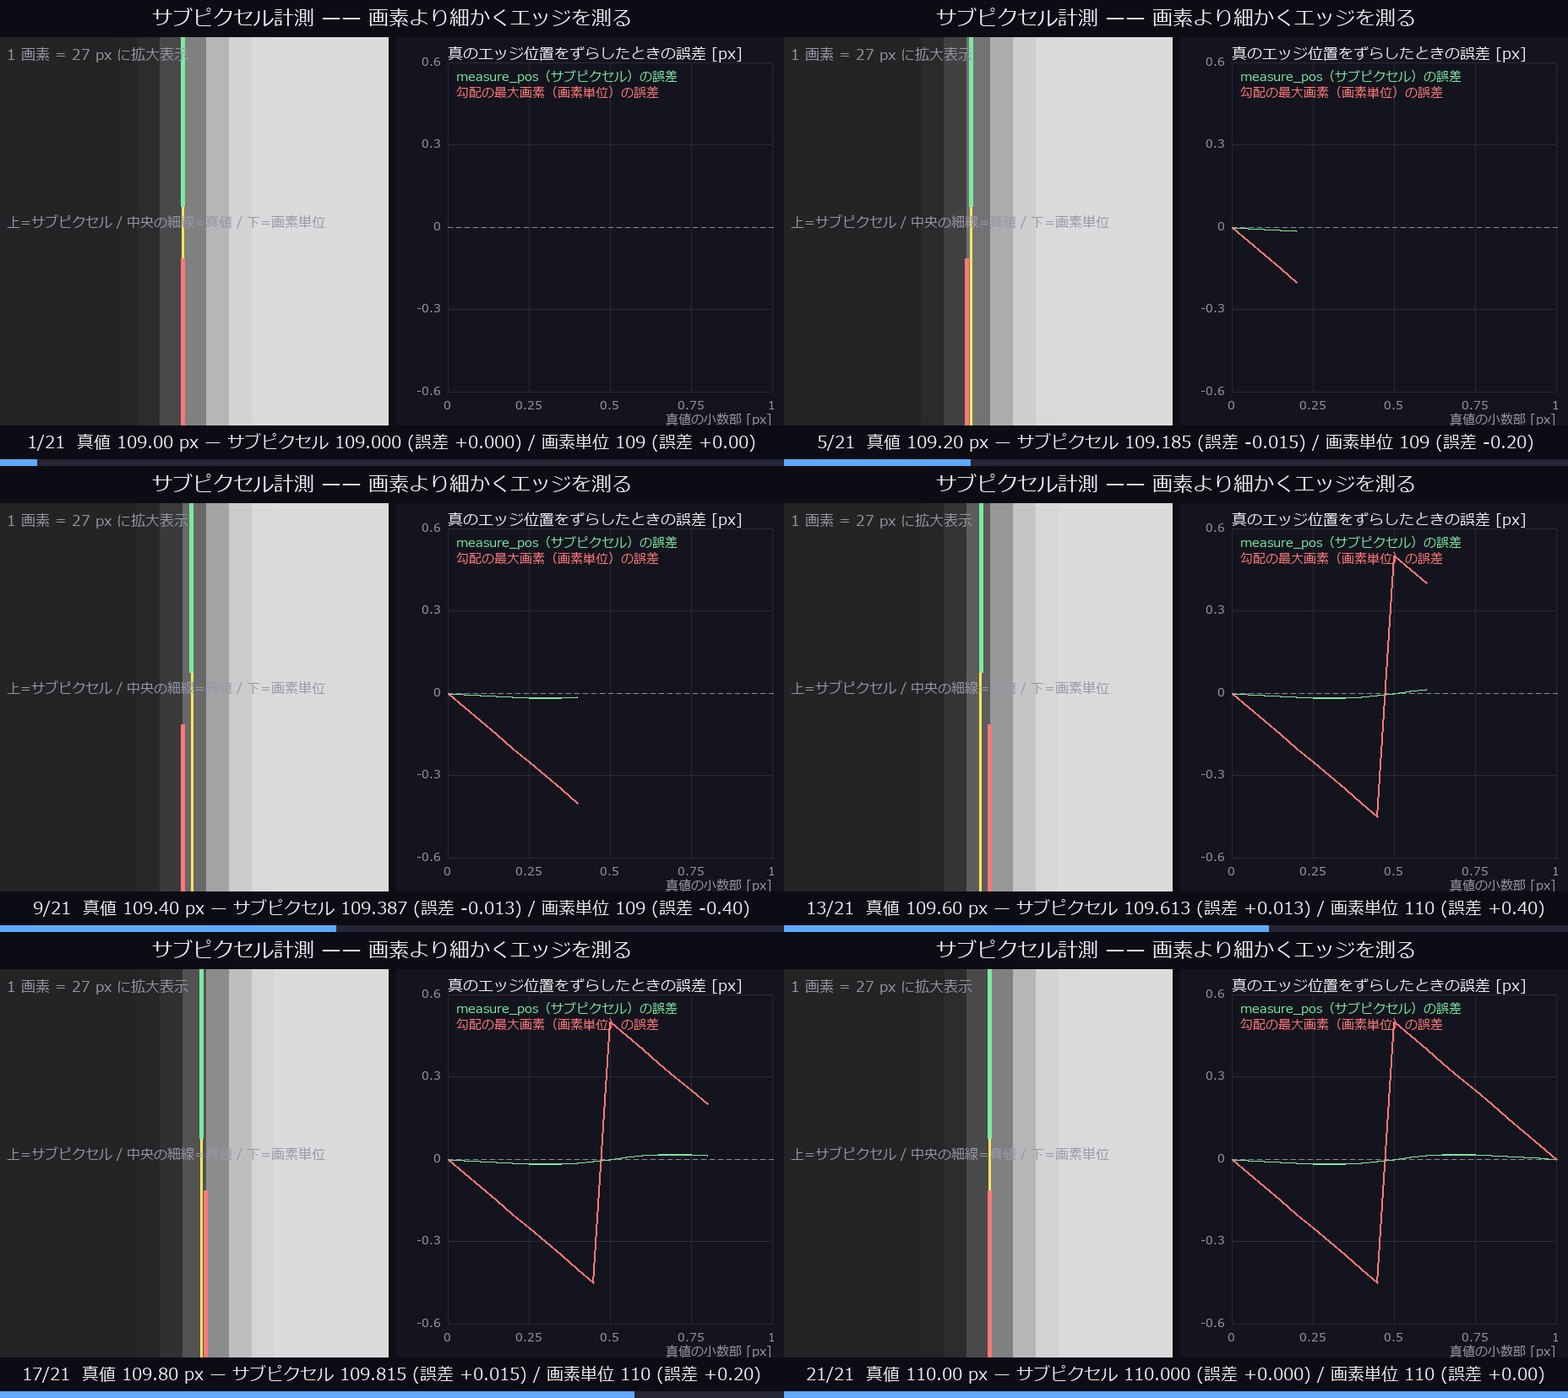
↑ Sub-pixel metrology — measuring finer than the pixel — the true position of a Gaussian-blurred edge is moved across one whole pixel in steps of 0.05 px, and measure_pos is compared with “the pixel of maximum gradient”. The sub-pixel estimate errs by RMS 0.0119 px and at most 0.0170 px; the per-pixel estimate by RMS 0.282 px and at most 0.50 px. Same image, same edge, a 24× difference — the pixel grid is not the limit of how finely you can measure. Ops used: gen_measure_rectangle2, measure_pos (m1_measure_pos).
9. Shape matching — finding it even when it is turned
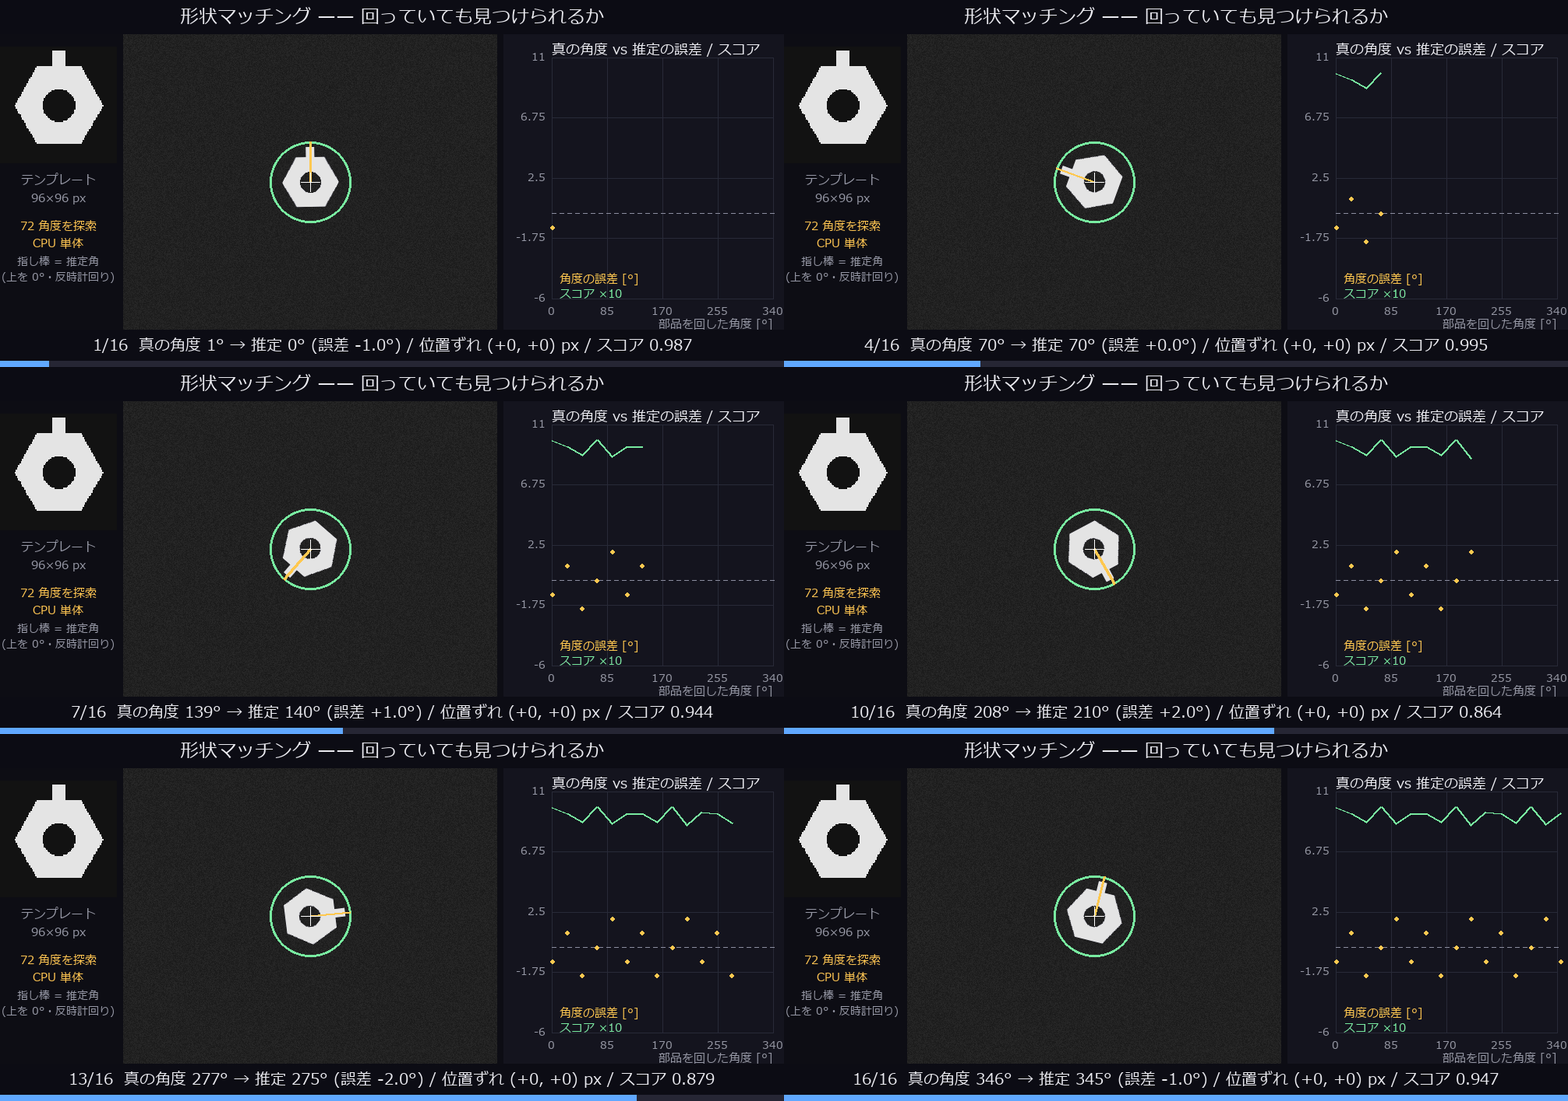
↑ Shape matching — finding it even when it is turned — a shape model built from a 96×96 px template, searching 16 scenes for a part rotated in steps of 23° (an angle deliberately off the 5° search grid). With the angle searched at a 5° pitch the angular error is at most 2.0° (the 2.5° half-grid is the floor to begin with), the positional error is at most 0 px, and the score never drops below 0.864. About 2.4 s per scene (CPU, including the search over 72 angles). Ops used: create_shape_model, find_shape_model (with an angle search).
10. Deskewing a form → binarising → counting the bars
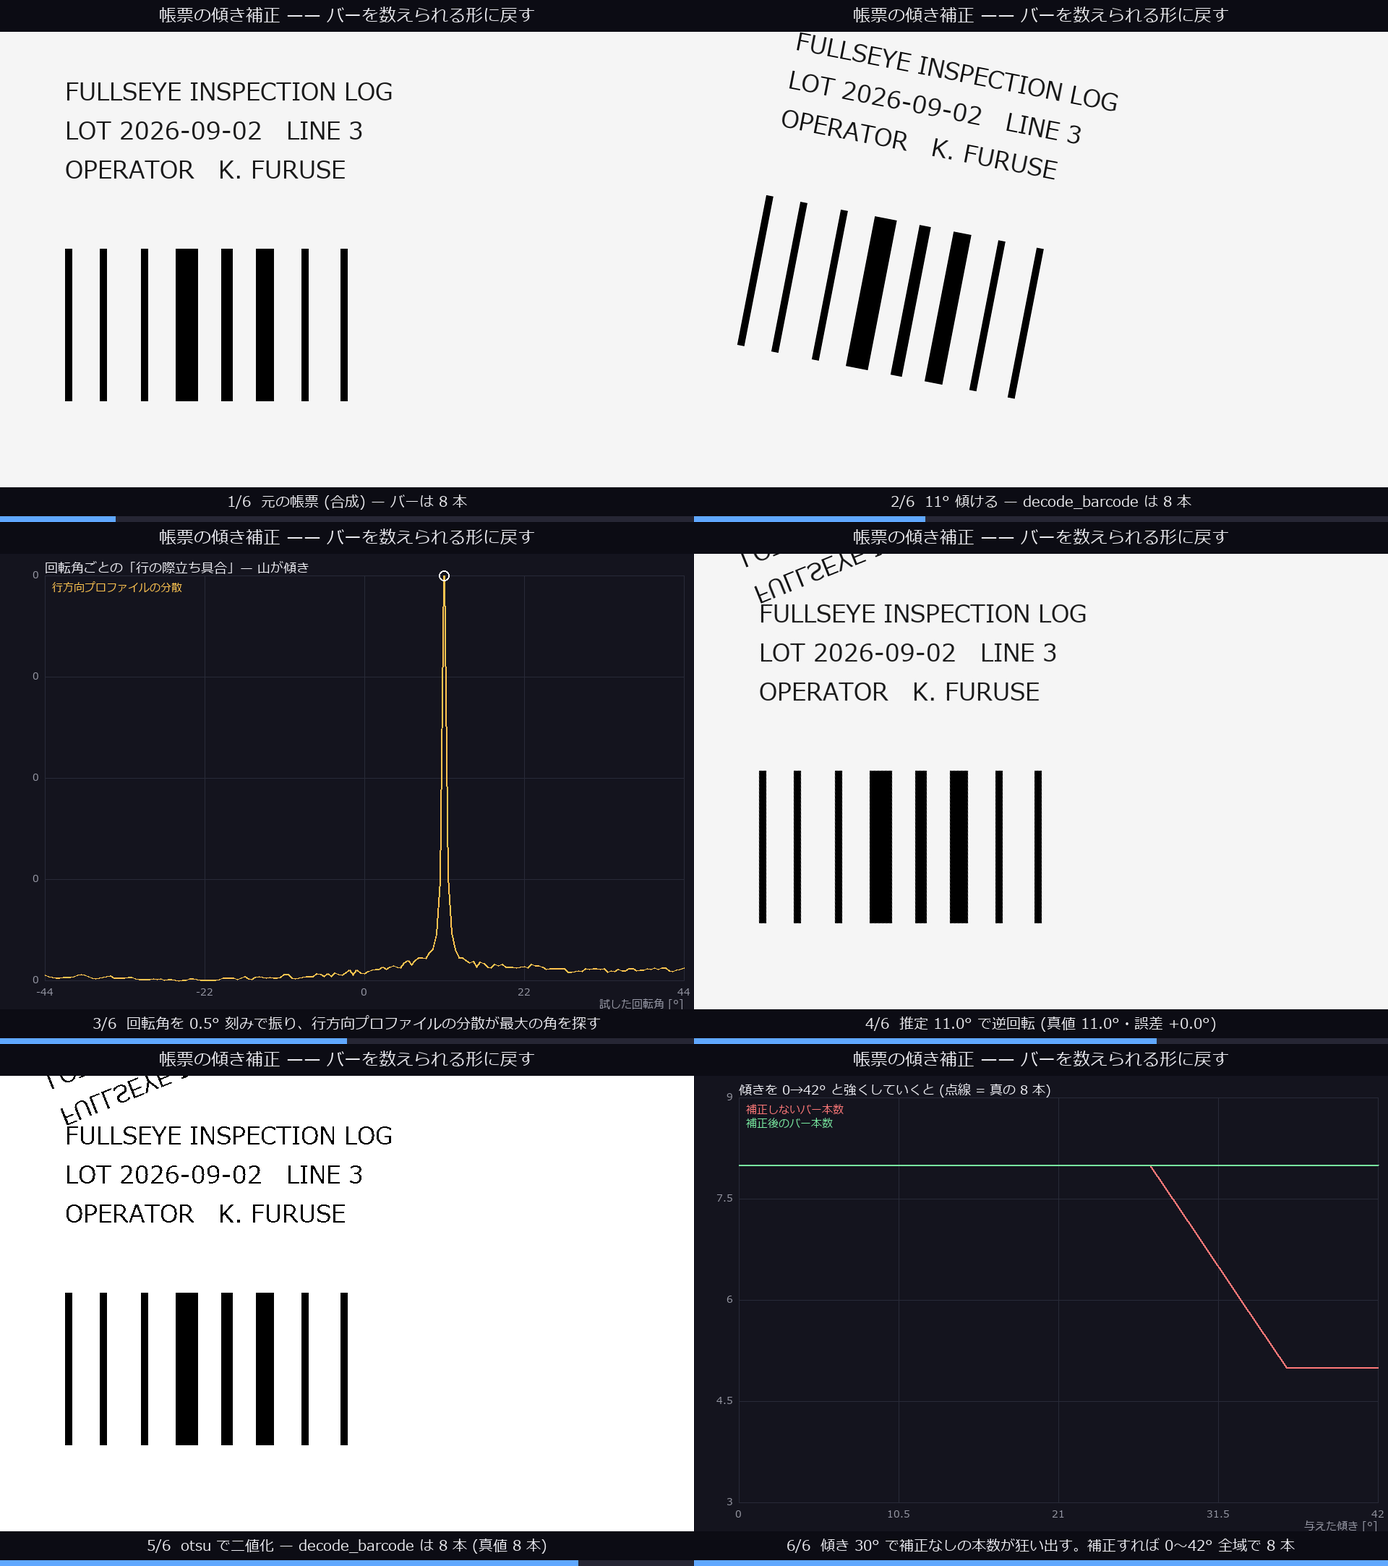
↑ Deskewing a form → binarising → counting the bars — a synthetic form is tilted 0→42° while the rotation angle is swept in 0.5° steps looking for “the angle that maximises the variance of the row profile”. The estimate errs by at most 0.0° over the whole range (at 11° it returns exactly 11.0°), and after correction decode_barcode returns the true 8 bars at every tilt. Without correction it drops to 7 bars at 30° and loses down to 5 by 42° — one pre-processing step changes the answer the same op gives. Note that rotate_image is reshape=False + mode=’reflect’, so turning the page folds the original text back into the corners as mirror writing (left in place here). Ops used: rotate_image, otsu, decode_barcode.
11. Fitting a contour, and the residual
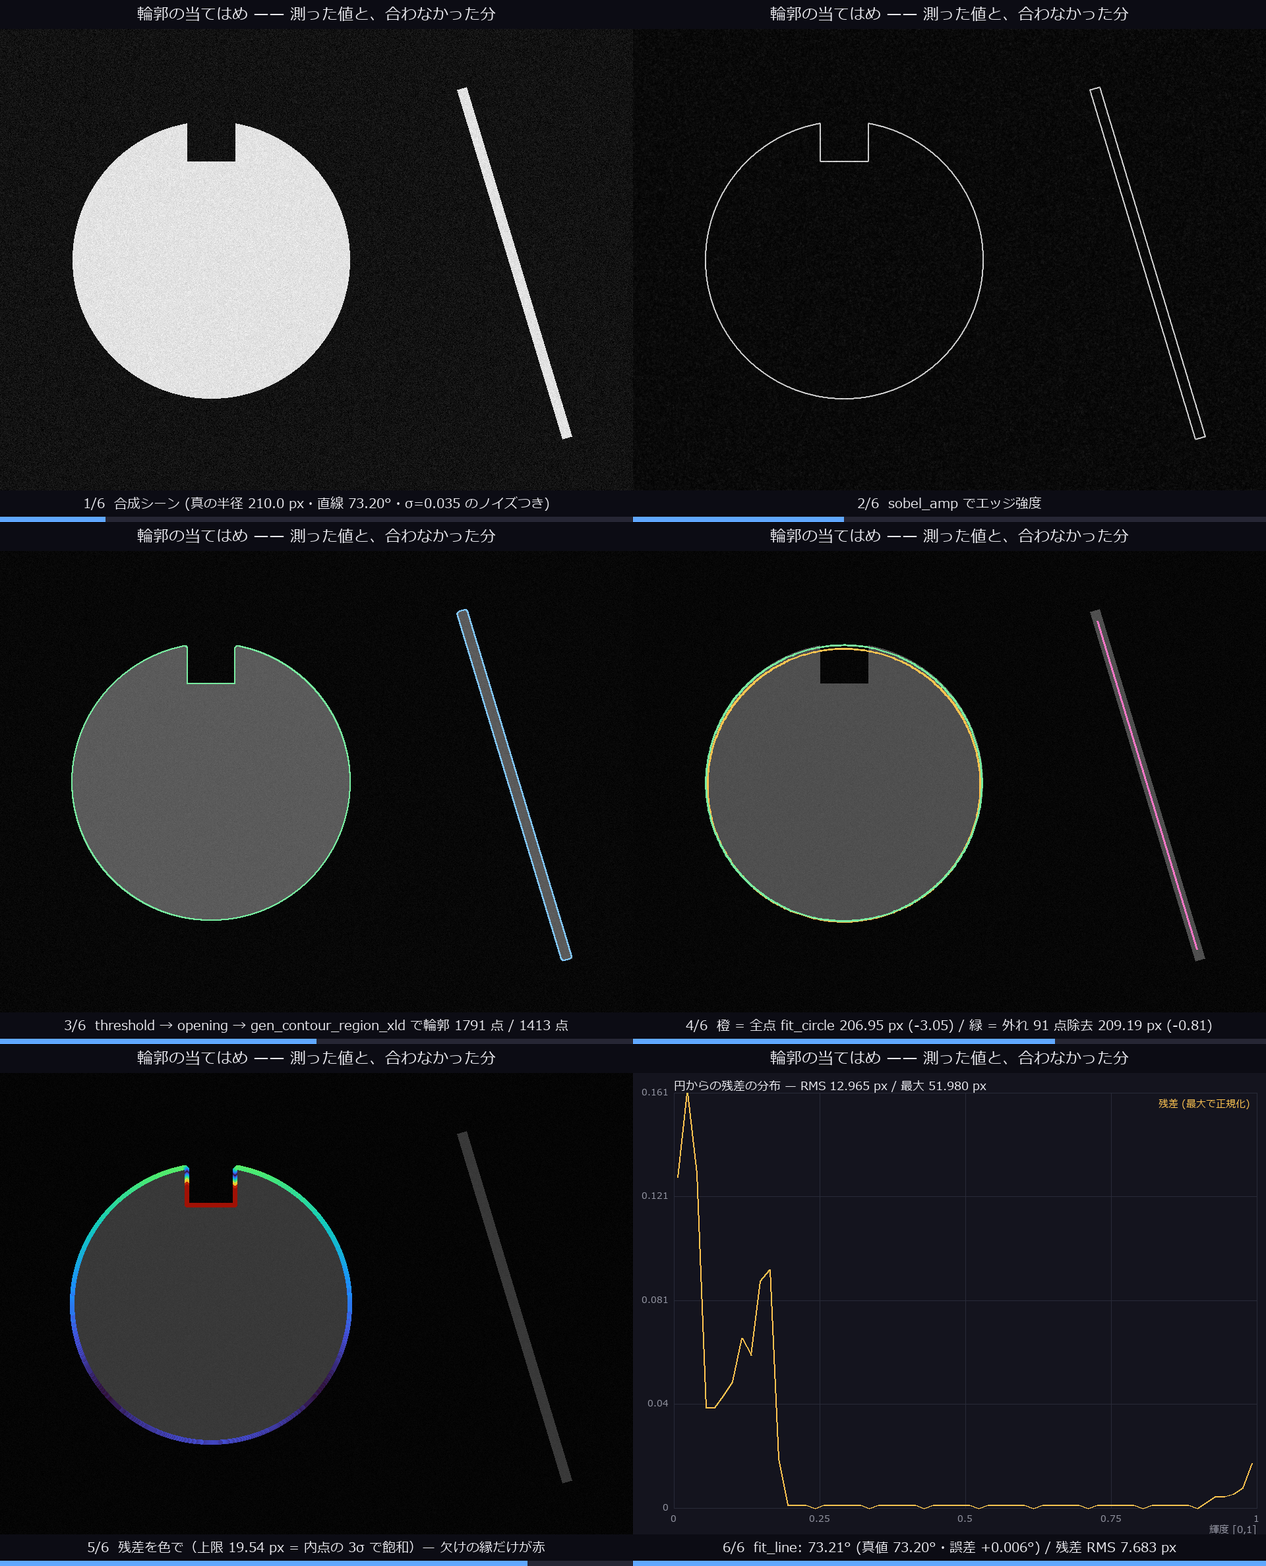
↑ Fitting a contour, and the residual — 6 frames fitting a circle and a line to the contours of a disc with a 72 px notch out of its rim. Fitted on every contour point the radius comes out at 206.95 px against a true 210.0 px (error -3.05 px, residual RMS 12.96 px) — the edge of the notch is pulling the fit — and dropping the 91 points beyond 3σ of the residual and refitting recovers 209.19 px (error -0.81 px, RMS 6.21 px). The line reads 73.21° against a true 73.20° (error +0.006°). There is more information in where the fit failed than in the value it returned. Ops used: threshold, opening_circle, gen_contour_region_xld, sobel_amp, fit_circle, fit_line.
12. A tour of colour spaces — which one lets you separate it
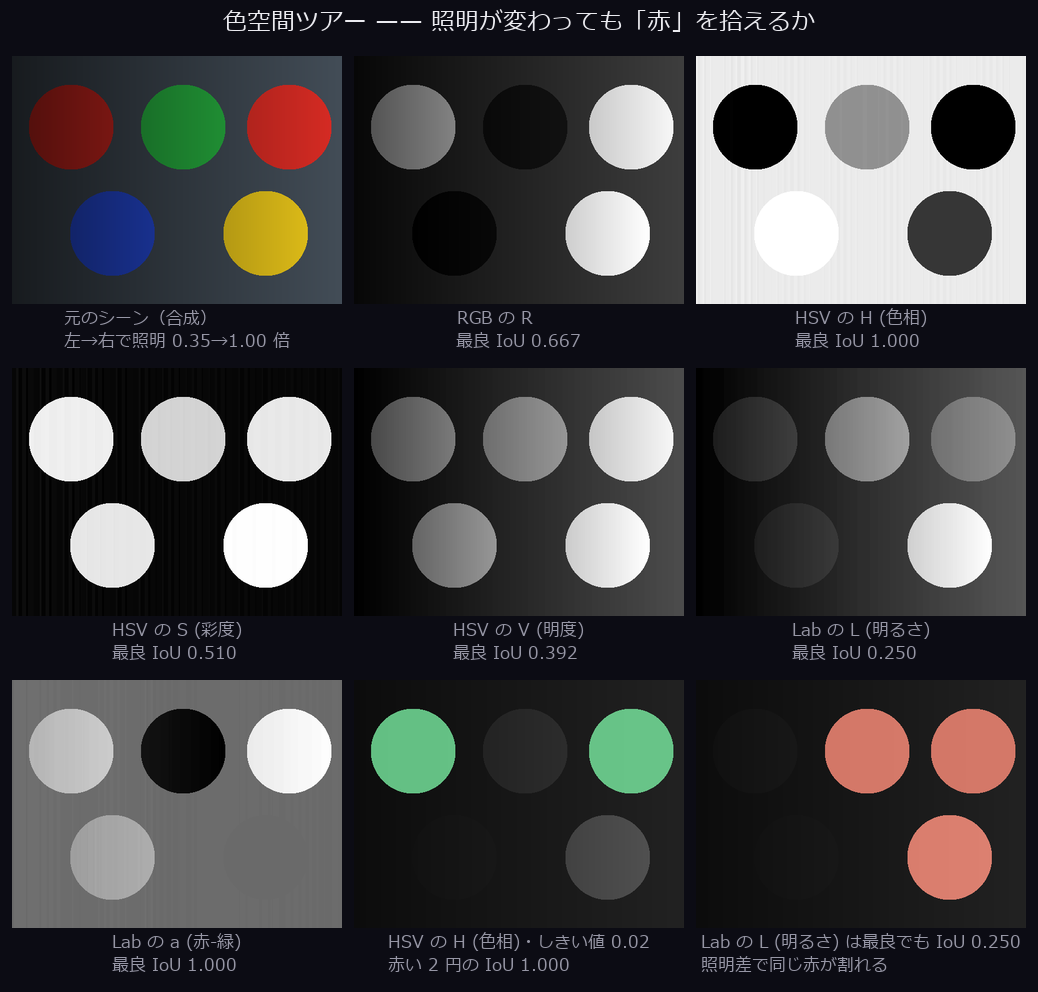
↑ A tour of colour spaces — which one lets you separate it — 9 panels showing, in 6 channels, a synthetic scene where 2 discs painted the same red are lit at 0.35× on the left and 1.0× on the right. Measuring by IoU whether a single threshold can take both red discs, HSV’s H (hue) and Lab’s a (red–green) reach 1.000, while Lab’s L (lightness) peaks at 0.250 — in any channel that carries brightness, one colour splits in two under uneven light. Note that HSV’s H comes from cv2 as 0..179 divided by 255, i.e. degrees ÷ 510 (pure green at 120° returns 0.2353 — a unit confirmed by measurement). Ops used: trans_from_rgb, access_channel, rgb1_to_gray.
13. Telling textures apart — separating patterns with features
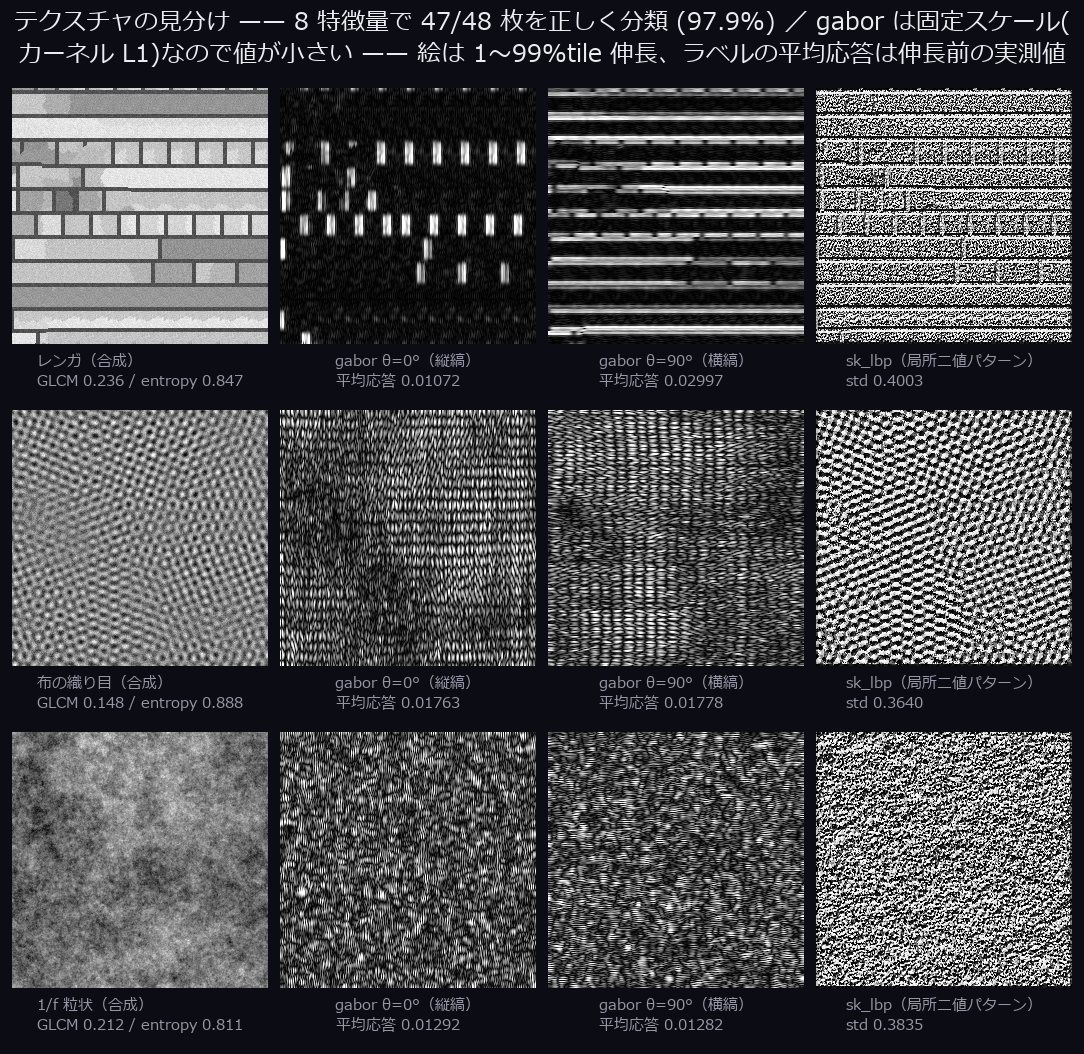
↑ Telling textures apart — separating patterns with features — 3 patterns cut into 48 tiles of 64×64 px, described by 8 features (GLCM energy, entropy, standard deviation, noise estimate and Gabor response in 4 orientations) and classified by leave-one-out nearest centroid: 47/48 = 97.9 % correct. They look alike, yet the GLCM energies are 0.236 / 0.148 / 0.212 apart — a “pattern” can be turned into numbers. The four Gabor orientations map directly onto whether a pattern has a direction: brick is dominated by its horizontal mortar lines, with mean responses of 0.01072 / 0.00680 / 0.02997 / 0.00676 at θ=0°/45°/90°/135° (max ÷ min 4.43), whereas the weave, which carries both directions at once, gives 0.01763 and 0.01778 — practically equal — and the directionless 1/f grain stays at the same ratio of 1.35. What separates the weave from the grain, then, is the absolute size of the response (0.01763 against 0.01292 at θ=0°), and that is a quantity which survives only because gabor returns a fixed scale divided by the kernel’s L1 norm — normalising by each image’s own maximum divides every orientation and every pattern by a different number and erases the difference. Ops used: cooc_feature_matrix, entropy_gray, gray_histo_abs, estimate_noise, gabor, sk_lbp.
14. What gets lost if you keep turning it (resampling loss)
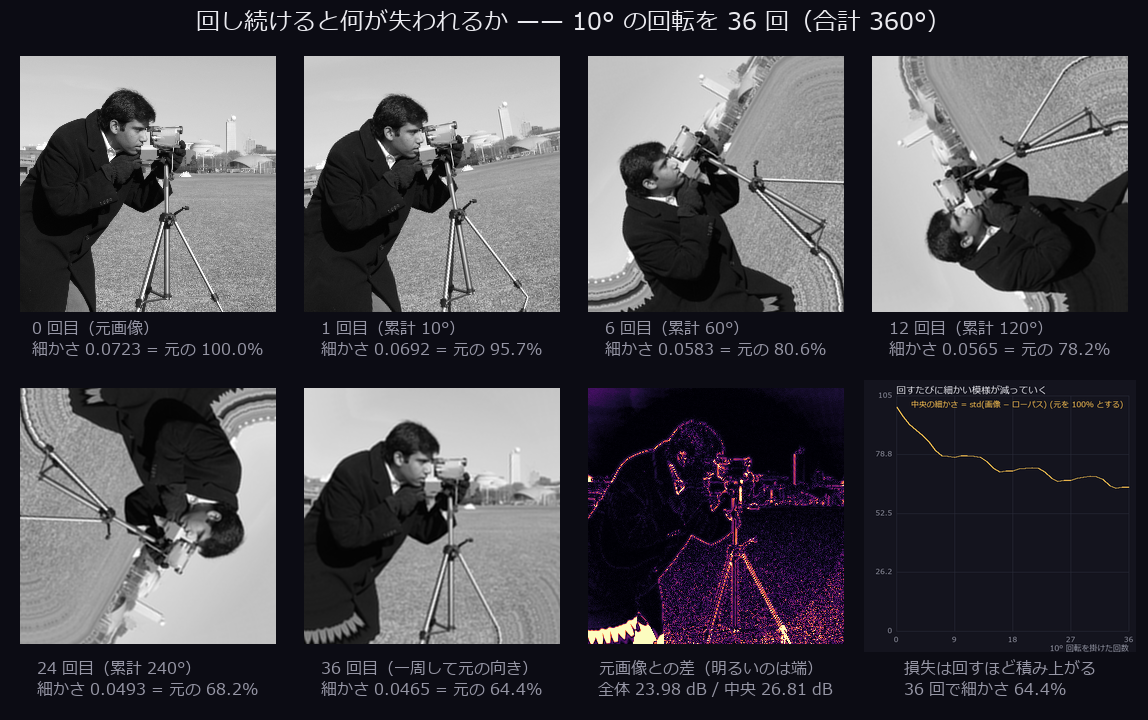
↑ What gets lost if you keep turning it (resampling loss) — rotate the same image by 10° 36 times and the geometry comes full circle, but the pixels do not come back. Measured on the centre alone the PSNR against the original is 26.81 dB and the central “fineness” (the standard deviation of image minus low-pass) has fallen to 64.4 % of the original (23.98 dB over the whole image; most of that gap is the border treatment — rotate_image is reshape=False + mode=’reflect’ — and not interpolation loss). Measured in passing: the 3 ops zoom_image_factor / zoom_image_size / rescale_img are each a separate implementation, with maximum differences on the same input (a=0.9, b=0.5) of 0.973 between factor and size and 0.966 between factor and rescale. Ops used: rotate_image, gauss_image, zoom_image_factor, zoom_image_size, rescale_img.