fullseye
The Signal, Acoustics and 1-D Wing — exhibit captions
Generated from tools/gen_wing1d_gallery.py (py -3.11 tools/gen_wing1d_gallery.py).
Every image is drawn with fullseye’s own imagedraw ops and numpy compositing — no matplotlib —
and every number burnt into a figure was measured on the spot by calling the op. Seeds are fixed
and so are the sweep grids, so a regeneration is byte-identical (checked with --verify).
Bundling follows the 3 forms in tools/exhibit_tile.py — a flipbook GIF (flipbook, for
sweeps and processes; each frame carries the step name and an i/N progress bar, so a frame that
is stopped on still means something), a tile (contact_sheet, for small plots that put
parameter variants on the same axes), and 1 full-size sheet (the claim itself, where the
figure is pointless unless the axes and the numbers can be read). Stills are all shown as
a thumbnail linking to the full-size image.
1. The defect frequency is not in the raw spectrum
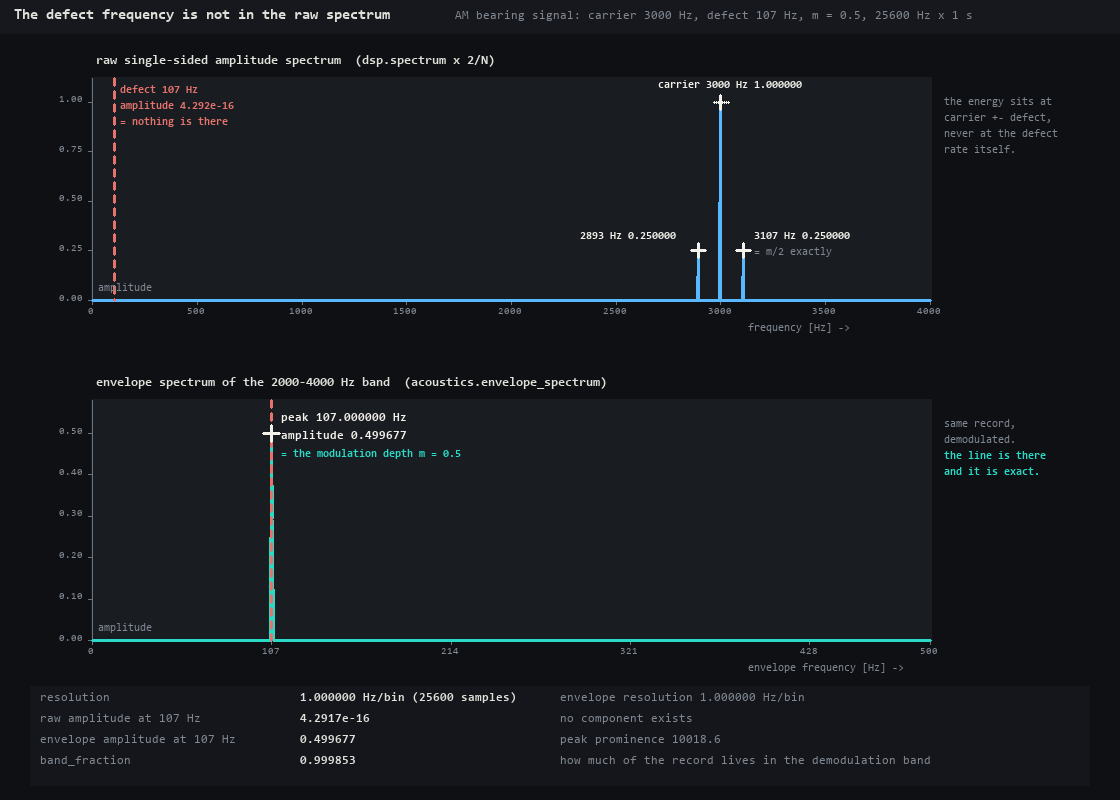
↑ The defect frequency is not in the raw spectrum — a bearing signal whose 3000 Hz resonance is amplitude-modulated at the 107 Hz defect rate (25600 Hz × 1 s, modulation depth 0.5). The raw spectrum on top holds only 4.292e-16 at 107 Hz; the energy sits in the carrier at 1.000000 and the sidebands at 0.250000 / 0.250000 (exactly m/2). The envelope spectrum below, from the same record, returns amplitude 0.499677 at 107.000000 Hz — the modulation depth itself (band_fraction 0.999853). Ops used: synthesize_bearing_signal, spectrum, envelope_spectrum.
- PNG (full size, 1 sheet):
docs/articles/assets/wing1d_defect_not_in_raw.png(1120x800 px, 57 kB) - Thumbnail (this is what the article shows):
docs/articles/assets/wing1d_defect_not_in_raw_thumb.jpg(41 kB) - Bundling: still
- SHA-256:
7767132cd2edab83b38d3bca9e247c2cacd471e3fac0ca424971b1f6a93b2990
The measured values burnt into this figure
```json { "rate_hz": 25600.0, "duration_s": 1.0, "carrier_hz": 3000.0, "defect_hz": 107.0, "modulation": 0.5, "resolution_hz": 1.0, "raw_amplitude_at_defect": 4.2916623928040632e-16, "raw_amplitude_at_carrier": 0.9999999999999983, "raw_sideband_lower": 0.2499999999999956, "raw_sideband_upper": 0.24999999999999925, "envelope_peak_freq": 107.0, "envelope_peak_amplitude": 0.4996770222507938, "envelope_band_fraction": 0.999853069632174, "envelope_prominence": 10018.617709142389 } ```2. Spectral kurtosis picks the demodulation band
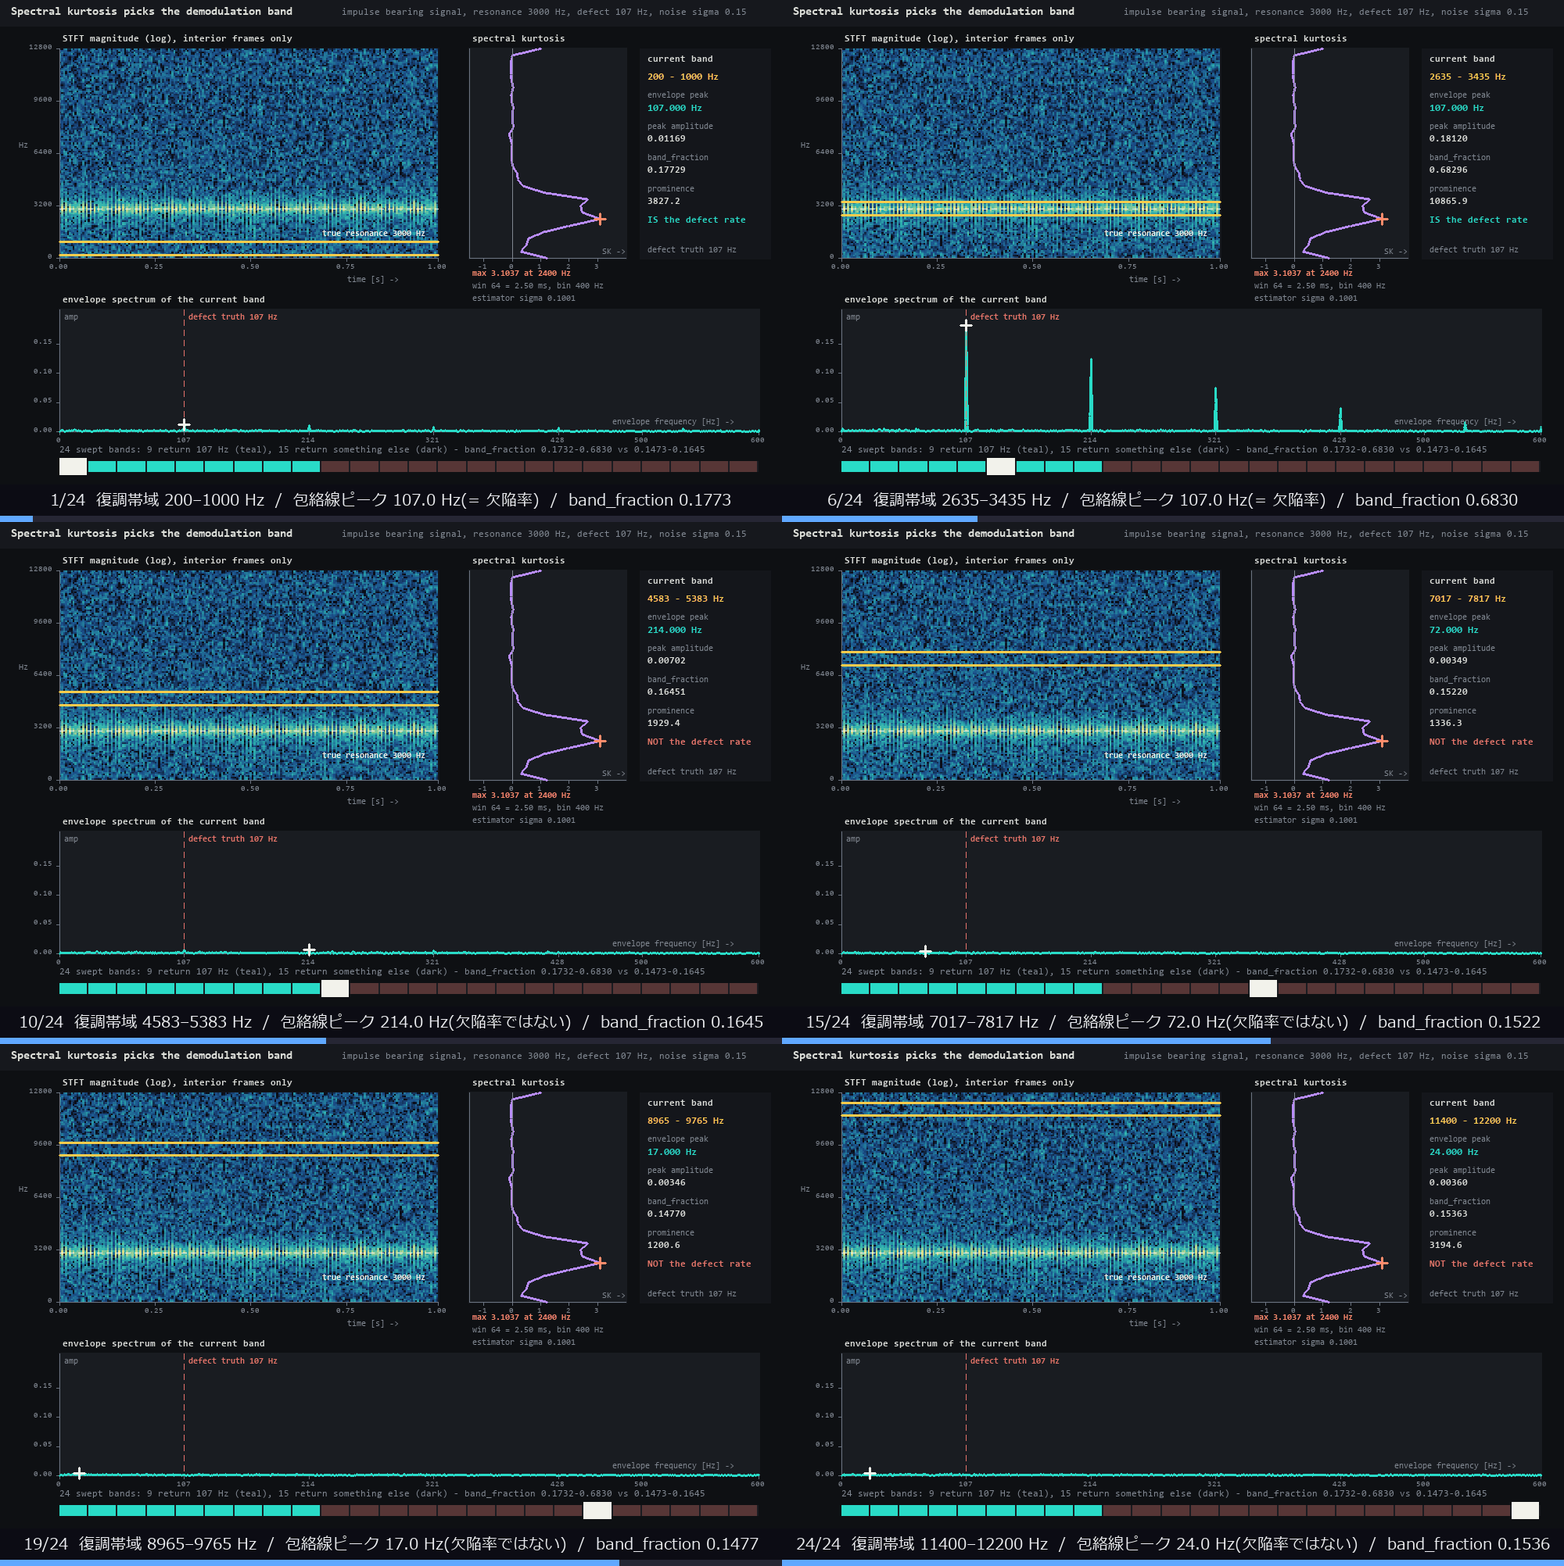
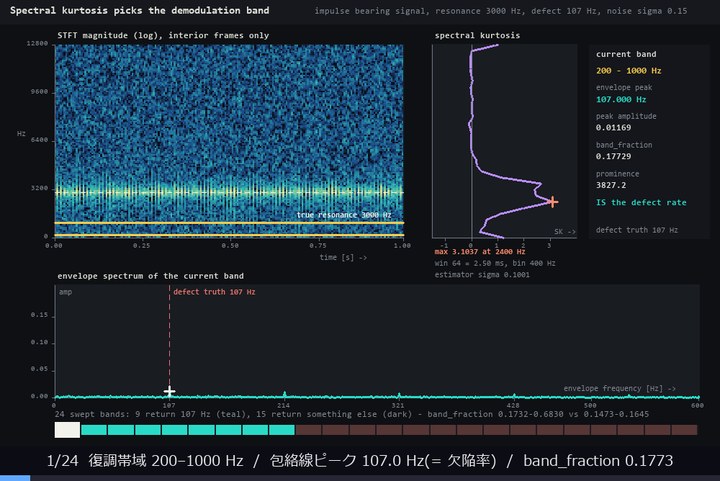
↑ Spectral kurtosis picks the demodulation band — when nobody knows where the resonance is, let the machine decide which band to demodulate. Spectral kurtosis is laid over the STFT plane (129 bins × 199 interior frames, out of 203 in total) and a 800 Hz wide demodulation band is swept across it. The SK maximum is 3.1037 @ 2400 Hz (window 64 = 2.50 ms, bin 400 Hz, estimator standard deviation 0.1001), and that band’s band_fraction is 0.4495. The number says the band choice is doing work: of the 24 bands swept, only 9 return the defect rate; the other 15 return some other plausible figure between 6 and 428 Hz (no exception, no NaN). The peak frequency alone cannot separate them — band_fraction is what does: the hits run 0.1732 to 0.6830, the misses 0.1473 to 0.1645. Ops used: synthesize_bearing_signal, stft, spectral_kurtosis, envelope_spectrum.
- GIF:
docs/articles/assets/media/wing1d_kurtosis_band.gif(24 frames, 1000x668 px, 2.00 MB, 220 ms/frame, last frame 1400 ms) - Thumbnail:
docs/articles/assets/thumbs/wing1d_kurtosis_band_thumb.jpg - Bundling: gif
- SHA-256:
c5d99ab9b37c33e0120328c4517e86d94cfe66402e7f17b069af75a4752b0e90
The measured values burnt into this figure
```json { "sk_max_kurtosis": 3.1037019867062785, "sk_max_freq": 2400.0, "sk_win": 64, "sk_window_ms": 2.5, "sk_bin_hz": 400.0, "sk_frames": 1597, "sk_noise_sigma": 0.10009388204226968, "stft_bins": 129, "stft_interior_frames": 199, "stft_total_frames": 203, "band_width_hz": 800.0, "best_band_centre": 3034.782608695652, "best_band_fraction": 0.6829578565909229, "bands_total": 24, "bands_returning_defect_rate": 9, "bands_returning_something_else": 15, "miss_peak_freq_range": [ 6.0, 428.0 ], "hit_band_fraction_range": [ 0.17317467053263255, 0.6829578565909229 ], "miss_band_fraction_range": [ 0.14732009808588267, 0.16450564153139283 ], "sk_band_fraction": 0.4494574621219424, "sk_band_peak_freq": 107.0, "worst_band_fraction": 0.14732009808588267 } ```3. Get the window length wrong and the kurtosis goes negative
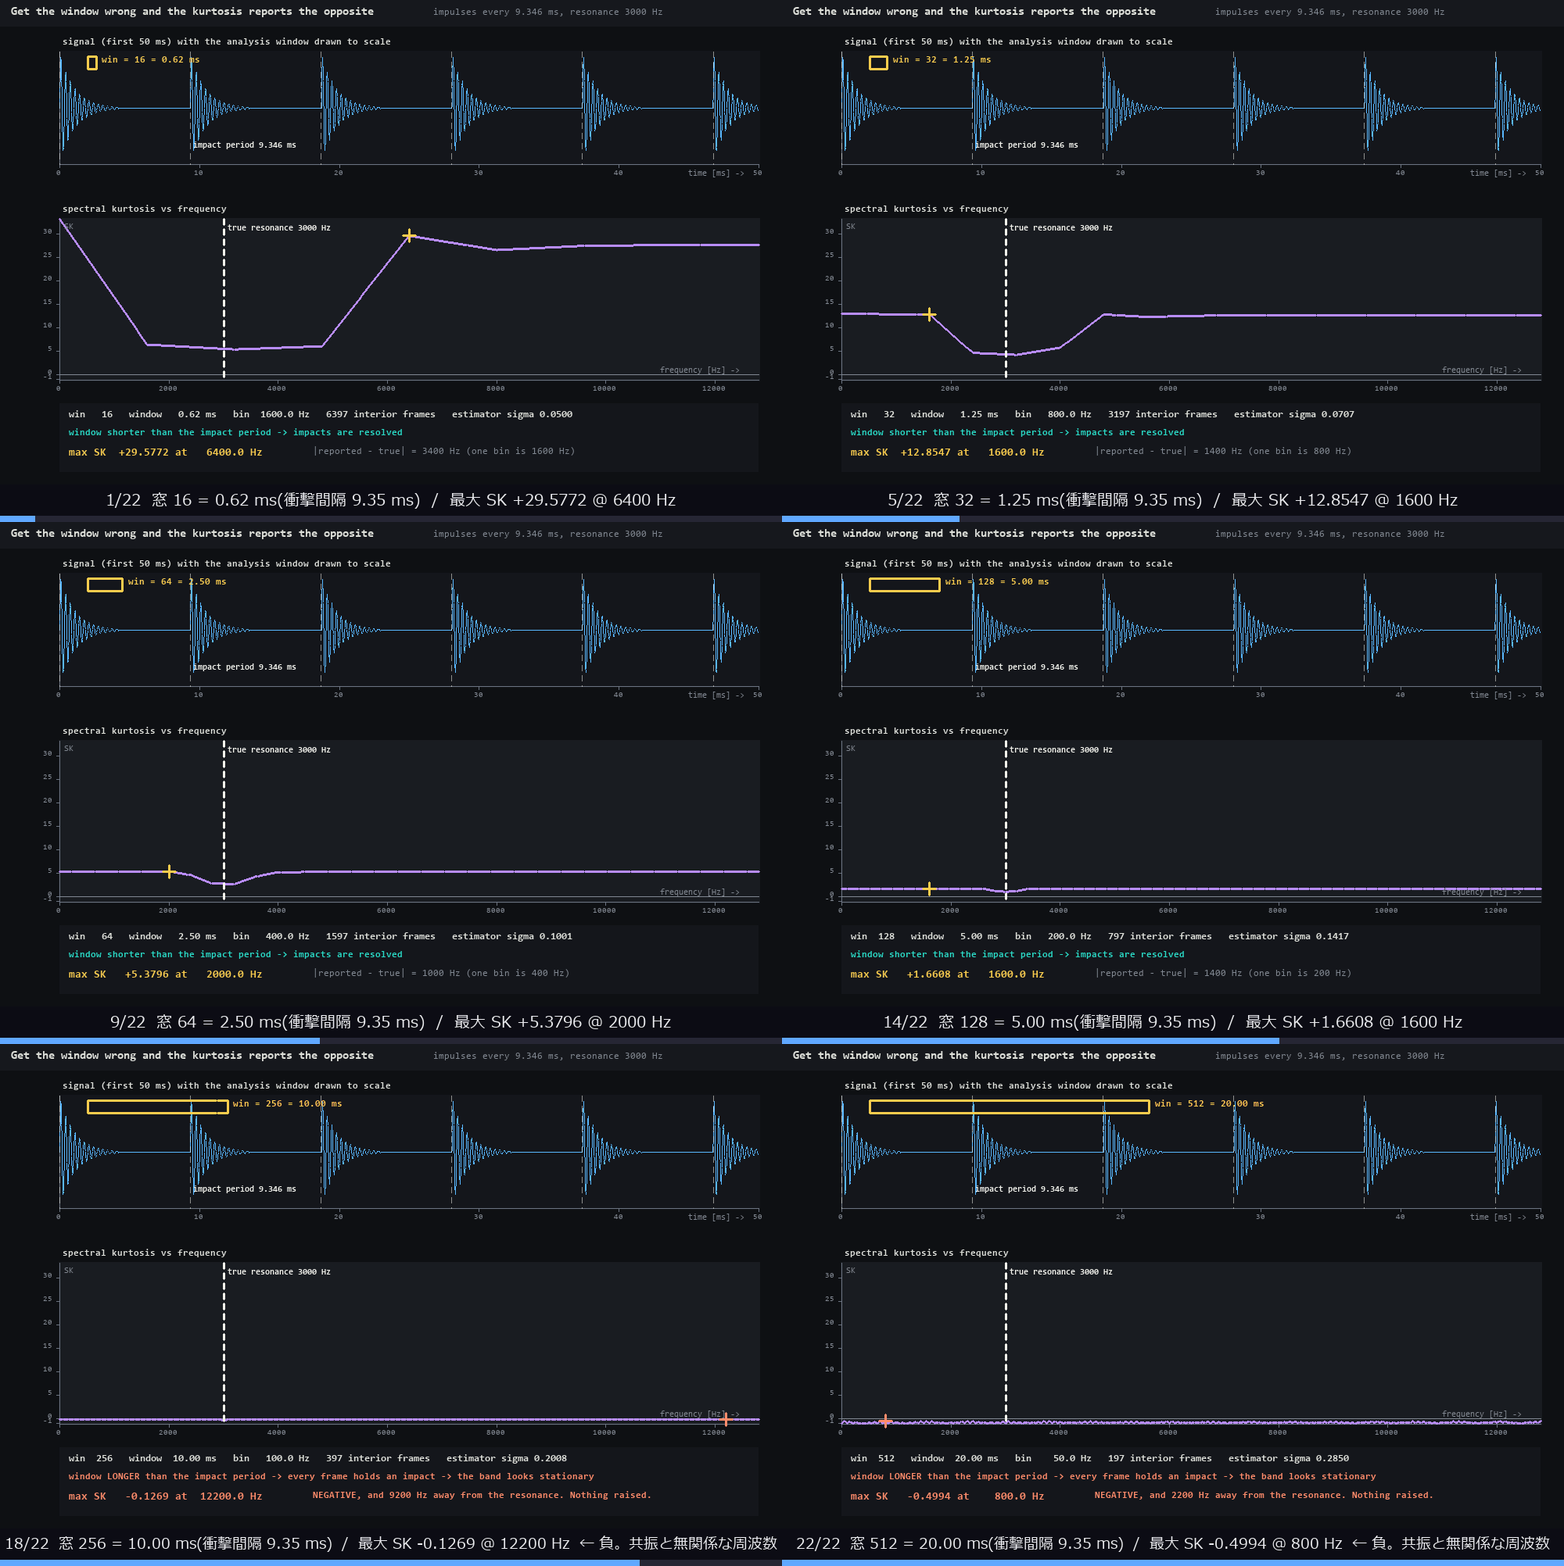
↑ Get the window length wrong and the kurtosis goes negative — the window is swept from 16 to 512 on a bearing signal whose impacts arrive every 9.346 ms (true resonance 3000 Hz). Once the window is longer than the interval between impacts, every frame contains exactly 1 impact, and the band looks “stationary” by construction. At window 256 (10.00 ms) the maximum SK is -0.1269 — a negative value, reported at 12200 Hz, 9200 Hz away from the resonance. No exception is raised. Sweeping the window is part of how this op is used, not an optimisation. Ops used: synthesize_bearing_signal, spectral_kurtosis.
- GIF:
docs/articles/assets/media/wing1d_window_sweep.gif(22 frames, 1000x668 px, 0.69 MB, 380 ms/frame, last frame 1800 ms) - Thumbnail:
docs/articles/assets/thumbs/wing1d_window_sweep_thumb.jpg - Bundling: gif
- SHA-256:
507eb1647e166c69a178c59880d785e0ef0baca7523f32ed8c8d7b5b1f0815c2
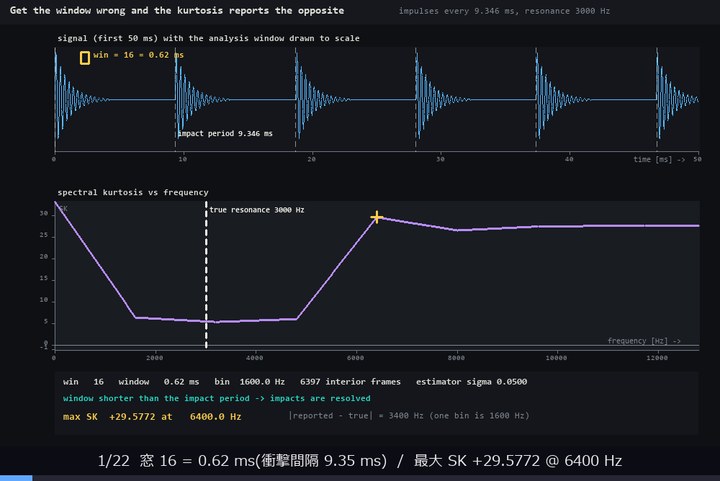
The measured values burnt into this figure
```json { "impact_period_ms": 9.345794392523365, "true_resonance_hz": 3000.0, "table": [ { "win": 16, "ms": 0.625, "max": 29.57722851209217, "at": 6400.0, "bin": 1600.0, "frames": 6397 }, { "win": 24, "ms": 0.9375, "max": 19.135220536597547, "at": 1066.6666666666667, "bin": 1066.6666666666667, "frames": 4263 }, { "win": 32, "ms": 1.25, "max": 12.854675024003651, "at": 1600.0, "bin": 800.0, "frames": 3197 }, { "win": 48, "ms": 1.875, "max": 7.878291532367296, "at": 533.3333333333334, "bin": 533.3333333333334, "frames": 2130 }, { "win": 64, "ms": 2.5, "max": 5.379627792794402, "at": 2000.0, "bin": 400.0, "frames": 1597 }, { "win": 96, "ms": 3.75, "max": 2.9401849728142526, "at": 2400.0, "bin": 266.6666666666667, "frames": 1063 }, { "win": 128, "ms": 5.0, "max": 1.660833522213224, "at": 1600.0, "bin": 200.0, "frames": 797 }, { "win": 192, "ms": 7.5, "max": 0.45085212215713133, "at": 8666.666666666668, "bin": 133.33333333333334, "frames": 530 }, { "win": 256, "ms": 10.0, "max": -0.12685129658601135, "at": 12200.0, "bin": 100.0, "frames": 397 }, { "win": 384, "ms": 15.0, "max": -0.5784282950393185, "at": 266.6666666666667, "bin": 66.66666666666667, "frames": 263 }, { "win": 512, "ms": 20.0, "max": -0.4994481614669002, "at": 800.0, "bin": 50.0, "frames": 197 } ], "negative_windows": [ { "win": 256, "ms": 10.0, "max": -0.12685129658601135, "at": 12200.0 }, { "win": 384, "ms": 15.0, "max": -0.5784282950393185, "at": 266.6666666666667 }, { "win": 512, "ms": 20.0, "max": -0.4994481614669002, "at": 800.0 } ] } ```4. Order tracking — the two swap places in the angle domain
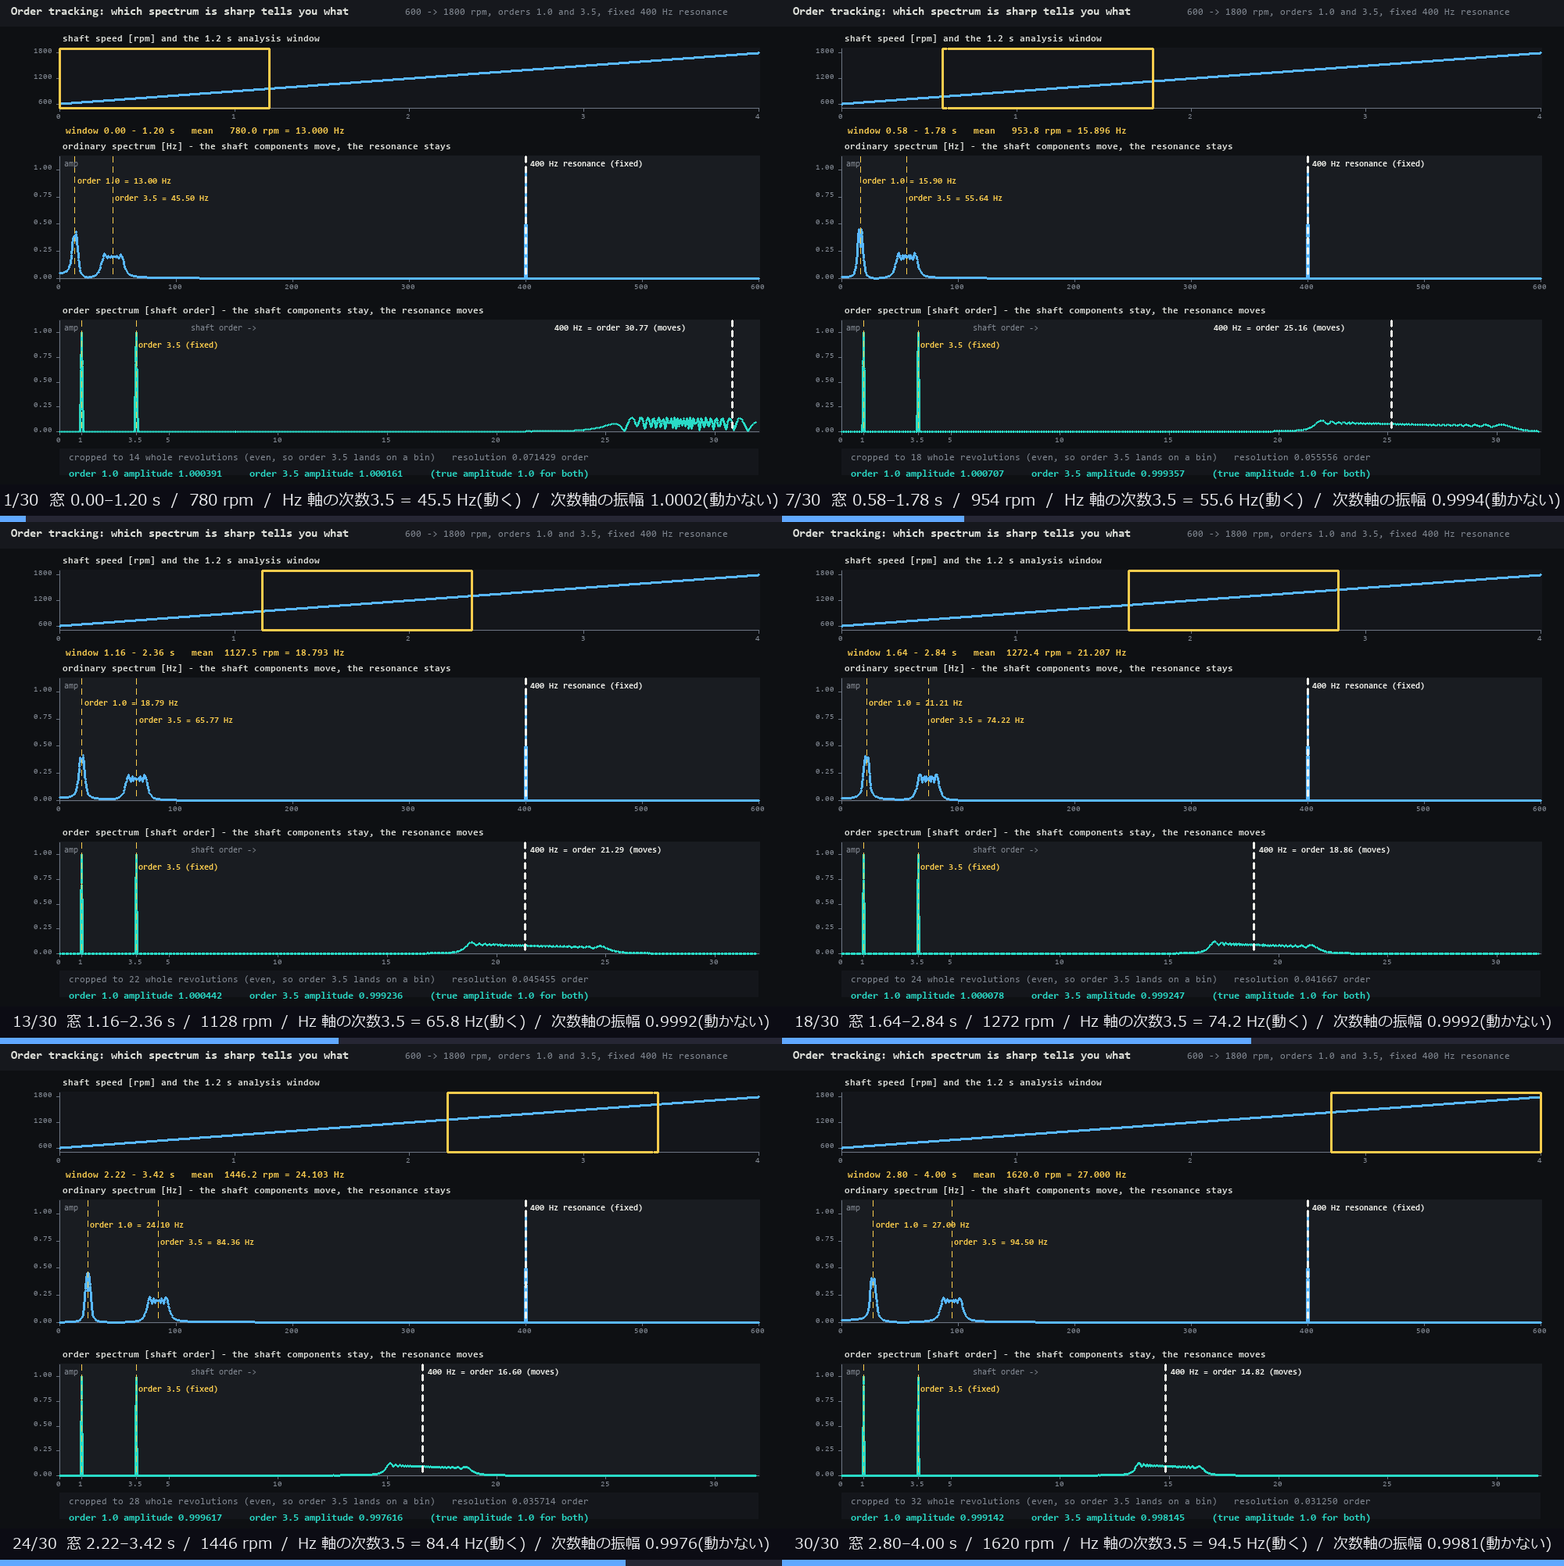
↑ Order tracking — the two swap places in the angle domain — a run-up record from 600 to 1800 rpm (4 s, 5000 Hz, orders 1.0 and 3.5, a fixed 400 Hz resonance, 79.9940 revolutions in total) slid through a 1.2 s window. In the plain spectrum order 3.5 is smeared down to 0.070203 (7 % of its true 1.0) and its −3 dB width spreads to 66.50 Hz. Resample into the angle domain and the same component comes back at 0.999371 with a width of 0 bins (0.00000 orders). The 400 Hz fixed resonance goes the other way: on the order axis it scatters to order 20.00 at the mean speed (amplitude 0.025386). That reversal *is the diagnosis. Ops used: synthesize_speed_ramp, spectrum, angular_resample, order_spectrum.*
- GIF:
docs/articles/assets/media/wing1d_order_tracking.gif(30 frames, 1000x668 px, 1.08 MB, 220 ms/frame, last frame 1400 ms) - Thumbnail:
docs/articles/assets/thumbs/wing1d_order_tracking_thumb.jpg - Bundling: gif
- SHA-256:
db0ab726f8e966c9517713b93d9f90a4d4bc6031dede54761c5e31fa685b1780
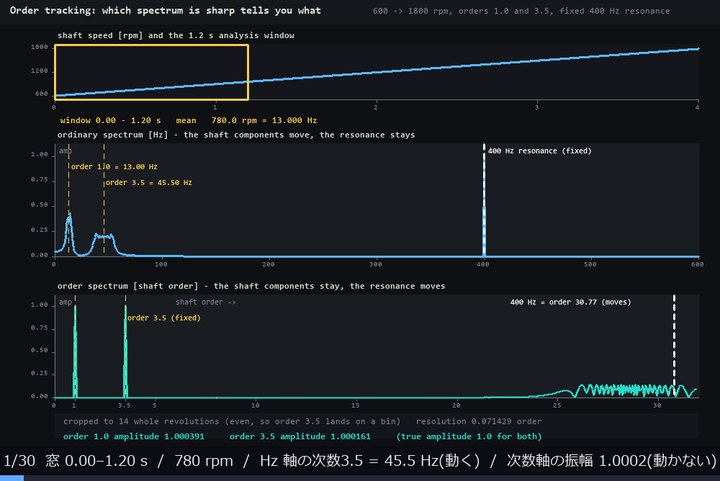
The measured values burnt into this figure
```json { "rpm_start": 600.0, "rpm_end": 1800.0, "duration_s": 4.0, "rate_hz": 5000.0, "total_revolutions": 79.9940001, "ordinary_order35_amp": 0.07020339787092662, "ordinary_order35_hz": 101.5, "ordinary_order35_width_hz": 66.5, "order_spectrum_order35_amp": 0.9993710550504145, "order_spectrum_order35_width": 0.0, "order_spectrum_order35_bins": 1, "resonance_order_at_mean_rpm": 20.00050001250031, "resonance_amp_in_order_domain": 0.025386071643316462, "window_s": 1.2, "frames": 30, "shaft_hz_first": 12.999500000000001, "shaft_hz_last": 26.9995 } ```5. Defect frequencies from the bearing geometry
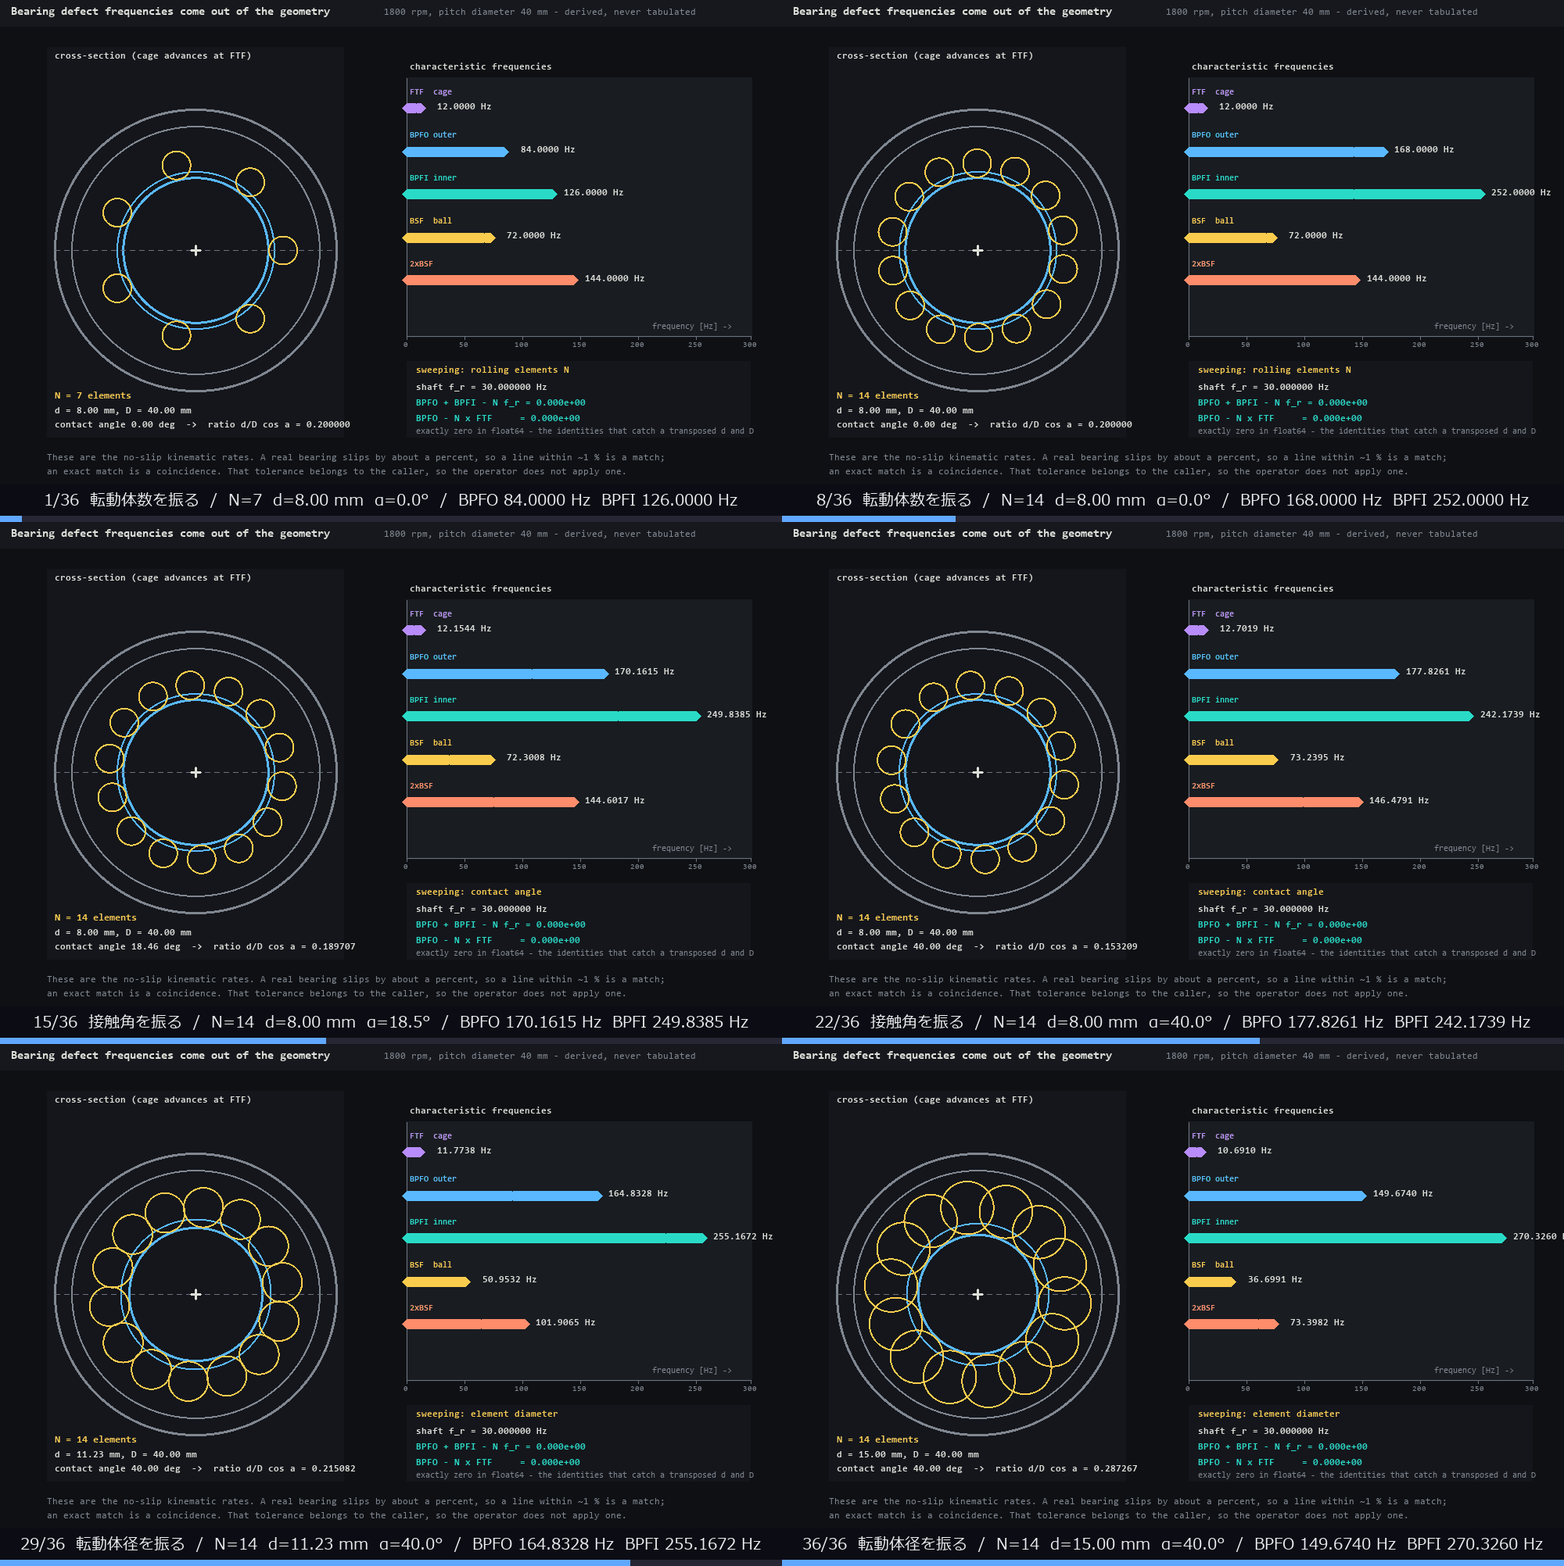
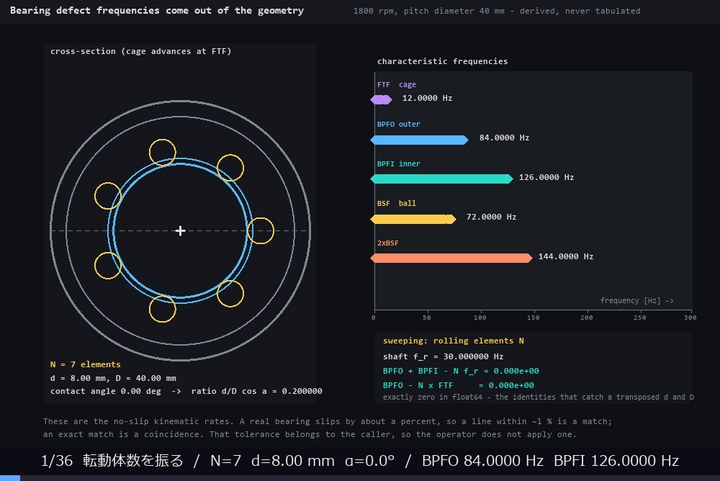
↑ Defect frequencies from the bearing geometry — for a bearing at 1800 rpm with a 40 mm pitch diameter, the rolling-element count, then the contact angle, then the element diameter are swept in turn (36 frames). BPFO moves from 84.0000 to 177.8261 Hz and BPFI from 126.0000 to 270.3260 Hz. Across every frame the largest absolute value of BPFO + BPFI − N·f_r is 0.000e+00 and of BPFO − N·FTF is 0.000e+00 — exactly zero in float64, and these are identities that break the moment d and D are swapped. That sentence is only writable because the frequencies are re-derived from the geometry rather than read off a table. Ops used: bearing_defect_frequencies.
- GIF:
docs/articles/assets/media/wing1d_bearing_geometry.gif(36 frames, 1000x668 px, 1.40 MB, 200 ms/frame, last frame 1400 ms) - Thumbnail:
docs/articles/assets/thumbs/wing1d_bearing_geometry_thumb.jpg - Bundling: gif
- SHA-256:
d103e560a0874ab32633502199f072429b0e212941bcfd62da99b5403ed4e8c3
The measured values burnt into this figure
```json { "rpm": 1800.0, "pitch_diameter_mm": 40.0, "frames": 36, "first": { "n_elements": 7, "element_diameter": 8.0, "contact_angle_deg": 0.0, "ratio": 0.2, "shaft_hz": 30.0, "ftf_hz": 12.0, "bpfo_hz": 84.0, "bpfi_hz": 126.0, "bsf_hz": 72.0 }, "last": { "n_elements": 14, "element_diameter": 15.0, "contact_angle_deg": 40.0, "ratio": 0.28726666616961677, "shaft_hz": 30.0, "ftf_hz": 10.691000007455747, "bpfo_hz": 149.67400010438047, "bpfi_hz": 270.32599989561953, "bsf_hz": 36.69911450031176 }, "max_abs_identity_1": 0.0, "max_abs_identity_2": 0.0, "bpfo_range": [ 84.0, 177.8261333890029 ], "bpfi_range": [ 126.0, 270.32599989561953 ] } ```6. A- and C-weighting — 1 kHz is exactly 0 dB by construction
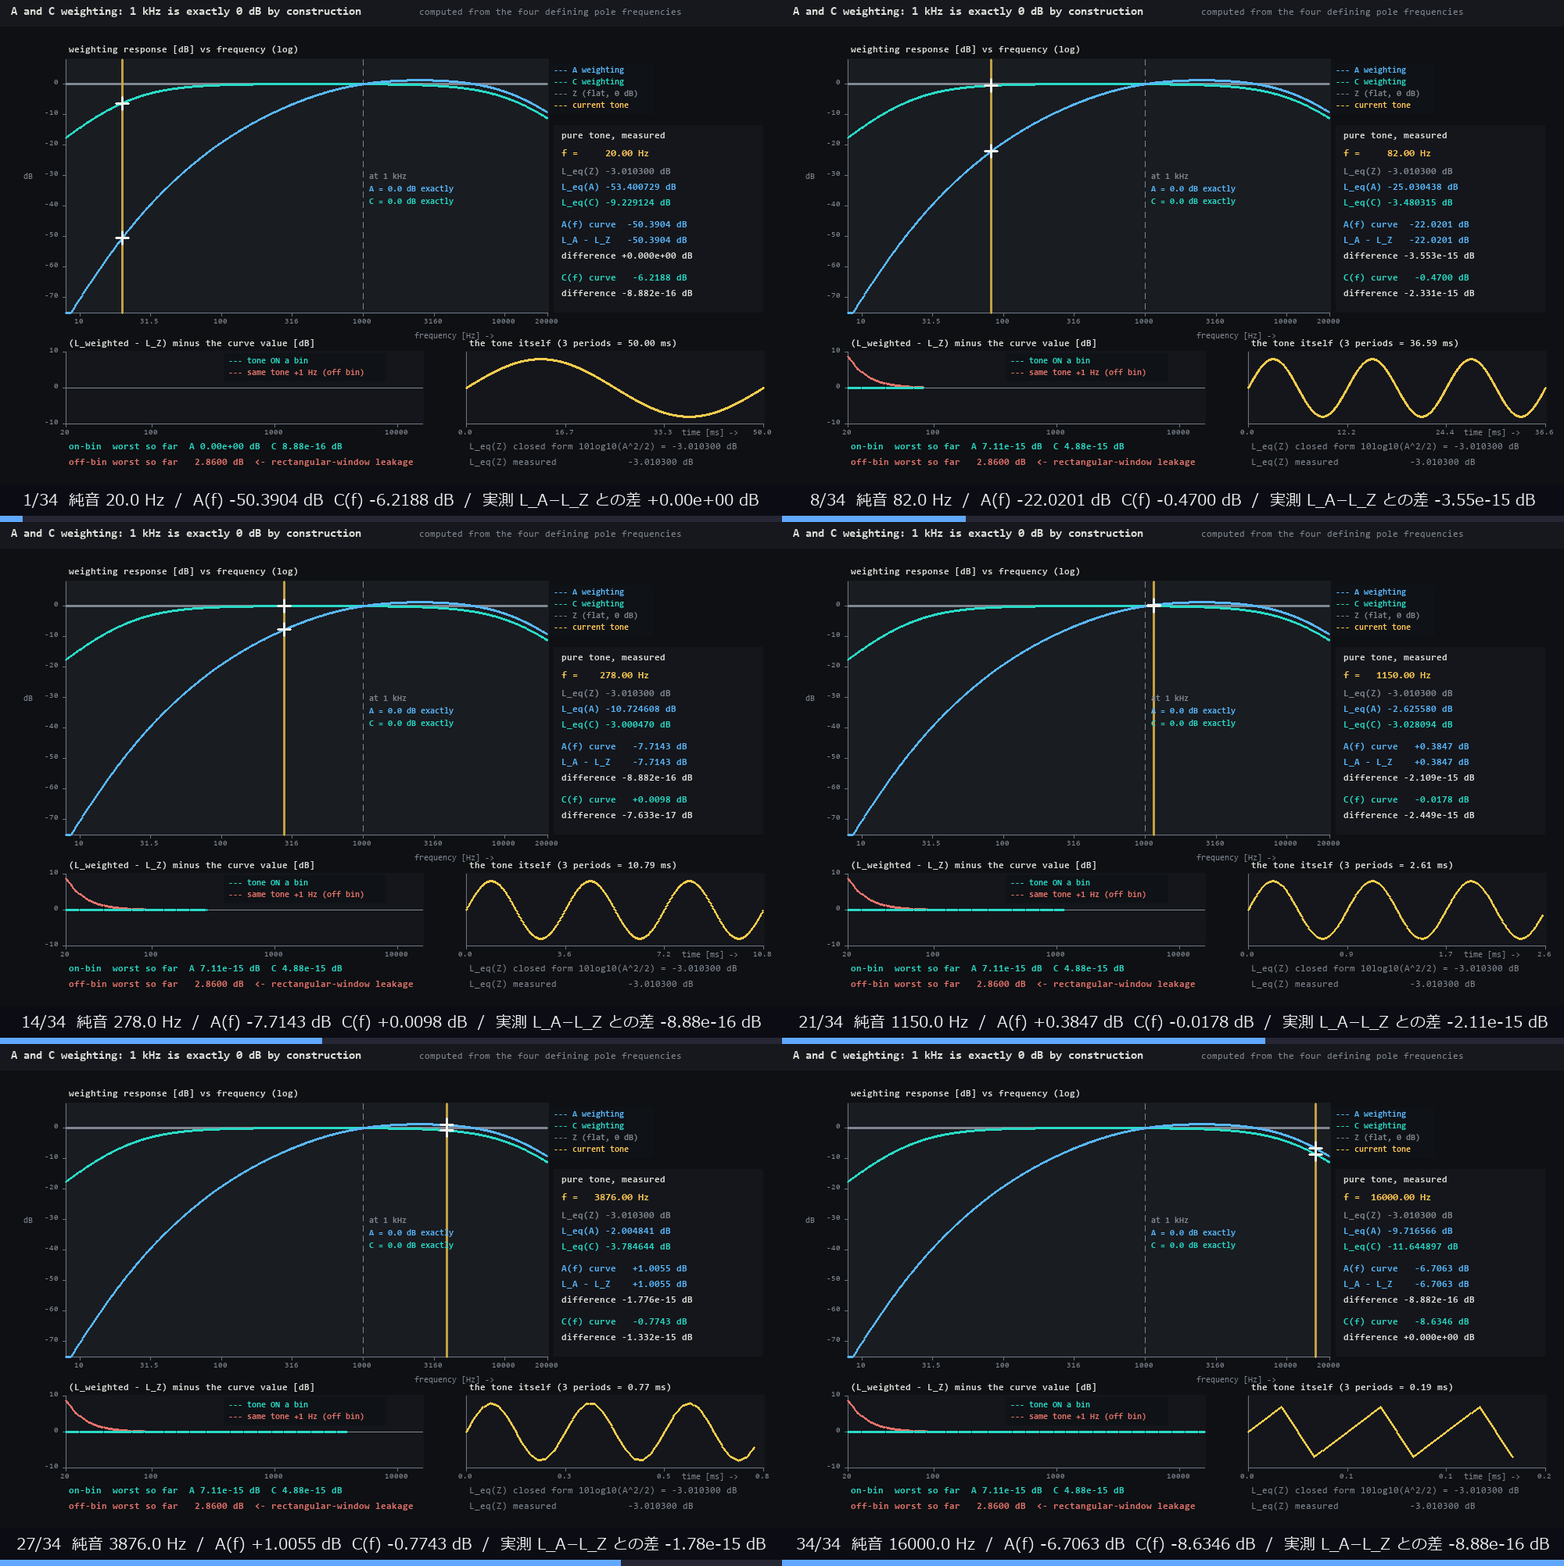
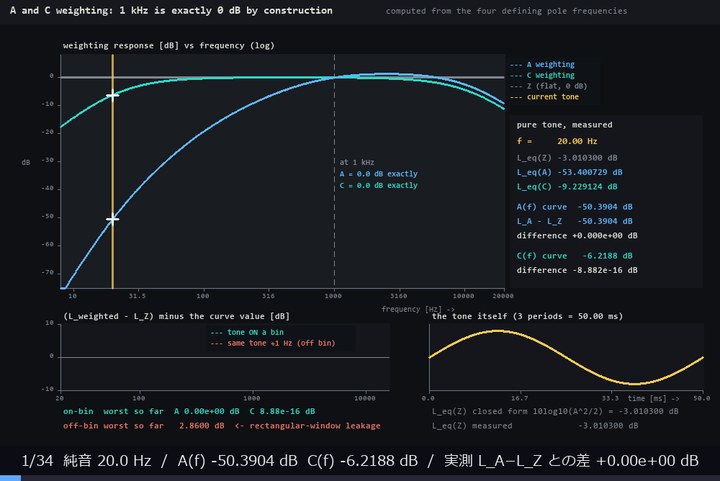
↑ A- and C-weighting — 1 kHz is exactly 0 dB by construction — the weighting curves are built by dividing by their own value at 1 kHz rather than by adding a published offset constant, so A(1000) and C(1000) are exactly 0.0 as Python floats, not as a rounding (measured: == 0.0 is True / True). Sweeping 34 pure tones and checking equivalent_level’s weighted difference L_A − L_Z against the curve value A(f), the largest discrepancy is 7.11e-15 dB (4.88e-15 dB for C-weighting). The L_eq(Z) of a sine of amplitude 1 is the closed form 10log10(A²/2) = -3.010300 dB, and the measurement agrees. But all of that holds only while the tone sits on a bin centre (an integer number of periods in the record): shift the same tone by 1 Hz and the same difference opens to 2.86 dB at 21.0 Hz (the red curve, lower panel). Because the leakage of the rectangular window is weighted at about 0 dB near 1 kHz, the low end — where A-weighting is steep — returns a value larger than the truth. No exception, no NaN. Ops used: weighting_response, apply_weighting, equivalent_level.
- GIF:
docs/articles/assets/media/wing1d_weighting_ac.gif(34 frames, 1000x668 px, 1.42 MB, 220 ms/frame, last frame 1400 ms) - Thumbnail:
docs/articles/assets/thumbs/wing1d_weighting_ac_thumb.jpg - Bundling: gif
- SHA-256:
4a0d21838a07ff9682b8a19d68bc658780b48ef1cc35a660f07b7d1a5ad96872
The measured values burnt into this figure
```json { "a_at_1k": 0.0, "c_at_1k": 0.0, "a_at_1k_is_exact_zero": true, "c_at_1k_is_exact_zero": true, "leq_z_closed_form_db": -3.010299956639812, "leq_z_measured_range": [ -3.010299956639841, -3.0102999566398 ], "max_abs_a_mismatch_db": 7.105427357601002e-15, "max_abs_c_mismatch_db": 4.884981308350689e-15, "bin_hz": 2.0, "off_bin_offset_hz": 1.0, "off_bin_max_abs_a_mismatch_db": 2.860008933302616, "off_bin_worst_freq_hz": 21.0, "n_tones": 34, "rate_hz": 48000.0, "duration_s": 0.5, "sample_points": { "20.0": { "A": -50.39042947681086, "C": -6.218824484255237 }, "68.0": { "A": -24.957730538737856, "C": -0.7009469720092589 }, "228.0": { "A": -9.544886650342692, "C": -0.011744795957637682 }, "766.0": { "A": -0.9765777140127547, "C": 0.02141634305233592 }, "2584.0": { "A": 1.2696291823486323, "C": -0.3201711900758198 }, "8714.0": { "A": -1.6153870384934494, "C": -3.521450393344838 } } } ```7. The analytic ground truth of funct1d
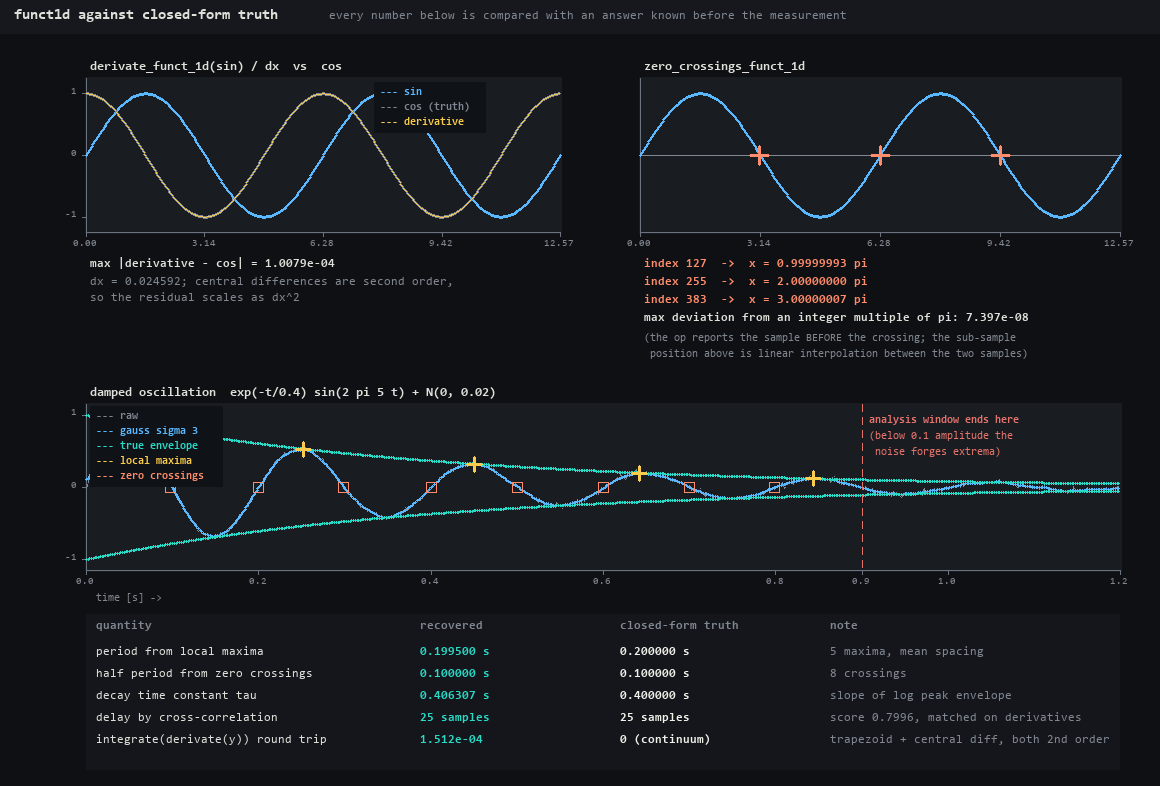
↑ The analytic ground truth of funct1d — 1 sheet built only from inputs whose answer is known in advance. The largest difference between derivate_funct_1d(sin)/dx and cos is 1.008e-04 (grid dx = 0.024592; the central difference is 2nd order, so the residual goes as dx²). Interpolated linearly, the 3 crossings zero_crossings_funct_1d returns are 1.000000π, 2.000000π and 3.000000π — at most 7.397e-08 away from the integer multiples. From a damped oscillation come a period of 0.199500 s (true 0.200000), a half period of 0.100000 s (true 0.100000), a time constant of 0.406307 s (true 0.4) and a delay of 25 samples (true 25, matched after whitening by differentiation). Ops used: derivate_funct_1d, integrate_funct_1d, zero_crossings_funct_1d, local_min_max_funct_1d, smooth_funct_1d_gauss, abs_funct_1d, get_pair_funct_1d, distance_funct_1d, match_funct_1d_trans, create_funct_1d_array.
- PNG (full size, 1 sheet):
docs/articles/assets/wing1d_funct1d_truth.png(1160x786 px, 78 kB) - Thumbnail (this is what the article shows):
docs/articles/assets/wing1d_funct1d_truth_thumb.jpg(60 kB) - Bundling: still
- SHA-256:
99ae8b3fff2af82965dbdb1341b2b9673d1f5a40917c214da746e2f2d26d0a27
The measured values burnt into this figure
```json { "derivative_max_error": 0.00010078909493371757, "dx": 0.024591723315771374, "zero_crossing_indices": [ 127, 255, 383 ], "zero_crossing_x_over_pi": [ 0.9999999260312996, 2.0, 3.000000073968701 ], "zero_crossing_max_deviation": 7.39687009421175e-08, "round_trip_max_error": 0.000151179880499952, "period_s": 0.1995, "period_true_s": 0.2, "half_period_s": 0.1, "half_period_true_s": 0.1, "tau_s": 0.40630736789098154, "tau_true_s": 0.4, "match_shift": 25, "match_shift_true": 25, "match_score": 0.7996386353789152, "n_peaks": 5, "n_zero_crossings": 8 } ```8. The smoothing trade-off
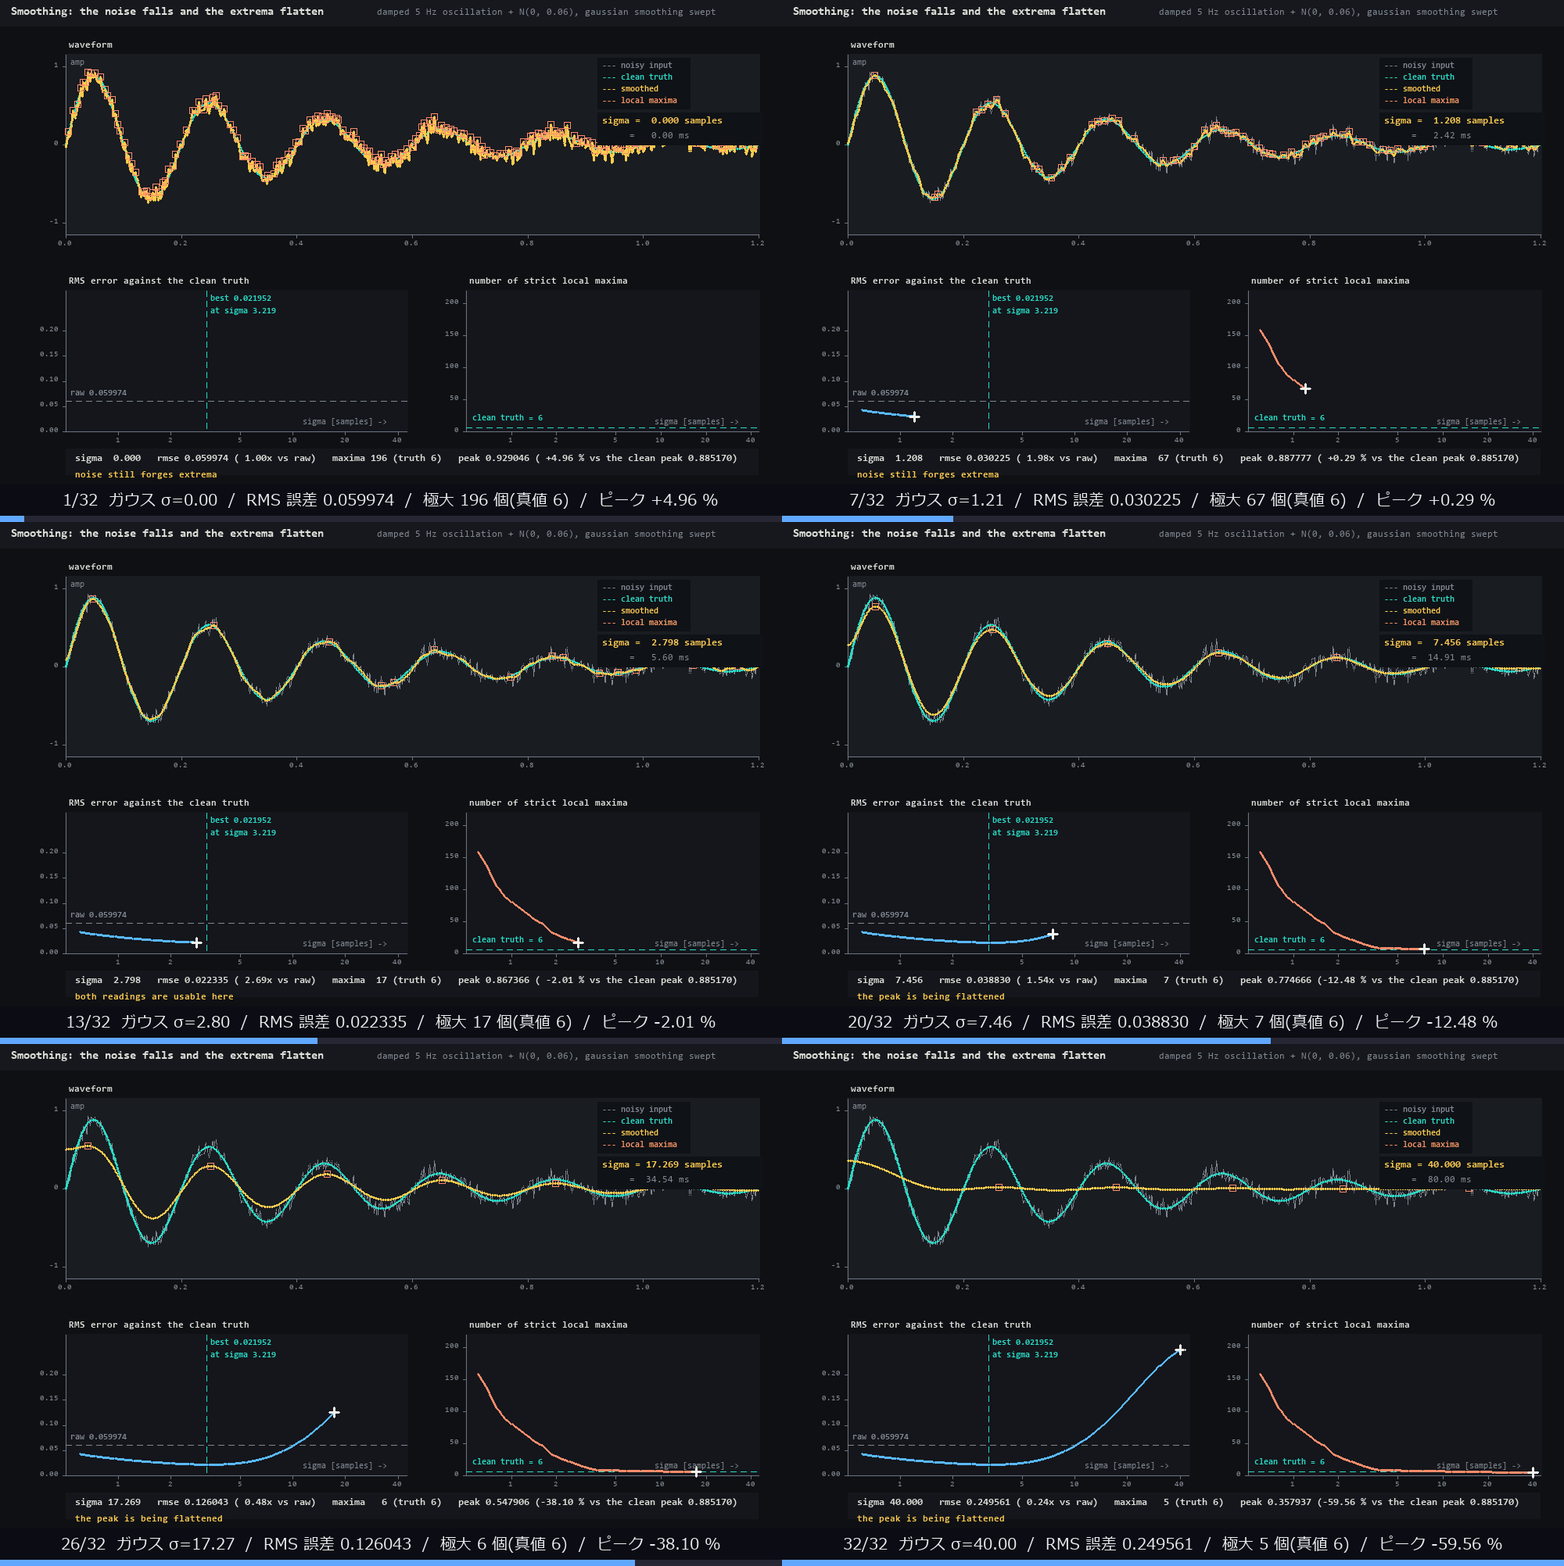
↑ The smoothing trade-off — a damped 5 Hz oscillation plus N(0, 0.06), Gaussian-smoothed with σ swept over 31 steps. On the raw signal local_min_max_funct_1d reports 196 maxima against a true 6 (it uses strict inequalities and has no noise model). The RMS error bottoms out at 0.021952 for σ = 3.219 (2.73x better than raw), and at that point the peak height is -2.77 % off the truth. Overdo it and σ = 40.0 takes the RMS error up to 0.249561 with the peak blunted by -59.56 %. Noise falls but extrema blunt — there is a minimum, and it is not free. Ops used: smooth_funct_1d_gauss, local_min_max_funct_1d.
- GIF:
docs/articles/assets/media/wing1d_smoothing_tradeoff.gif(32 frames, 1000x668 px, 1.06 MB, 220 ms/frame, last frame 1600 ms) - Thumbnail:
docs/articles/assets/thumbs/wing1d_smoothing_tradeoff_thumb.jpg - Bundling: gif
- SHA-256:
98a6eaff19a41a10f97d71410a577d5c54de58fd2574f66dc729f0aa38cd03da
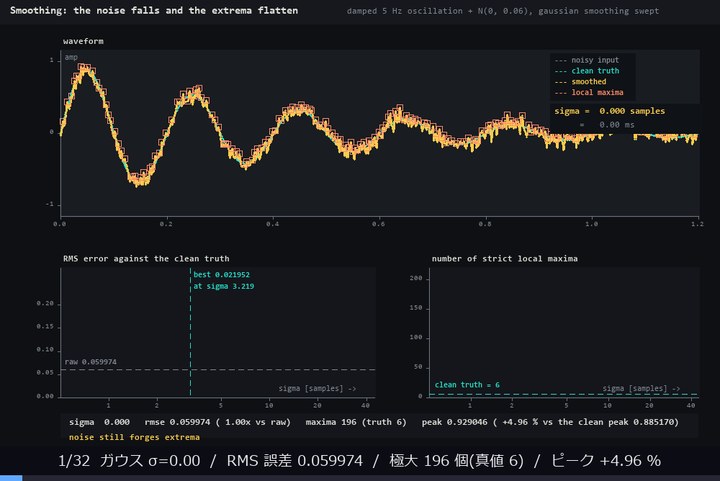
The measured values burnt into this figure
```json { "true_maxima": 6, "true_peak": 0.8851703018329985, "raw_rmse": 0.05997372648665996, "raw_maxima": 196, "raw_peak": 0.9290455796778364, "best_sigma": 3.2189538239993025, "best_rmse": 0.021951581267836598, "best_peak": 0.8606477705412539, "best_maxima": 12, "best_gain": 2.7320914040271584, "best_peak_loss_pct": -2.77037438343376, "over_sigma": 39.99999999999999, "over_rmse": 0.24956077599878743, "over_peak": 0.3579369203167514, "over_peak_loss_pct": -59.562931610387224, "frames": 32 } ```9. Sampling and aliasing
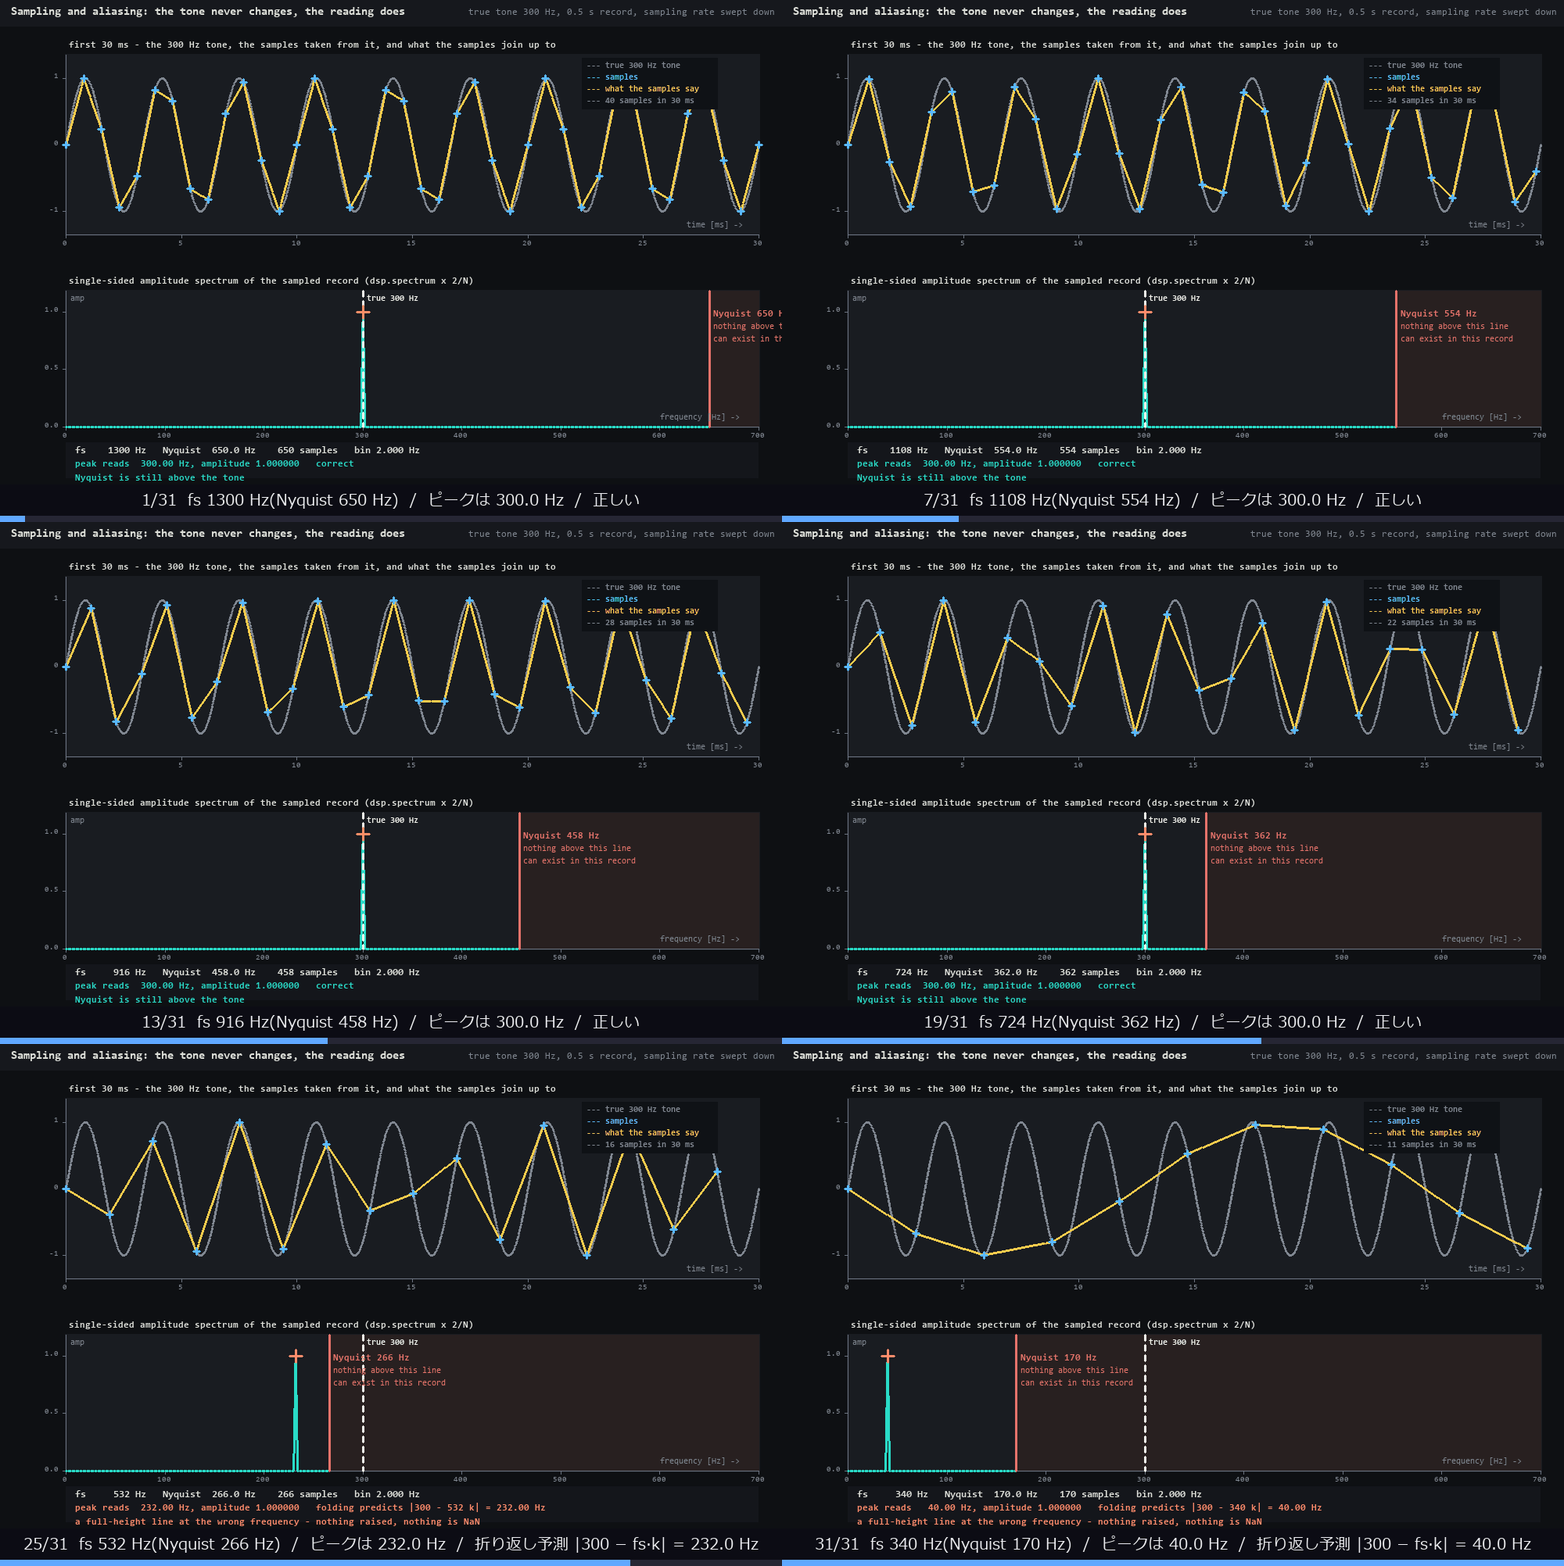
| *↑ Sampling and aliasing — the 300 Hz tone is never changed; only the sampling rate is lowered, from 1300 Hz to 340 Hz in 31 steps (0.5 s record, 2 Hz bins). Folding starts at fs = 596 Hz (Nyquist 298 Hz), and by the end, at fs = 340 Hz, a line of amplitude 1.000000 stands at 40.00 Hz — full height, and only the frequency is a lie. Across all 31 steps the measured peak differs from the folding prediction | f − fs·k | by at most 0.000 Hz. Everything to the right of the Nyquist line is burnt into the figure as a region that cannot exist in this record even in principle. Ops used: spectrum.* |
- GIF:
docs/articles/assets/media/wing1d_aliasing.gif(31 frames, 1000x668 px, 1.14 MB, 260 ms/frame, last frame 1800 ms) - Thumbnail:
docs/articles/assets/thumbs/wing1d_aliasing_thumb.jpg - Bundling: gif
- SHA-256:
221239e2f9d4e21e0f353b38e8621bf18b7c046d8d8b24f15bd0aa8c46d38176
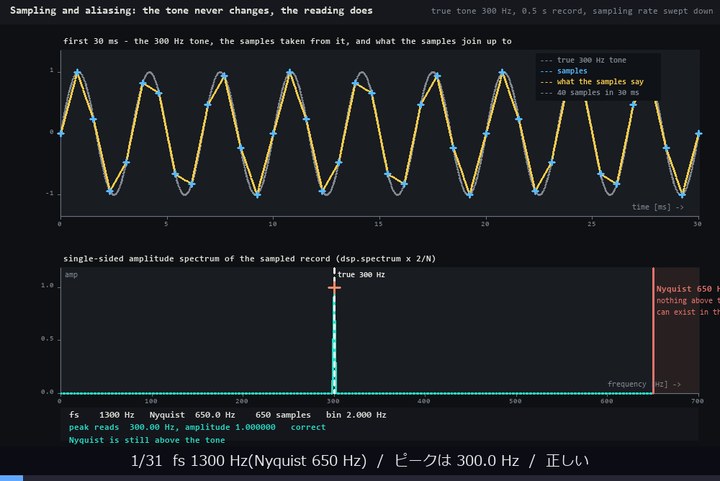
The measured values burnt into this figure
```json { "true_tone_hz": 300.0, "duration_s": 0.5, "rate_first": 1300.0, "rate_last": 340.0, "n_rates": 31, "first_alias_rate": 596.0, "first_alias_nyquist": 298.0, "max_abs_prediction_error_hz": 5.684341886080802e-14, "bin_resolution_hz": 2.0, "last": { "fs": 340.0, "nyquist": 170.0, "peak_hz": 40.0, "peak_amp": 1.0000000000000007, "expected": 40.0 }, "table": [ { "fs": 1300.0, "nyquist": 650.0, "peak_hz": 300.0, "expected": 300.0, "peak_amp": 0.9999999999999993 }, { "fs": 1172.0, "nyquist": 586.0, "peak_hz": 300.0, "expected": 300.0, "peak_amp": 1.0000000000000013 }, { "fs": 1044.0, "nyquist": 522.0, "peak_hz": 300.0, "expected": 300.0, "peak_amp": 0.9999999999999993 }, { "fs": 916.0, "nyquist": 458.0, "peak_hz": 300.0, "expected": 300.0, "peak_amp": 0.9999999999999996 }, { "fs": 788.0, "nyquist": 394.0, "peak_hz": 300.00000000000006, "expected": 300.0, "peak_amp": 1.0000000000000002 }, { "fs": 660.0, "nyquist": 330.0, "peak_hz": 300.0, "expected": 300.0, "peak_amp": 0.999999999999999 }, { "fs": 532.0, "nyquist": 266.0, "peak_hz": 232.0, "expected": 232.0, "peak_amp": 1.0000000000000009 }, { "fs": 404.0, "nyquist": 202.0, "peak_hz": 104.0, "expected": 104.0, "peak_amp": 0.9999999999999986 } ] } ```10. Where a 1-D profile comes from
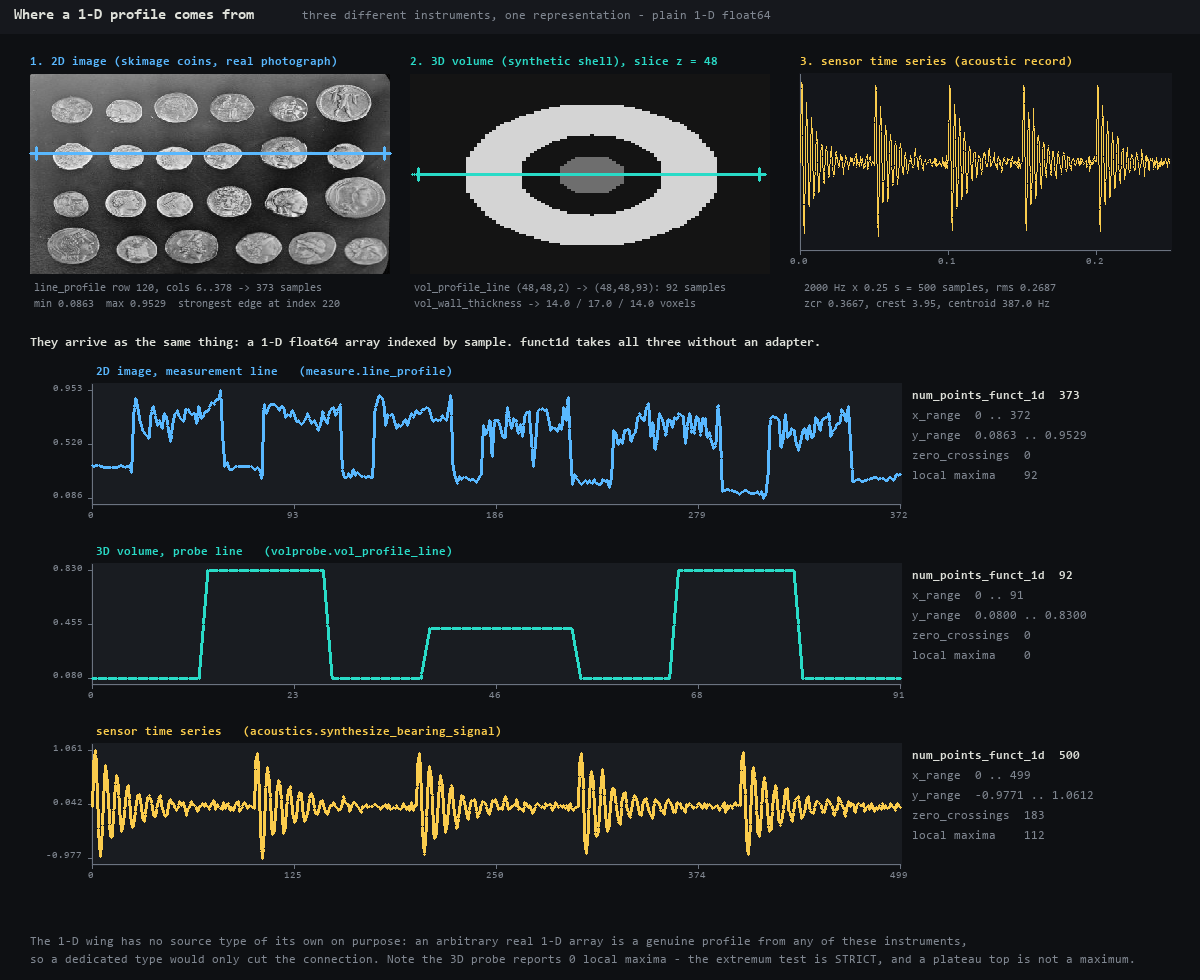
↑ Where a 1-D profile comes from — a measurement line across a 2-D image (the real photograph coins, 373 samples, strongest edge at index 220.0), a probe through a 3-D volume (92 samples, wall thicknesses 14.00 / 17.00 / 14.00 voxels), and a sensor time series (500 samples, rms 0.2687, spectral centroid 387.0 Hz). All 3 arrive as plain 1-D float64, so funct1d eats them with no adapter. That is why the 1-D wing was given no type of its own — any real 1-D array really is a legitimate profile whatever instrument it came from, and carving out a type would only cost you the connection. Ops used: line_profile, profile_stats, vol_profile_line, vol_wall_thickness, signal_features, create_funct_1d_array, num_points_funct_1d, x_range_funct_1d, y_range_funct_1d, zero_crossings_funct_1d, local_min_max_funct_1d.
- PNG (full size, 1 sheet):
docs/articles/assets/wing1d_profile_sources.png(1200x980 px, 176 kB) - Thumbnail (this is what the article shows):
docs/articles/assets/wing1d_profile_sources_thumb.jpg(85 kB) - Bundling: still
- SHA-256:
63ede6fea12f329925659543e61d942c94e337a620dc99ed0e22d1d8b852f328
The measured values burnt into this figure
```json { "image_source": "studio_assets/sample_images/coins.png (skimage coins, real photo)", "profile2d": { "n": 373, "min": 0.08627450980392157, "max": 0.9529411764705882, "mean": 0.54881984965568, "edge_at": 220.0 }, "profile3d": { "n": 92, "length_voxels": 91.0, "min": 0.08, "max": 0.83, "wall_thicknesses": [ 14.0, 17.0, 14.0 ] }, "sensor": { "n": 500, "rate_hz": 2000.0, "rms": 0.268716, "zcr": 0.366733, "crest_factor": 3.9493, "centroid_hz": 386.98, "peak_freq_hz": 300.0, "bandwidth_hz": 237.537 }, "funct1d": [ { "name": "2D image, measurement line", "op": "measure.line_profile", "n": 373, "xr": [ 0.0, 372.0 ], "yr": [ 0.08627450980392157, 0.9529411764705882 ], "nzc": 0, "nmax": 92 }, { "name": "3D volume, probe line", "op": "volprobe.vol_profile_line", "n": 92, "xr": [ 0.0, 91.0 ], "yr": [ 0.08, 0.83 ], "nzc": 0, "nmax": 0 }, { "name": "sensor time series", "op": "acoustics.synthesize_bearing_signal", "n": 500, "xr": [ 0.0, 499.0 ], "yr": [ -0.9770901925470433, 1.0612360539292967 ], "nzc": 183, "nmax": 112 } ] } ```11. Peak detection and matching
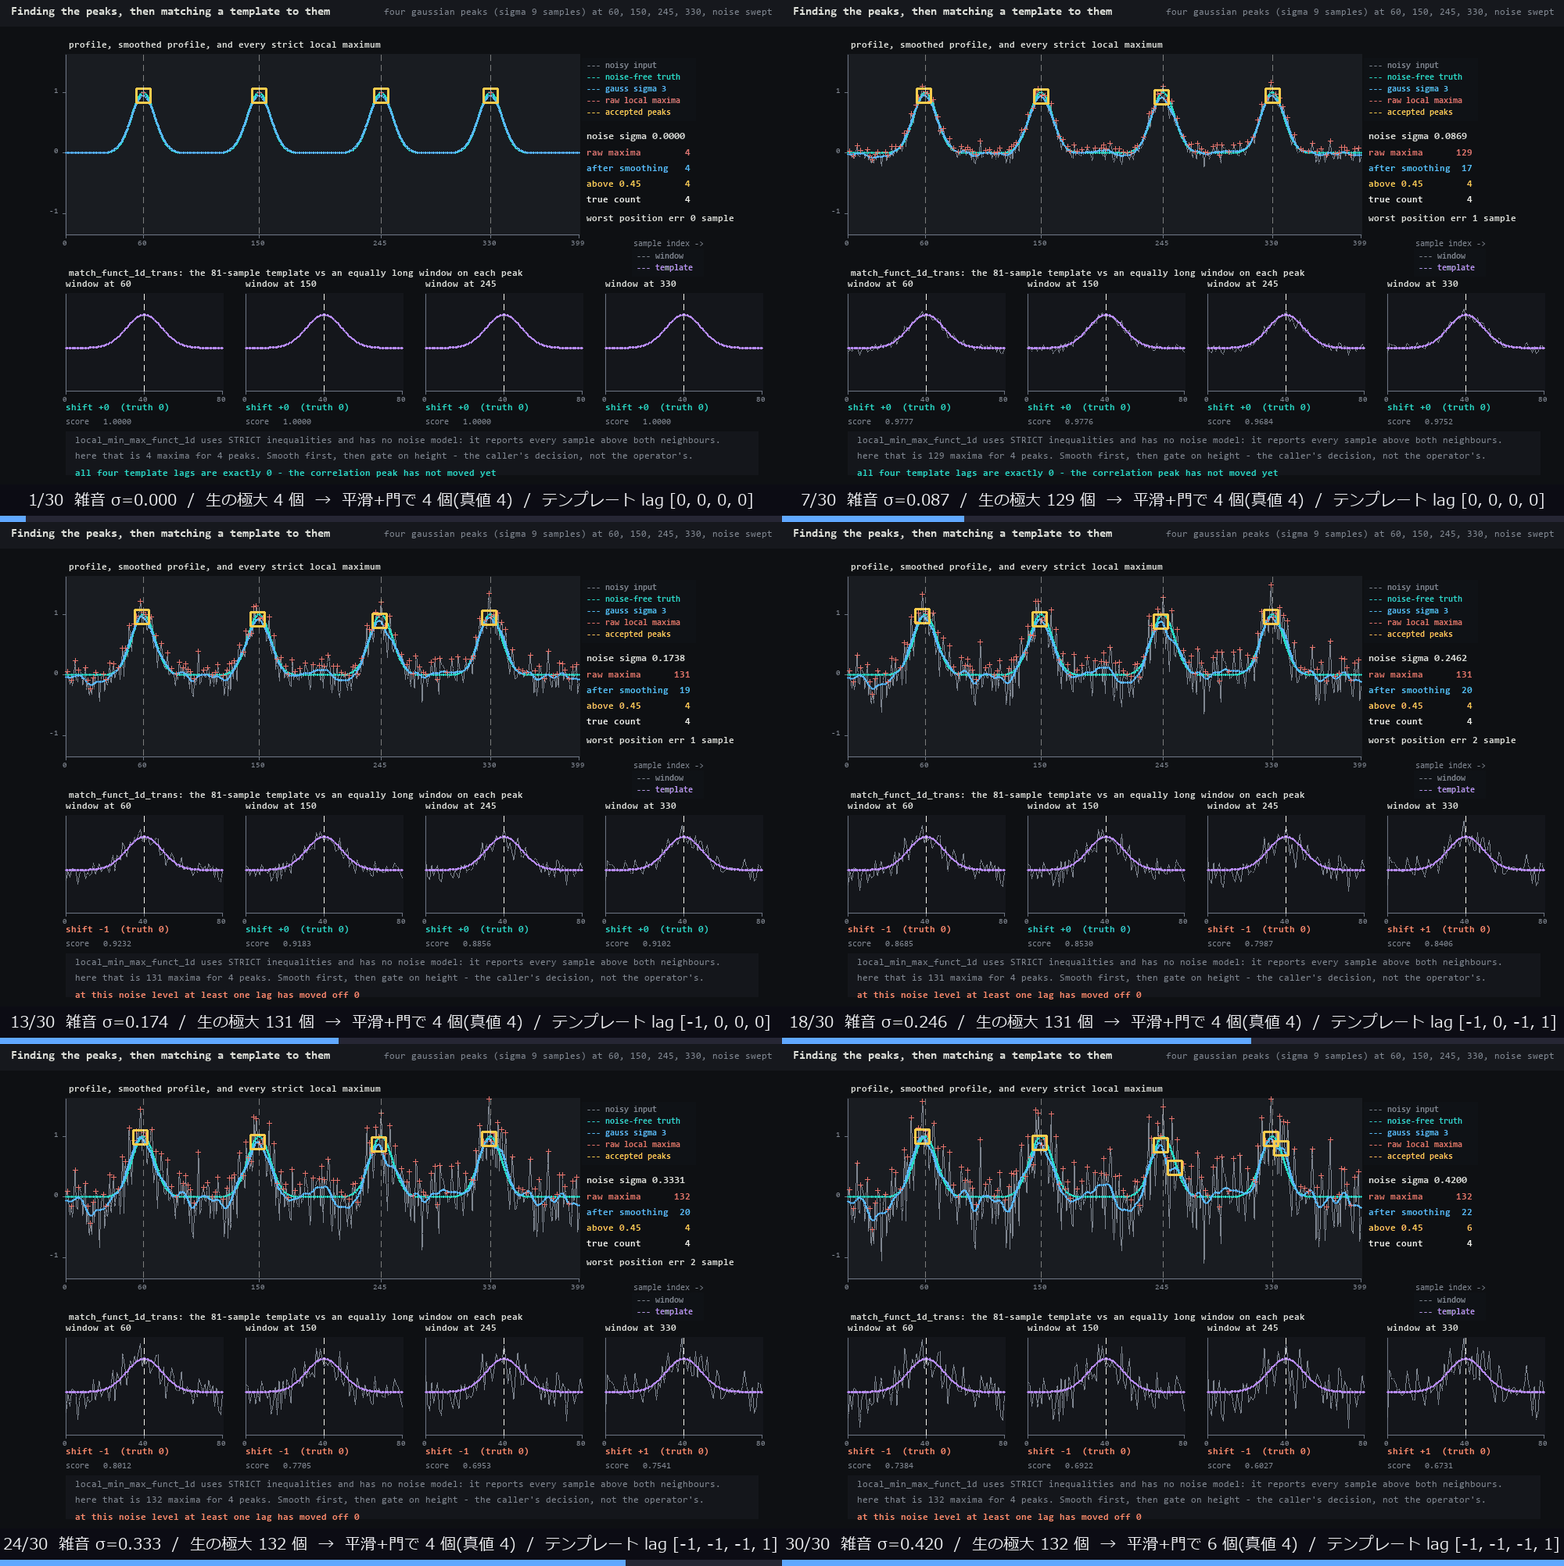
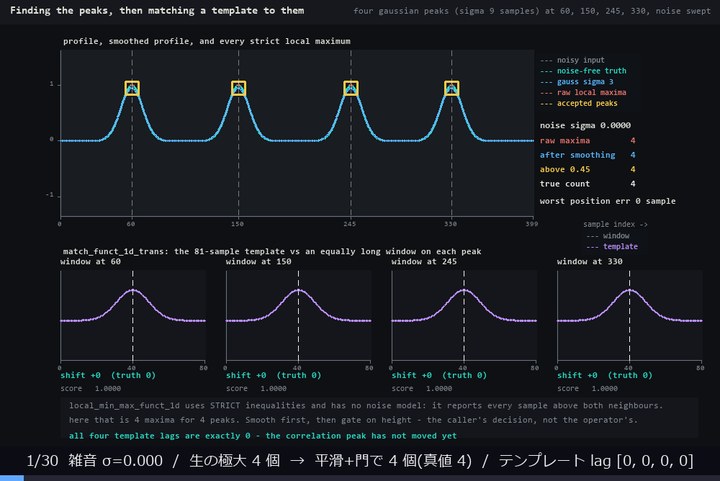
↑ Peak detection and matching — Gaussian peaks are raised at 4 known positions (60, 150, 245, 330) and noise is added over 30 steps from σ = 0 to 0.42. Because local_min_max_funct_1d uses strict inequalities, the raw waveform’s maxima blow up from 4 to 132. Put it through a σ = 3 Gaussian smoothing and a height gate of 0.45 and it settles at 6 to the very end ([58, 149, 243, 254, 329, 337]). As long as the window and the template are the same length, match_funct_1d_trans returns lag = 0 exactly for all 4 positions in 12 of the 30 steps (up to σ 0.159). Ops used: smooth_funct_1d_gauss, local_min_max_funct_1d, match_funct_1d_trans.
- GIF:
docs/articles/assets/media/wing1d_peak_match.gif(30 frames, 1000x668 px, 1.45 MB, 240 ms/frame, last frame 1600 ms) - Thumbnail:
docs/articles/assets/thumbs/wing1d_peak_match_thumb.jpg - Bundling: gif
- SHA-256:
d14889843693fa5a0da90e3affd43d08409e16fb91c4990499b22e06b9238139
The measured values burnt into this figure
```json { "true_centres": [ 60, 150, 245, 330 ], "peak_sigma_samples": 9.0, "template_length": 81, "n_frames": 30, "sigma_max": 0.42, "raw_maxima_first": 4, "raw_maxima_last": 132, "smoothed_maxima_last": 22, "accepted_last": 6, "positions_last": [ 58, 149, 243, 254, 329, 337 ], "exact_lag_levels": 12, "total_levels": 30, "exact_lag_up_to_sigma": 0.1593103448275862 } ```12. Clip the end off the envelope and it is 76 % wrong
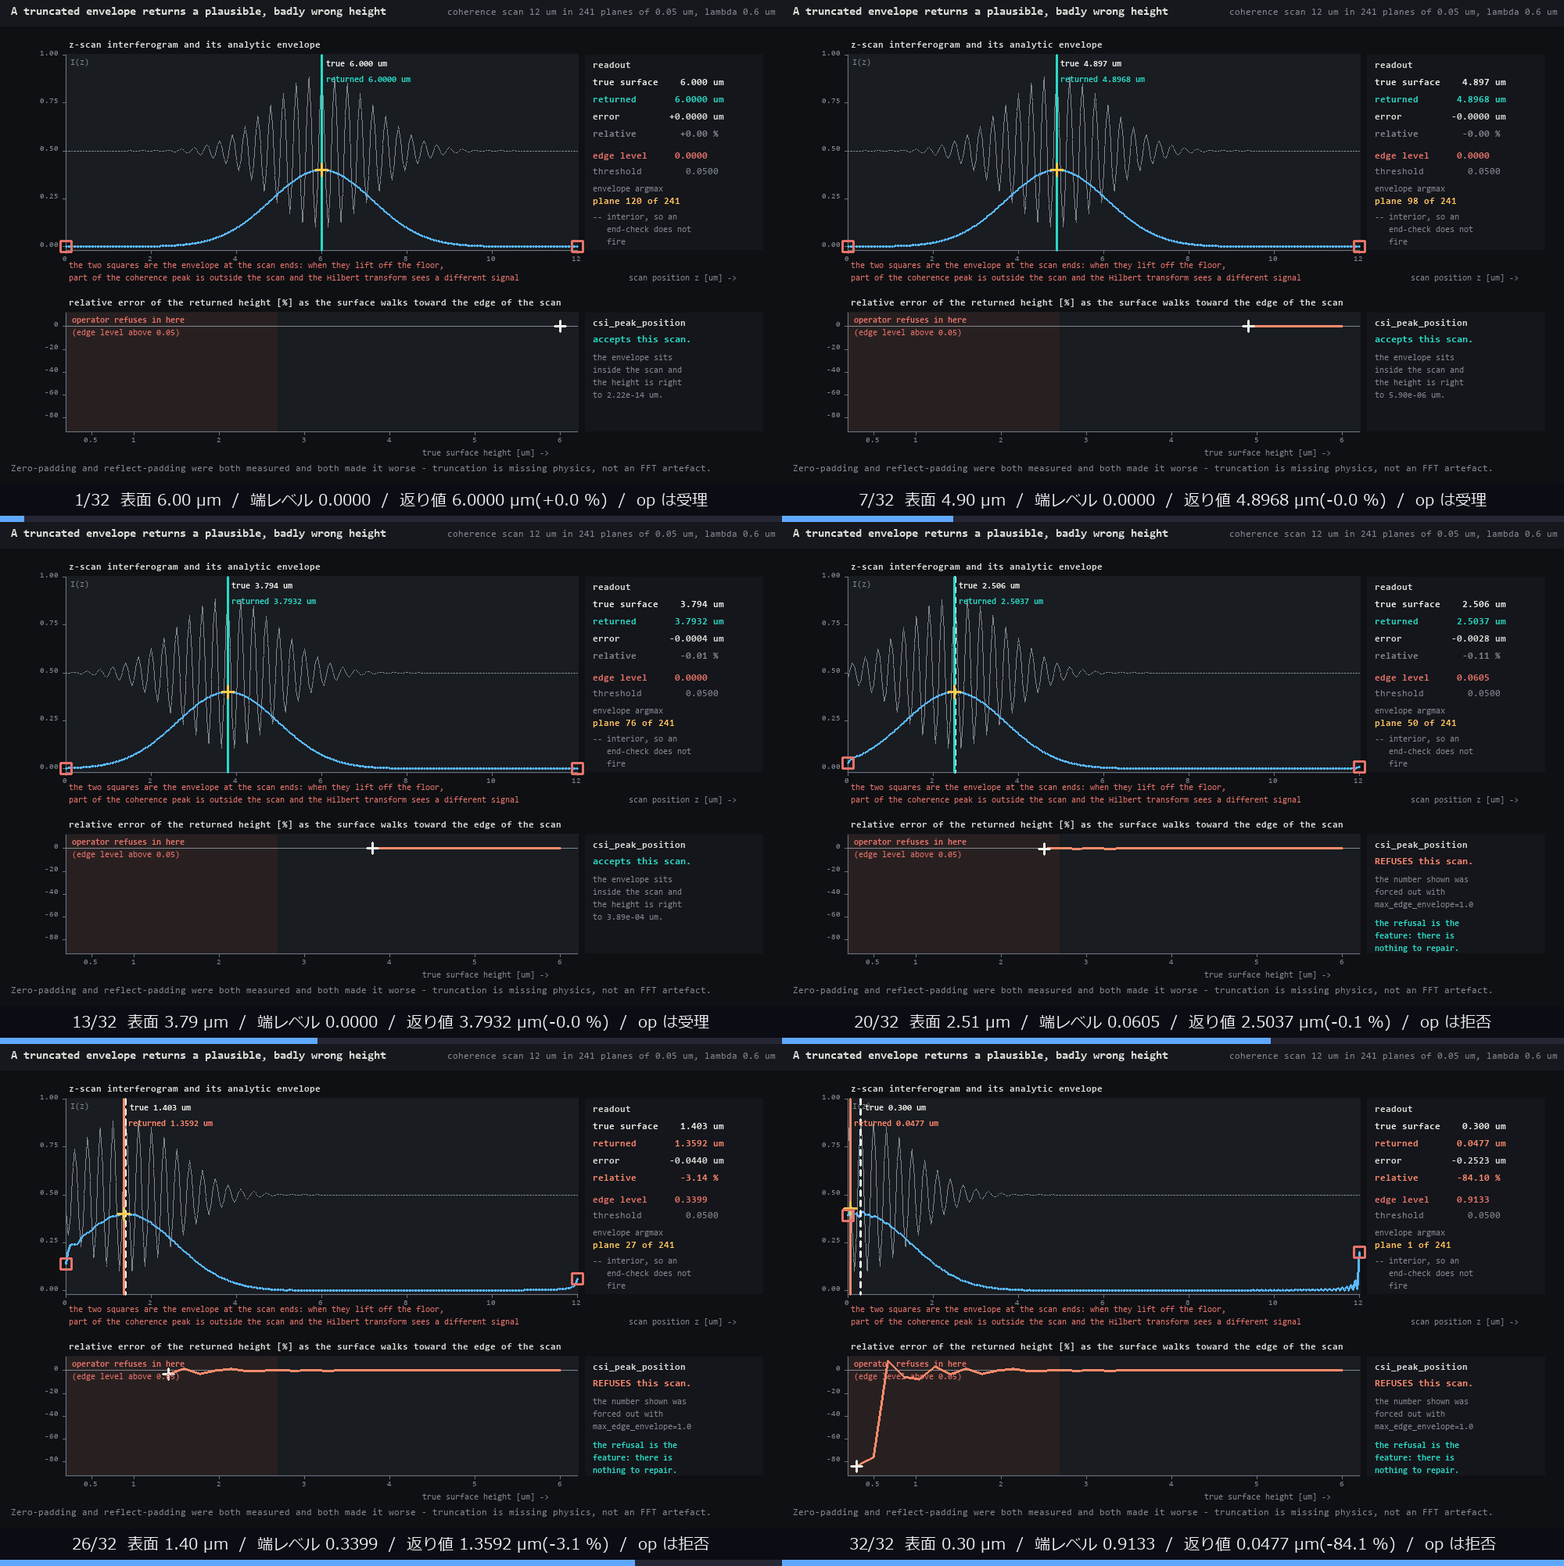
↑ Clip the end off the envelope and it is 76 % wrong — within a 12 µm scan (241 planes × 0.05 µm), the surface is walked in 32 steps from 6.0 µm at the centre to 0.30 µm at the very end. Centred, the error is 2.2e-14 µm. With the surface at 0.500 µm, csi_peak_position returns 0.1190 µm — finite, plausible, and 76 % wrong. Worse, the envelope’s argmax is the 2nd of the 241 planes, i.e. interior, so the obvious “refuse anything pinned to an edge” check never fires (the worst point of the sweep is 84 % at 0.30 µm, and even there the argmax is plane 1). The op does start refusing from a surface of 2.69 µm, where the median-referenced edge level passes 0.0539 (the values in the figure were forced out with max_edge_envelope=1.0). Ops used: csi_signal_simulate, csi_envelope, csi_peak_position.
- GIF:
docs/articles/assets/media/wing1d_envelope_truncation.gif(32 frames, 1000x668 px, 1.43 MB, 240 ms/frame, last frame 2000 ms) - Thumbnail:
docs/articles/assets/thumbs/wing1d_envelope_truncation_thumb.jpg - Bundling: gif
- SHA-256:
ce035df03e06ff0c2e1b5ce485f16e45782ef8613f1475b1371d1d93c74e3612
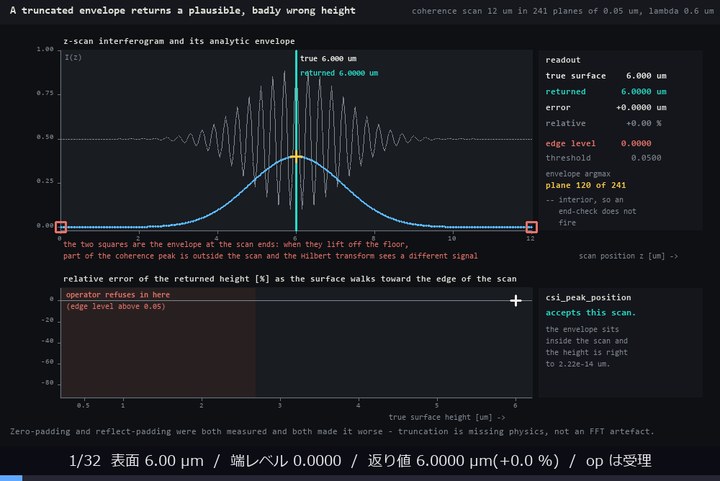
The measured values burnt into this figure
```json { "scan_planes": 241, "z_step_um": 0.05, "z_range_um": 12.0, "wavelength_um": 0.6, "n_frames": 32, "surface_first": 6.0, "surface_last": 0.3, "first_refusal_surface": 2.690323, "first_refusal_edge": 0.05392259854284297, "worst_surface": 0.3, "worst_returned": 0.04768769253057824, "worst_rel_pct": -84.10410248980725, "worst_argmax_plane": 1, "documented_surface": 0.5, "documented_returned": 0.11898968048241321, "documented_rel_pct": -76.20206390351736, "documented_edge": 0.636140666887029, "documented_argmax_plane": 2, "centred_error_um": 2.220446049250313e-14, "centred_edge": 0.0, "table": [ { "surface": 6.0, "edge": 0.0, "returned": 6.000000000000022, "rel_pct": 3.7007434154171886e-13, "argmax": 120, "refused": false }, { "surface": 5.080645, "edge": 0.0, "returned": 5.080647081606085, "rel_pct": 4.0971295686360194e-05, "argmax": 102, "refused": false }, { "surface": 4.16129, "edge": 0.0, "returned": 4.161139025318186, "rel_pct": -0.0036280740302651357, "argmax": 83, "refused": false }, { "surface": 3.241935, "edge": 0.0, "returned": 3.239315199806879, "rel_pct": -0.08080976926190077, "argmax": 65, "refused": false }, { "surface": 2.322581, "edge": 0.06881176874572165, "returned": 2.31045038505397, "rel_pct": -0.522290285937501, "argmax": 46, "refused": true }, { "surface": 1.403226, "edge": 0.3399177997568482, "returned": 1.359190567949887, "rel_pct": -3.1381567937105688, "argmax": 27, "refused": true }, { "surface": 0.5, "edge": 0.636140666887029, "returned": 0.11898968048241321, "rel_pct": -76.20206390351736, "argmax": 2, "refused": true } ] } ```13. How the defect frequency comes out (the process)
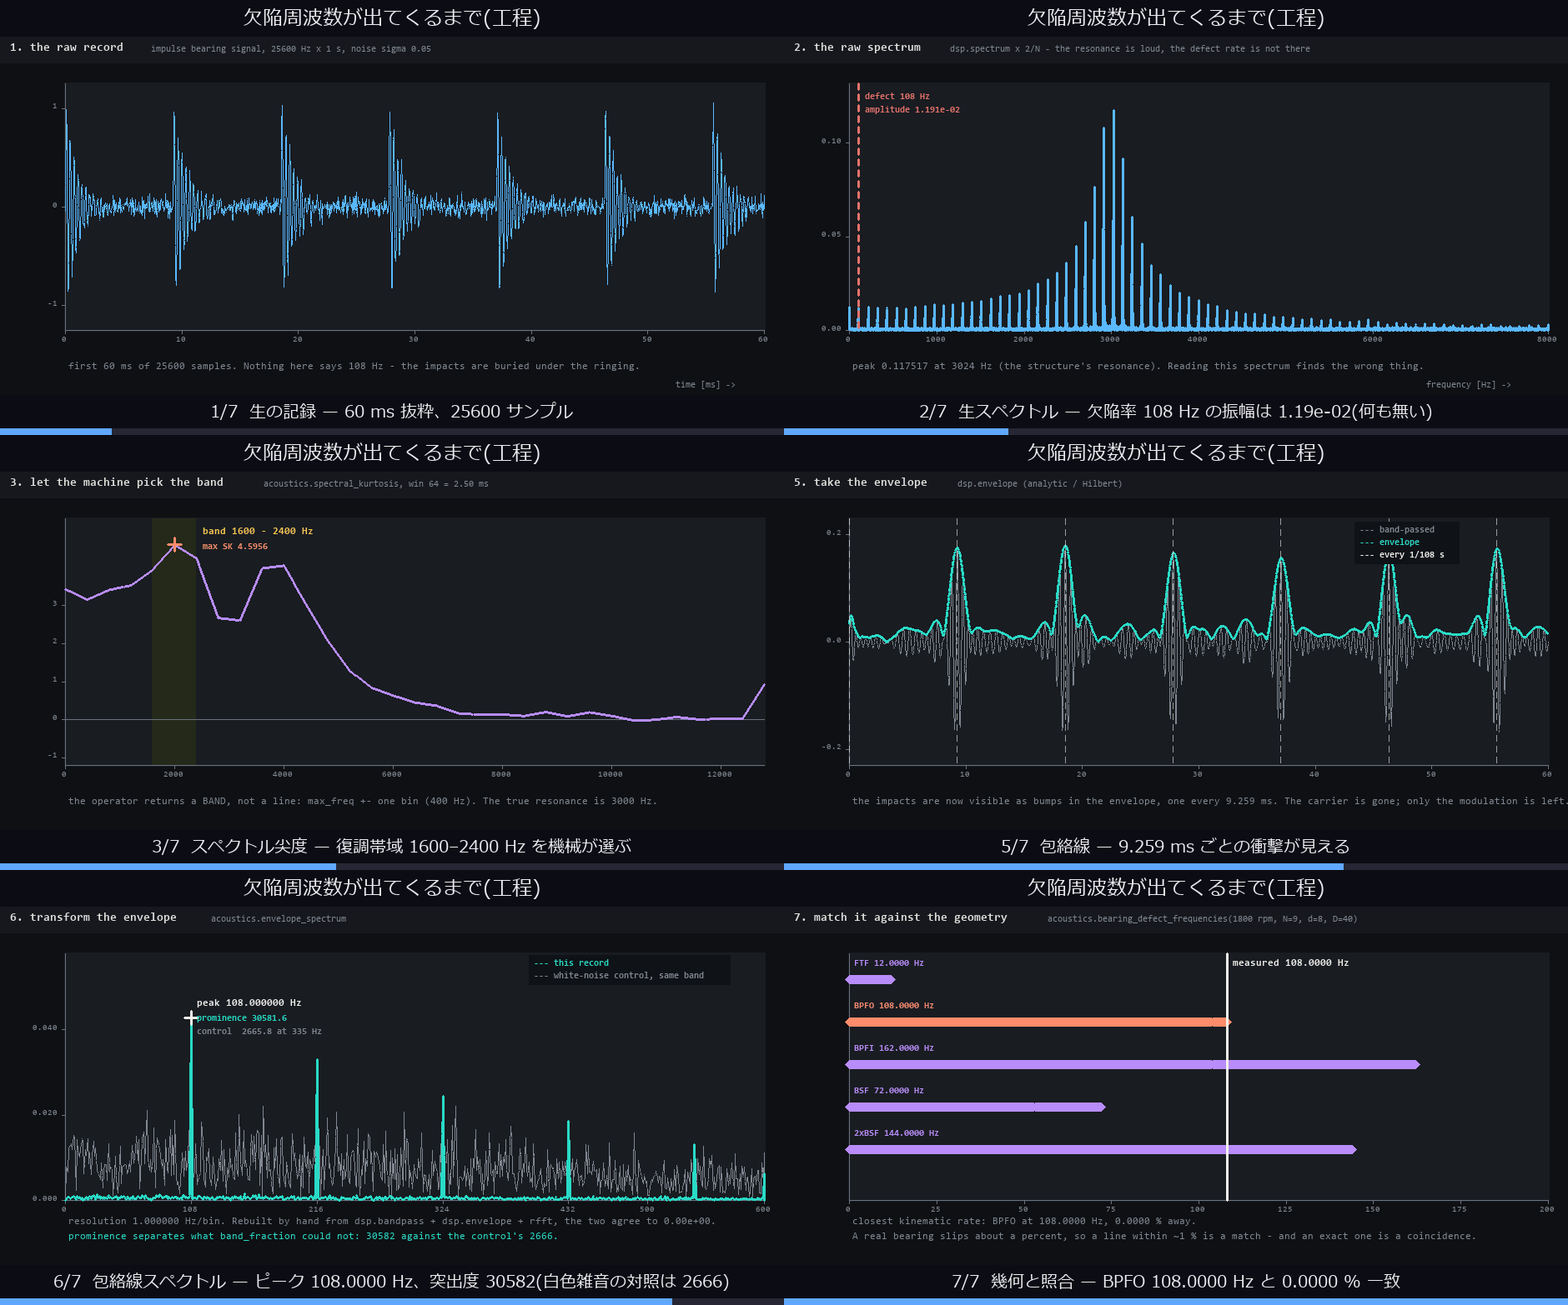
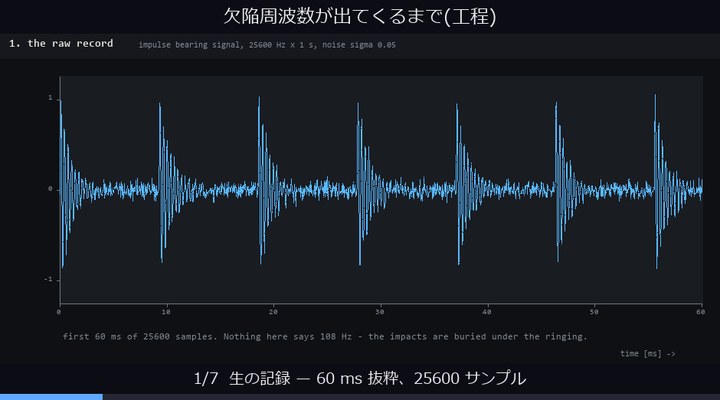
↑ How the defect frequency comes out (the process) — a bearing record deliberately excited at the outer-race pass frequency the geometry gives, BPFO = 108.0000 Hz, is taken to a diagnosis in 7 steps. In the raw spectrum the defect rate carries an amplitude of only 1.19e-02; what stands out is the 3024 Hz structural resonance (0.1175). Spectral kurtosis (window 64, maximum 4.5956 @ 2000 Hz) picks the demodulation band 1600–2400 Hz — 1000 Hz below the true 3000 Hz resonance, because SK returns a band, not a line — and band-pass → envelope → transform gives 108.0000 Hz, which matches the geometric BPFO of 108.0000 Hz to 0.0000 %. The honest breakdown: that band’s band_fraction is 0.2250, indistinguishable from the 0.2348 of white noise put through the same band. What separates them is the prominence instead, 30582 against 2666 (a human picking 2600–3400 Hz, straddling the resonance, raises band_fraction to 0.8368). Hand-assembling the same thing from dsp.bandpass + dsp.envelope + rfft agrees with the op’s return to 0.0e+00 — the proof that nothing was rebuilt. Ops used: bearing_defect_frequencies, synthesize_bearing_signal, spectrum, spectral_kurtosis, bandpass, envelope, envelope_spectrum.
- GIF:
docs/articles/assets/media/wing1d_envelope_flow.gif(7 frames, 940x522 px, 0.18 MB, 1500 ms/frame, last frame 3000 ms) - Thumbnail:
docs/articles/assets/thumbs/wing1d_envelope_flow_thumb.jpg - Bundling: gif
- SHA-256:
b437cde7351aeaac59a4aed6f0a757a0cdd6f5d019d1a97f7ab392e2c141dc04
The measured values burnt into this figure
```json { "rpm": 1800.0, "n_elements": 9, "element_diameter_mm": 8.0, "pitch_diameter_mm": 40.0, "bpfo_hz": 108.0, "bpfi_hz": 162.0, "ftf_hz": 12.0, "bsf_hz": 72.0, "synth_defect_hz": 108.0, "carrier_hz": 3000.0, "rate_hz": 25600.0, "duration_s": 1.0, "raw_amplitude_at_defect": 0.011914549427139143, "raw_peak_amplitude": 0.11751702164005307, "raw_peak_hz": 3024.0, "sk_max_kurtosis": 4.595572911742822, "sk_max_freq": 2000.0, "sk_bin_hz": 400.0, "sk_win": 64, "band_low_hz": 1600.0, "band_high_hz": 2400.0, "envelope_peak_freq": 108.0, "envelope_peak_amplitude": 0.04283185557071618, "envelope_band_fraction": 0.22500945540780717, "envelope_prominence": 30581.617076490267, "envelope_resolution_hz": 1.0, "control_band_fraction": 0.23476298878207671, "control_prominence": 2665.7791158181667, "control_peak_freq": 335.0, "resonance_band": [ 2600.0, 3400.0 ], "resonance_band_fraction": 0.8367515281311655, "resonance_band_peak_freq": 108.0, "resonance_band_peak_amplitude": 0.19825734899498038, "resonance_band_prominence": 11164.842724089745, "manual_vs_operator_max_abs_diff": 0.0, "closest_rate_name": "BPFO", "closest_rate_hz": 108.0, "closest_rate_error_pct": 0.0, "steps": 7 } ```14. Fractional-octave bands — the even fractions have no 1 kHz band
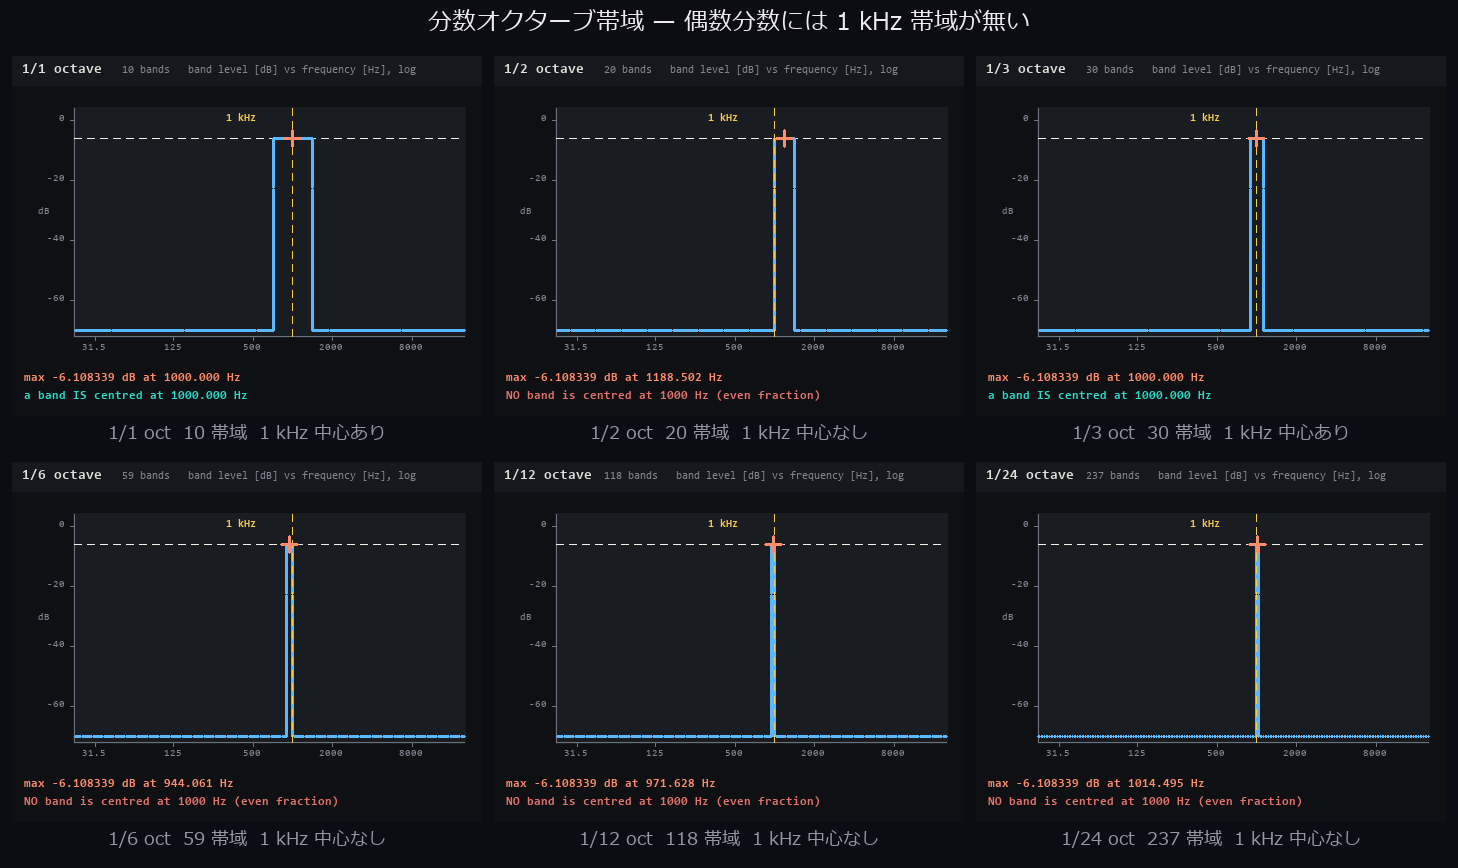
↑ Fractional-octave bands — the even fractions have no 1 kHz band — 6 sheets measuring a 1000 Hz pure tone of amplitude 0.7 in 1/1, 1/2, 1/3, 1/6, 1/12 and 1/24 octaves. Every fraction returns the closed form 10log10(A²/2) = -6.108339 dB for the band level (largest difference 0.0e+00 dB). What differs is which band reports it: for the odd fractions [1, 3] there is a band centred on exactly 1000.000 Hz, while for the even ones [2, 6, 12, 24] the exponent offset puts 1000 Hz on a band edge, so the same energy is reported from an awkward band centred at 1188.50 Hz, 944.06 Hz, 971.63 Hz or 1014.50 Hz. That is a definition and not a defect, but quoting “the level at 1 kHz” without knowing it makes the quote a lie. Empty bands fall to the floor (−200 dB) rather than to −inf. Ops used: octave_bands, octave_spectrum.
- PNG (tile):
docs/articles/assets/wing1d_octave_family.png(1458x868 px, 54 kB, 6 panels / 3 columns) - Thumbnail (this is what the article shows):
docs/articles/assets/wing1d_octave_family_thumb.jpg(47 kB) - Bundling: sheet
- SHA-256:
986bd447a3a01fe7fb0ead8a50aea99bec869fb81a57752a74916f0ae4c83c72